Sample Category Title
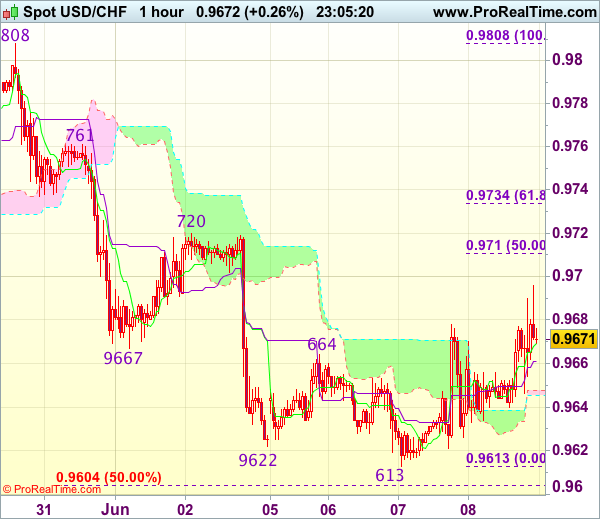
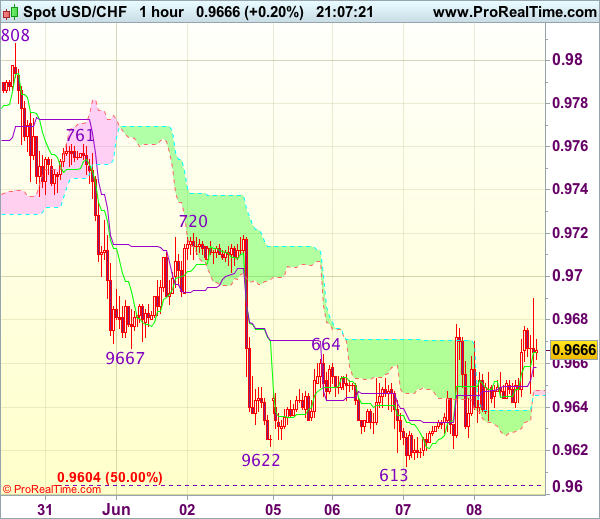
Trade Idea Wrap-up: USD/CHF – Sell at 0.9720
USD/CHF - 0.9671
Most recent candlesticks pattern : N/A
Trend : Near term down
Tenkan-Sen level : 0.9669
Kijun-Sen level : 0.9661
Ichimoku cloud top : 0.9648
Ichimoku cloud bottom : 0.9646
Original strategy :
Sell at 0.9720, Target: 0.9620, Stop: 0.9755
Position : -
Target : -
Stop : -
New strategy :
Sell at 0.9720, Target: 0.9620, Stop: 0.9755
Position : -
Target : -
Stop : -
Dollar’s rebound after marginal fall to 0.9613 suggests consolidation above this level would be seen and corrective bounce to 0.9700 is likely, however, reckon upside would be limited to resistance at 0.9720 and bring another decline later to 0.9600-05 (50% projection of 1.0100-0.9692 measuring from 0.9808) but oversold condition should limit downside to 0.9570 and price should stay above support at 0.9550, risk from there has increased for a rebound to take place later.
In view of this, we are looking to sell dollar on recovery as resistance at 0.9720 should limit upside. Above 0.9740 would abort and signal a temporary low is formed instead, bring a stronger rebound to 0.9761 resistance but price should falter below resistance at 0.9808.
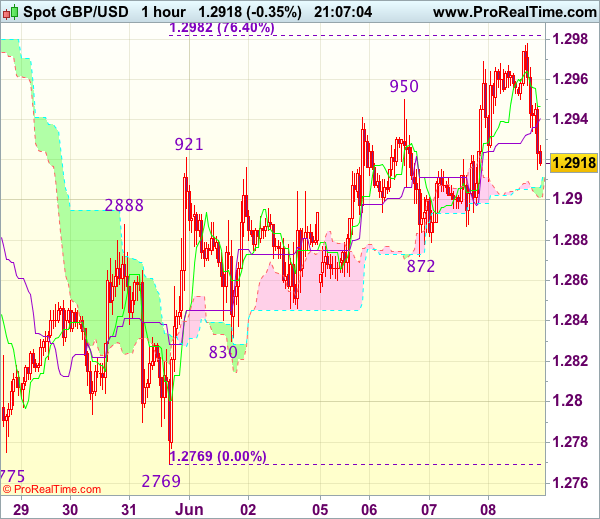
Trade Idea Wrap-up: GBP/USD – Stand aside
GBP/USD - 1.2935
Most recent candlesticks pattern : N/A
Trend : Near term down
Tenkan-Sen level : 1.2943
Kijun-Sen level : 1.2943
Ichimoku cloud top : 1.2913
Ichimoku cloud bottom : 1.2911
New strategy :
Stand aside
Position : -
Target : -
Stop : -
Cable has finally retreated after intra-day brief rise to 1.2978, suggesting consolidation below this level would be seen and weakness to 1.2885-90 cannot be ruled out, however, break of indicated support at 1.2872 is needed to signal top has been formed, bring further weakness to 1.1245-50 and possibly test of key support 1.2830 which is likely to hold on first testing.
On the upside, expect recovery to be limited to 1.2955-60 and said resistance at 1.2978 should continue to hold, bring another retreat. Only break there would extend gain to 1.3000 but still reckon upside would be limited to 1.3015 resistance and recent high at 1.3048 should remain intact.
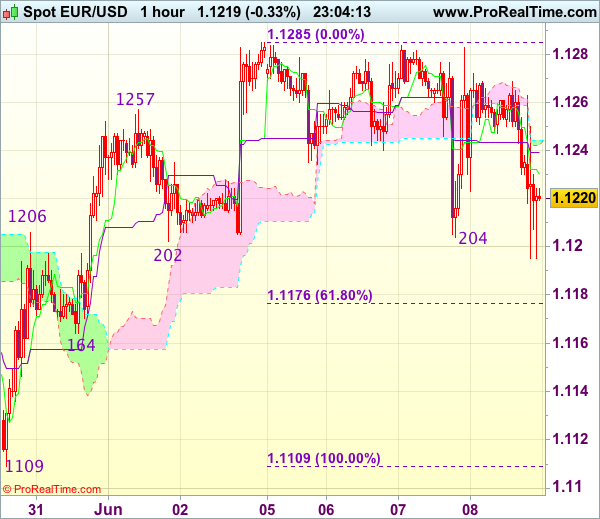
Trade Idea Wrap-up: EUR/USD – Stand aside
EUR/USD - 1.1221
Most recent candlesticks pattern : N/A
Trend : Up
Tenkan-Sen level : 1.1258
Kijun-Sen level : 1.1244
Ichimoku cloud top : 1.1267
Ichimoku cloud bottom : 1.1259
New strategy :
Stand aside
Position : -
Target : -
Stop : -
Failure to extend early rebound from 1.1204 and the subsequent retreat after faltering below strong resistance at 1.1285 suggest further consolidation would be seen and weakness to 1.1195 is likely, however, break of indicated support 1.1164 is needed to confirm top has been formed at 1.1285, bring subsequent decline to 1.1145-50 first.
In view of this, would not chase this fall here and would be prudent to stand aside in the meantime. Above 1.1245-50 would bring another bounce to 1.1270 but only break of said resistance at 1.1285 would revive bullishness and confirm recent upmove has resumed and extend further gain to previous chart resistance at 1.1300, break there would encourage for headway to 1.1340-45 and later towards chart point at 1.1366.
Trade Idea Wrap-up: USD/JPY – Hold short entered at 110.20
USD/JPY - 110.23
Most recent candlesticks pattern : N/A
Trend : Down
Tenkan-Sen level : 109.98
Kijun-Sen level : 109.81
Ichimoku cloud top : 109.90
Ichimoku cloud bottom : 109.39
Original strategy :
Sold at 110.20, Target: 109.20, Stop: 110.55
Position : - Short at 110.20
Target : - 109.20
Stop : - 110.55
New strategy :
Hold short entered at at 110.20, Target: 109.20, Stop: 110.55
Position : - Short at 110.20
Target : - 109.20
Stop : - 110.55
Although the greenback found renewed buying interest at 109.38 and has staged a strong rebound, as this move is viewed as retracement of recent decline, reckon upside would be limited to previous support at 110.31 and bring retreat later, below said support at 109.38 would signal an intra-day top is formed, bring another fall towards this week’s low at 109.11 which is likely to hold on first testing.
In view of this, we are holding on to our short position entered at 110.20. Above 110.50 would defer and suggest low is formed instead, bring a stronger rebound to 110.60 but break of resistance at 110.73 is needed to add credence to this view.

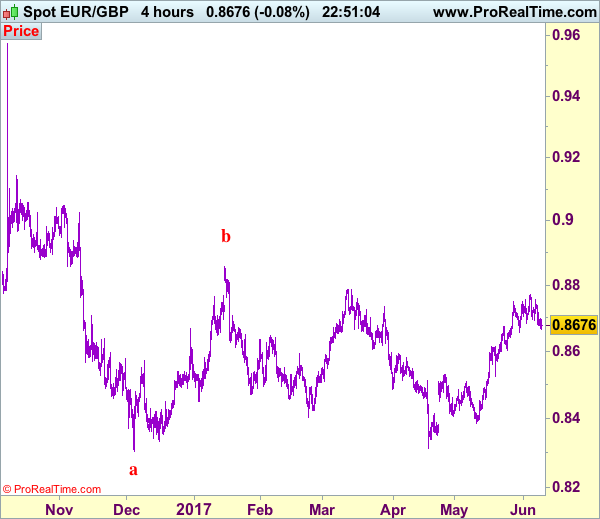
Trade Idea: EUR/GBP – Hold short entered at 0.8735
EUR/GBP - 0.8668
Recent wave: Major double three (A)-(B)-(C)-(X)-(A)-(B)-(C) is unfolding and 2nd (A) has possibly ended at 0.6936.
Trend: Near term up
Original strategy :
Sold at 0.8735, Target: 0.8610, Stop: 0.8760
Position : - Short at 0.8735
Target : - 0.8610
Stop : - 0.8760
New strategy :
Hold short entered at 0.8735, Target: 0.8610, Stop: 0.8725
Position : - Short at 0.8735
Target : - 0.8610
Stop : - 0.8725
Euro’s retreat after meeting resistance at 0.8756 has retained our view that further consolidation below this week’s high at 0.9771 would be seen and mild downside bias remains for another retreat towards indicated support at 0.8655, however, break there is needed to add credence to our view that a temporary top is formed, bring retracement of recent rise to 0.8600-10 later.
In view of this, we are holding on to our short position entered at 0.8735. Only above 0.8771 would extend recent rise from 0.8312 low to previous resistance at 0.8788, however, reckon upside would be limited to 0.8800-10 due to weakening of upward momentum.
Our preferred count is that, after forming a major top at 0.9805 (wave V), (A)-(B)-(C) correction is unfolding with (A) leg ended at 0.8400 (A: 0.8637, B: 0.9491 and 5-waver C ended at 0.8400. Wave (B) has ended at 0.9413 and impulsive wave (C) has either ended at 0.8067 or may extend one more fall to 0.8000 before prospect of another rally. Current breach of indicated resistance at 0.9043 confirms our view that the (C) leg has ended and bring stronger rebound towards 0.9150/54, then towards 0.9240/50.
ECB Refrained from Talking about Tapering, though Noted that Interest Rates Unlikely Lower
ECB President Mario Draghi poured cold water onto hawks who had anticipated a more upbeat policy statement following recent improvement in macroeconomic data. However, the central bank downgraded the inflation forecasts for three years despite upward revision on GDP growth. The forward guidance was slightly less dovish with the reference "or lower" removed. Honestly, all of us understand that, at the currently exceptionally low (some are negative) interest rates, further rate cuts would offer little help to the economy. Notwithstanding expectations that the ECB would begin preparing the market over QE tapering, the central bank maintained the easing bias, reiterating the commitment to accelerate its monthly asset purchases if necessary. The single currency remains under pressure after dropping to a one-week low against the US dollar.
On domestic developments, the ECB acknowledged that the intermeeting data have confirmed "a stronger momentum in the euro area economy, which is projected to expand at a somewhat faster pace than previously expected". Policymakers noted that "the risks to the growth outlook are now broadly balanced" and dropped the previous reference that risks were tilted to the downside. On inflation, the central bank was aware of the situation that stronger economic expansion has not yet translated into stronger inflation dynamics. The flash estimate of the HICP inflation in May decelerated to +1.4%, from +1.9% in April and 1.5% in March. ECB attributed the volatility to the movement in "energy prices and temporary increases in services prices over the Easter period". It also pointed out that "measures of underlying inflation continue to remain subdued". Therefore, "a very substantial degree of monetary accommodation is still needed for underlying inflation pressures to build up and support headline inflation in the medium term". At the press conference, President Draghi noted that modest wage growth is a key reason to the subdued inflation rate. Despite the improvement in the employment market, Draghi indicated that many of the jobs created recently are of relatively poor quality (temporary or part-time job). He added that "we need to be patient... and persistent".
On the updated economic projections, the staff forecast that GDP would expand +1.9% this year, up +0.1 percentage point +1.8% projected in March, before easing to +1.8% and then to +1.7% in 2018 and 2019, respectively. Note that growth forecasts for 2018 and 2019 were also revised higher +0.1 percentage point from previously. On inflation, the staff revised lower the forecasts to +1.5% for 2017, +1.3% for 2018 and +1.6% for 2019. The corresponding estimates in March were +1.7%, +1.6% and +1.7%.
The closely-watched interest rate and QE outlook were not changed materially. As expected, the central bank kept the main refi rate, the marginal lending rate and the deposit rate unchanged at 0%, 0.25% and -0.4% respectively. It suggested these policy rates would "remain at their present levels for an extended period of time, and well past the horizon of our net asset purchases". The reference "or lower" was removed in this meeting. The central bank also affirmed that the QE program would be mainained at the monthly pace of 60B euro. It would continue "until the end of December 2017, or beyond, if necessary, and in any case until the Governing Council sees a sustained adjustment in the path of inflation consistent with its inflation aim". The disappointment here is that policymakers have mentioned nothing about potential tapering.
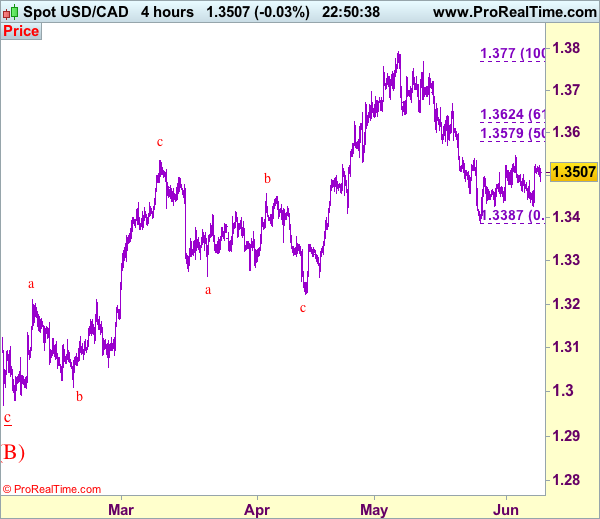
Trade Idea: USD/CAD – Hold short entered at 1.3500
USD/CAD - 1.3508
Recent wave: Only wave v of c has ended at 0.9407 and wave C of major A-B-C correction is underway for headway to 1.4700
Trend: Near term up
Original strategy :
Sold at 1.3500, Target: 1.3330, Stop: 1.3560
Position: - Short at 1.3500
Target: - 1.3330
Stop: - 1.3560
New strategy :
Hold short entered at 1.3500, Target: 1.3330, Stop: 1.3560
Position: - Short at 1.3500
Target: - 1.3330
Stop:- 1.3560
Although the greenback rebounded after finding support at 1.3426 and further consolidation would be seen, reckon resistance at 1.3547 would hold and bring retreat later, below said support at 1.3426 would signal the rebound from 1.3387 has ended and bring retest of this level, break there would extend the fall from 1.3794 top for further weakness to 1.3350, then towards 1.3300, however, loss of near term downward momentum should prevent sharp fall below 1.3250-60.
In view of this, we are holding on to our short position entered at 1.3500. Above said resistance at 1.3547 would abort and prolong consolidation, risk rebound to 1.3571-79 (previous support and 50% Fibonacci retracement of 1.3770-1.3387), however, reckon upside would be limited to 1.3620-25 (61.8% Fibonacci retracement) and bring another decline later.
To recap, wave B from 1.3066 is unfolding as an a-b-c and is sub-divided as a: 1.2192, b: 1.2716 and wave c is a 5-waver with i: 1.1983, ii: 1.2506, extended wave iii with minor iii at 1.0206, wave iv ended at 1.0781 and wave v as well as wave iii has ended at 0.9931, hence the subsequent choppy trading is the wave iv which is unfolding as (a)-(b)-(c) with (a) leg of iv ended at 1.0854, followed by (b) leg at 1.0108 and (c) leg as well as the wave iv ended at 1.0674. The wave v is sub-divided by minor wave (i): 0.9980, (ii): 1.0374, (iii): 0.9446, (iv): 0.9913 and (v) as well as v has possibly ended at 0.9407, therefore, consolidation with upside bias is seen for major correction, indicated target at 1.3700 and 1.4000 had been met and further gain to 1.4700 would be seen later.
Trade Idea Update: USD/CHF – Sell at 0.9720
USD/CHF - 0.9675
Original strategy :
Sell at 0.9720, Target: 0.9620, Stop: 0.9755
Position : -
Target : -
Stop : -
New strategy :
Sell at 0.9720, Target: 0.9620, Stop: 0.9755
Position : -
Target : -
Stop : -
Dollar’s rebound after marginal fall to 0.9613 suggests consolidation above this level would be seen and corrective bounce to 0.9700 is likely, however, reckon upside would be limited to resistance at 0.9720 and bring another decline later to 0.9600-05 (50% projection of 1.0100-0.9692 measuring from 0.9808) but oversold condition should limit downside to 0.9570 and price should stay above support at 0.9550, risk from there has increased for a rebound to take place later.
In view of this, we are looking to sell dollar on recovery as resistance at 0.9720 should limit upside. Above 0.9740 would abort and signal a temporary low is formed instead, bring a stronger rebound to 0.9761 resistance but price should falter below resistance at 0.9808.
EUR/USD Off the Recent Highs as Draghi Stays Soft
- European equities moved higher in the morning session, but gave back the gains in the afternoon session, both before and after Draghi's press conference. US equities open little changed awaiting former FBI's Comey testimony.
- The ECB kept its policy unchanged, but removed its easing bias on rates because the ECB no longer takes deflation risk into account. New staff forecasts showed upward revisions to GDP and downward revision for CPI. Risks to the eco outlook are now balanced and no longer tilted to the downside.
- Q1 EMU GDP growth was upwardly revised from 0.5% Q/Q to 0.6% Q/Q, the fastest pace since 2015. Details showed that investments contributed significantly, 1.3% Q/Q, following an upwardly revised 3.4% Q/Q in Q4 2016. Consumption rose by 0.3% Q/Q and government expenditure by 0.4% Q/Q. Net exports declined by 0.1% Q/Q.
- German industrial production rose more than predicted in April (0.8% M/M from upwardly revised -0.1% M/M in March), with a fourth consecutive increase in manufacturing adding to signs of underlying strength in Europe's largest economy.
- The US labor market remains a bright spot in the economy as fewer Americans filed for unemployment benefits last week, with hiring managers decrying a scarcity of available workers, Labour Department data showed. Weekly jobless claims declined from 255k to 245k (vs 240k expected).
- Italy's biggest banks may help Rome bail out Popolare di Vicenza and Veneto Banca to avoid being hit by costly depositor guarantees if European regulators shut them down, sources close to the matter said.
- Italy moved away from a possible early vote this year after a multi-party agreement on a new election law failed to hold up in parliament. Senior lawmakers from the ruling centre-left PD blamed the opposition Five Star Movement's lawmakers for voting in favour of an amendment to the bill that had not been previously agreed upon.
Rates
ECB stresses subdued inflation; no hurry to normalize
Global core bonds parted ways today. The US Note future trades near opening levels while the German Bund outperformed as the ECB cut its inflation forecast and doesn't seem to be in a hurry to normalize policy despite tiny steps on the forward guidance. Good EMU and US eco data had no impact on trading. At the time of writing, the German yield curve bull flattens with yields 1.1 bp (2-yr) to 4 bps (30-yr) lower. Changes on the US yield curve vary between -0.1 bp (30-yr) and + 0.9 bps bps (10-yr). On intra-EMU bond markets, 10-yr yield spread changes versus Germany narrowed up to 3 bps with Spain, Portugal (-9 bps) and Italy (-12 bps) outperforming. Italian BTP's performed strong as Italian early election plans took a snag (see headlines).
The ECB kept its monetary policy unchanged, but altered its forward guidance by removing its easing bias regarding policy rates. The Governing Council now expects its key policy rates to remain at present levels for an extended period of time. Previously, the guidance stated "at present OR LOWER levels". The omission reflects the fact that the ECB no longer fears deflation risk. Asset purchases on the other hand are expected to run at least until December 2017 or beyond that date if necessary (in case things turn less favourable). The central bank didn't discuss policy normalization/tapering and Draghi managed to keep expectations about such potential action in September very low key.
The ECB's main argument to hold a very easy monetary policy remains subdued underlying inflation pressure. The new June staff forecasts also downgraded inflation projections in 2017 (from 1.7% to 1.5%), 2018 (1.6% to 1.3%) and 2019 (1.7% to 1.6%) even if Draghi admitted that this was almost entirely due to lower oil prices. Somewhat confusing, the central bank governor also said that the ECB is increasingly confident that EMU inflation will reach its 2% target in a durable way. The central bank is more optimistic on economic growth which continues to gain momentum. New GDP forecast increased for 2017, 2018 and 2019 by 0.1% percentage point to 1.8%, 1.7% and 1.6% respectively. More importantly, the ECB now thinks that risks to its economic scenario are balanced and no longer tilted to the downside.
The Irish Treasury (NTMA) successfully tapped the on the run 10-yr IGB (€0.7B 1% May2026) and 30-yr IGB (2% Feb2045) for a combined €1B, the maximum amount of offer. The auction bid cover was a strong 2.12. With the completion of today's auction, the NTMA has issued €8.75B bonds, compared to its stated target range of €9-13B in the bond markets this year.
Currencies
EUR/USD off the recent highs as Draghi stays soft
The ECB's policy statement was the first in a series of key market events. The ECB made only an incremental step to policy normalisation. Markets were apparently positioned for a slightly bigger step. EUR/USD lost modest further ground during the ECB's press conference and trades currently at 1.1220. USD/JPY maintains most of this morning's technical rebound. The pair is trading in the 110 area going into the testimony of former FBI boss Comey before the Senate.
Overnight, Asian equities traded with modest gains. Good Chinese trade data gave investors some comfort even as the focus was on the ECB and on Comey's testimony. USD/JPY tested the 110 barrier early in Asia, but returned to the mid 109.50 area as the equity momentum eased. EUR/USD also traded little changed in the 1.1250 area.
European stocks opened with modest gains. Initially, the USD showed no clear trend, but it gradually found a better bid in technical trade. EMU Q1 growth was revised higher to 0.6% Q/Q and 1.9% Y/Y (from 0.5% and 1.7%). However, the report didn't help the euro. USD strength prevailed. USD/JPY rebounded to the 110 area. EUR/USD dropped to the 1.1230/40 area.
The ECB as expected left its policy rates and the pace of asset purchases unchanged. The ECB raised its growth outlook and changed the balance of risks to growth to balanced. Draghi omitted guidance that interest rates might be cut further. At the same time, the ECB also lowered the inflation forecast for the policy horizon. In the end, the ECB didn't give any clear guidance on an imminent policy tightening. The changes to the assessment were limited. European yields declined a few basis points during the ECB's press conference and EUR/USD dropped temporary to the 1.12 area. Markets apparently expected the ECB to have come a bit closer to a next step in the normalisation process. The focus on markets now turns to the Comey testimony before a US sentiment committee. For now, markets apparently don't expect any lasting harm for team Trump. The dollar is holding near the intraday highs against the euro (EUR/USD currently at 1.1220) and yen (USD/JPY 110.05/10).
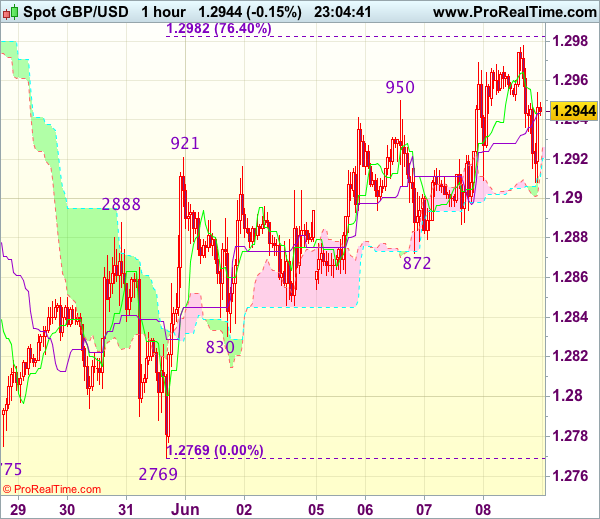
Sterling going nowhere, awaiting election result
Sterling traders had quite a boring trading session as markets awaited the outcome of the UK Parliamentary election. Especially EUR/GBP trading developed in an extremely tight range in the 0.8665/0.8700 area. Remarkably, EUR/GBP was hardly affected by the EUR/USD decline during the ECB press conference. On the other hand, cable to a large extent followed the EUR/USD decline even as part of this move was ECB-driven. In the end, today's intraday moves will probably be insignificant once the election result is available. EUR/GBP trades currently in the 0.8680 area. Cable is changing hands in the 1.2920 area.
Trade Idea Update: GBP/USD – Stand aside
GBP/USD - 1.2920
New strategy :
Stand aside
Position : -
Target : -
Stop : -
Cable has finally retreated after intra-day brief rise to 1.2978, suggesting consolidation below this level would be seen and weakness to 1.2885-90 cannot be ruled out, however, break of indicated support at 1.2872 is needed to signal top has been formed, bring further weakness to 1.1245-50 and possibly test of key support 1.2830 which is likely to hold on first testing.
On the upside, expect recovery to be limited to 1.2945-50 and said resistance at 1.2978 should continue to hold, bring another retreat. Only break there would extend gain to 1.3000 but still reckon upside would be limited to 1.3015 resistance and recent high at 1.3048 should remain intact.