
Sample Category Title
EUR/CHF Daily Outlook
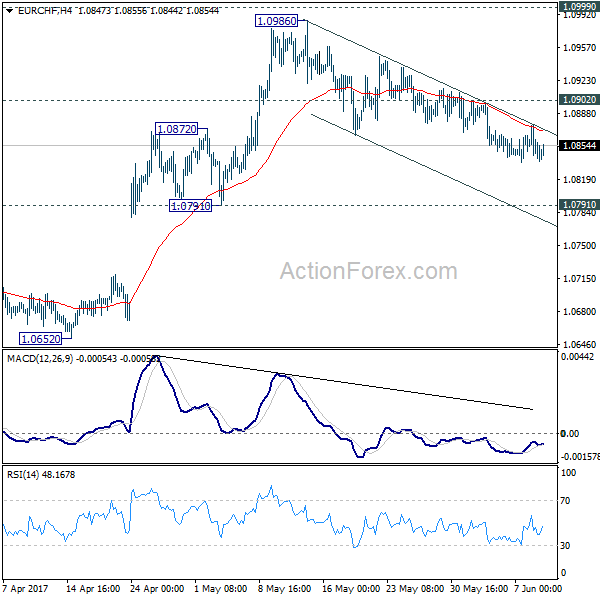
Daily Pivots: (S1) 1.0835; (P) 1.0855; (R1) 1.0866; More...
The corrective fall from 1.0986 short term top is still in progress. Outlook in EUR/CHF is unchanged. Downside is expected to be contained by 1.0791/0872 support zone, probably around 55 day EMA (now at 1.0830 and bring rebound. Above 1.0902 minor resistance will turn bias back to the upside for 1.0986/0999.
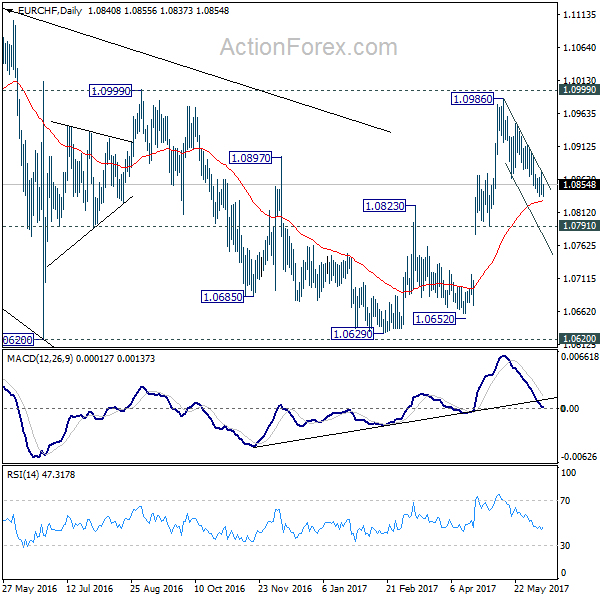
In the bigger picture, the price actions from 1.1198 are seen as a corrective move. Such correction could have completed after defending 38.2% retracement of 0.9771 to 1.1198 at 1.0653. Decisive break of 1.0999 resistance will target a test on 1.1198 high. For now, this will be the preferred case as long as 1.0791 support holds.
UK General Elections Spells More Uncertainty
The UK's general elections result is likely to see more uncertaintyin the near future for the British pound. Although votes are still being counted, the prospects of a hung parliament are starting to become a reality, which could influence the Brexit negotiations that start in just 10-days.
Theresa May's Conservative party is seen winning 315 - 325 seats, according to projections from Sky News. The idea of calling for a snap election has now also brought Ms. May's leadership under the scanner. In a speech, Ms. May called for stability but refused to comment any further.
Elsewhere, the Euro closed bearish after yesterday's ECB meeting saw no major changes from the central bank. The market reaction was mostly muted, largely thanks to the leaks that emerged a day before the ECB meeting.
The developments sent the USDollar index higher as the buck has posted two consecutive days of gains after slipping to a 7-month low.
EURUSD intraday analysis
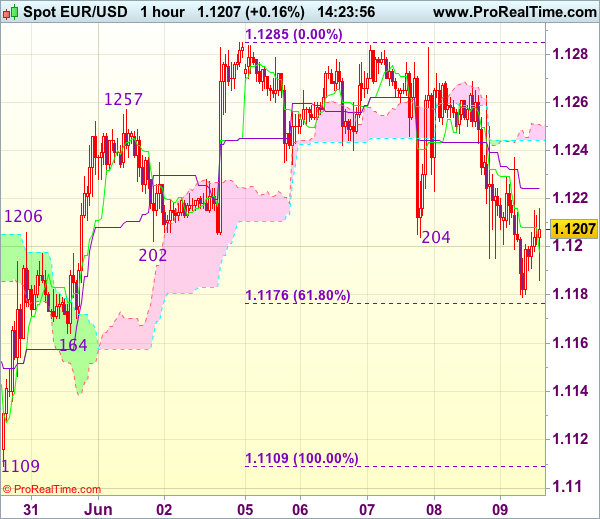
EURUSD (1.1202): EURUSD slipped to 1.1200 support level yesterday with price action currently seeing some consolidation at this support level. The bias, however, remains in favor to the upside with the bull flag pattern still in play. Only a decline to 1.1100 and below will flip the bias. On the 4-hour chart, price action shows an ascending wedge pattern from which price broke out yesterday. We currently notice a retracement and the upside could be limited to 1.1245. Failure to breakout above 1.1245 will signal a possible reversal with 1.1100 in focus.
GBPUSD intraday analysis
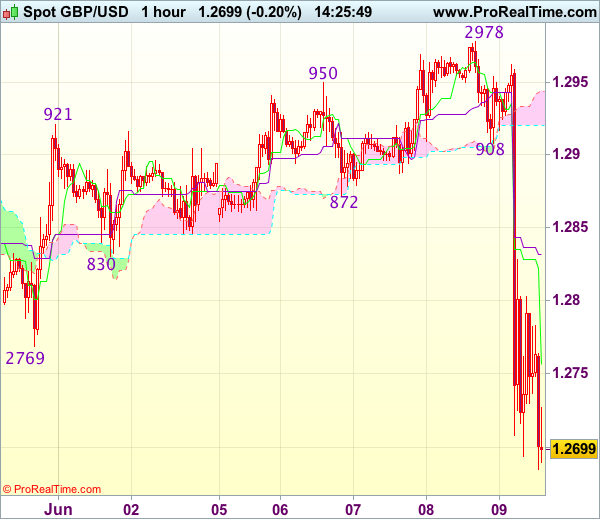
GBPUSD (1.2755): The British pound broke past the 1.2800 support level earlier today, and this confirms the downside in prices. The head and shoulders pattern from the daily chart is now in play, and we can expect to see a decline to the projected target of 1.2600. There is possible scope for further downside to come, with the next main support seen at 1.2400. This is a key support level that is pending a retest, so the likelihood of the downside in the GBPUSD is high.
USDJPY intraday analysis
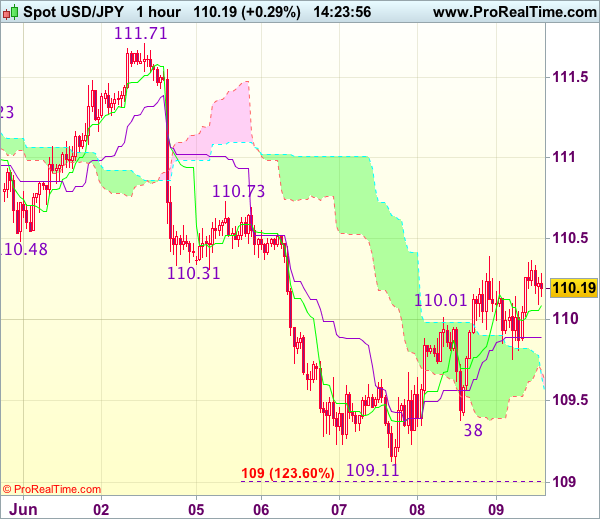
USDJPY (110.24): USDJPY has managed to lift off comfortably from the support level formed near 109.50 - 109.25 that was mentioned earlier this week. Price action is expected to continue to the upside with 110.79 now the next main target. A daily close above this level will see price reversing from the opening price of 110.435 from 6th June. A bullish continuation here will signal the upside with USDJPY potentially eyeing for 112.50 if the breakout above 110.79 can be sustained. To the downside, the support zone of 109.50 - 109.25 will remain key and a break down below this level will see price slip back to 108.30.
Currencies: Sterling Hammered As UK Election Results In A Hung Parliament
Sunrise Market Commentary
- Rates: Event risk left no traces on Bunds/Treasuries
Markets can digest the ECB meeting and the outcome of the UK elections today. The passive initial reactions suggest that focus will turn to next week's Fed meeting though. Ahead of the weekend and with this week's three event risks out of the way, investors might take some chips off the table and close some long positions in Bunds/US Treasuries. - Currencies: Sterling hammered as UK election results in a hung Parliament
Overnight, sterling fell off a cliff as UK PM May failed to secure a parliamentary majority. EUR/GBP is nearing the 2017 top. In EMU and in the US, the calendar is thin. The dollar bottomed out yesterday, but we don't see a trigger for sustained further gains right now. Next week, the focus for USD trading will shift to the Fed meeting
The Sunrise Headlines
- US equities ended close to unchanged and weren't affected by Comey's testimony. Overnight, Asian stock markets are mixed. The UK's election disaster doesn't impact global market sentiment.
- Britain's general election has resulted in a hung parliament. The Conservatives will be the largest party in the Commons followed by the Labour party who are the biggest winners in another shock night for British politics.
- Former FBI Director Comey told senators that he felt President Trump had directed him to drop an investigation into a former adviser, and that after his firing he leaked accounts of his conversations with the president in hopes of sparking the appointment of a special counsel.
- China's PPI eased for the third straight month in May on tumbling prices of raw materials, signalling a broader cooling in economic activity as profits are squeezed by slackening domestic demand and rising financing costs.
- US House Republicans approved a sweeping bill ripping up major aspects of the Dodd-Frank Act. The legislation has little chance of passing the Senate in its current form as this would require support from Democrats.
- Banco Popular burnt through €3.6bn of emergency central bank funding in the first two days of this week as the Spanish lender suffered the eurozone's first large scale bank run, according to two people involved in the situation.
- Today's eco calendar is thin with only UK industrial production. ECB Nowotny and Rimsevics are scheduled to speak
Currencies: Sterling Hammered As UK Election Results In A Hung Parliament
Dollar and euro little changed on UK election result
Yesterday, the focus for global (currency) trading was on the ECB policy decision and on the testimony of former FBI chief Comey. The ECB made only a small incremental step to policy normalisation. Markets were positioned for a slightly bigger step. The euro lost modest ground and dropped temporary to the 1.12 area. The hearing of Comey had no main negative impact on the dollar. EUR/USD closed the session at 1.1214. USD/JPY made a comeback, closing the day at 110.02.
Overnight, Asian equities are trading mixed. The UK election result is dominating the headlines, but understandably it is no big issue for Asian trading. The China May CPI rose in line with expectations. USD/JPY is little changed at 110.15. EUR/USD lost a few ticks as cable sold off early in Asia, but changes are also limited. The pair trades again in the 1.12 area.
The eco calendar in Europe and the US is uneventful. The focus is on the UK election outcome that raises a lot uncertainties on the Brexit negotiations. However, we see no major negative consequences for Europe or the euro. If anything, the tactical position of Europe in the negotiations is probably strengthened. So, with the ECB meeting and the Comey testimony out of the way, we expect technical, order driven trading for EUR/USD and USD/JPY. Next week, the focus will turn to the Fed meeting, but we doubt it will already play a big role today.
Yesterday, the dollar showed tentative signs of bottoming out process. In a daya- day perspective, we are neutral on USD/JPY . EUR/USD might feel some slight downward pressure after yesterday's soft ECB. A further sharply decline of cable, if it would occur, might be temporary a marginal negative for EUR/USD, but we don't expect it to be lasting or significant. We still think that topside in EUR/USD is tough.
Technical picture
The USD/JPY rally ran into resistance in early May. A mini sell-off pushed the pair below the previous top (112.20), making the short-term picture negative. The post-payrolls USD sell-off below 110 deteriorated the picture further. The pair declined further in the 108.13/114.37 range. Over the previous days, the USD/JPY decline slowed. However, there is no convincing sign of a U-turn yet.
Earlier in May, EUR/USD failed to break below the 1.0821/1.0778 support (gap). Poor US data and US political upheaval propelled EUR/USD north of the 1.1023 range top. The pair initially reached a short-term correction top at 1.1268. There was a minor break after Friday's disappointing US payrolls, but no sustained follow-through gains occurred. The Trump top/correction top at 1.1300/1.1366 is next resistance. USD sentiment will have to be quite negative to clear this hurdle short-term. A return below 1.1023 would indicate that the upside momentum has eased.
EUR/USD topside test rejected, but correction remains very modest
EUR/GBP
Sterling falls off a cliff
Sterling traders had quite a boring trading session yesterday as markets awaited the outcome of the UK Parliamentary election. Especially EUR/GBP trading initially developed in a tight range below 0.87. Remarkably, EUR/GBP was hardly affected by the EUR/USD decline during the ECB press conference. On the other hand, cable to a large extent followed the EUR/USD decline even as this move was mainly ECB-driven. At the end of the day, sterling was slightly better bid . EUR/GBP closed the session at 0.8657. Cable finished the day at 1.2956.
Today's UK production and trade balance data will almost surely be ignored. The election outcome (hung Parliament) hammered sterling. Cable trades in the 1.27 area. EUR/GBP tries to sustain north of 0.88 and is nearing the 2017 top. A hung Parliament is probably the worst scenario for the UK going into the Brexit negotiations. It is highly uncertain how the negotiations will evolve. This high degree of uncertainty makes a BoE rate hike highly unlikely even as inflation might rise further due to the selloff of sterling. This is a negative context for sterling. At this stage, it is not sure whether the election outcome raises or reduces the probably of a hard Brexit. If, at some point, chances on a softer Brexit would rise, fortunes might improve for sterling. However, in a first reaction, we can't but join the sterling negative sentiment.
From a technical point of view, EUR/GBP broke above 0.8774 resistance. Next resistance comes in at 0.8854 (2017 top). A break beyond would open the way to the 0.90 area. A return below the 0.8655 correction low would be an indication that the pressure on sterling is easing.
EUR/GBP: nearing the 2017 top as sterling sells of after UK elections
EUR/JPY Candlesticks and Ichimoku Analysis
Weekly
• Last Candlesticks pattern: Hammer
• Time of formation: 19 Sep 2016
• Trend bias: Down
Daily
• Last Candlesticks pattern: Doji
• Time of formation: 28 Mar 2017
• Trend bias: Near term up
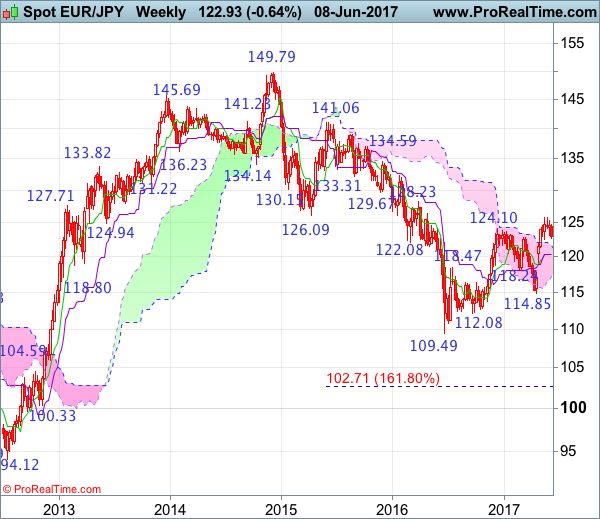
EUR/JPY – 124.81
The single currency has remained confined within near term established range and further sideways trading is in store, although initial weakness to 122.56-63 support cannot be ruled out, reckon downside would be limited to 122.00 and 121.60-65 (38.2% Fibonacci retracement of 114.85-125.82) should attract renewed buying interest, bring another rise later, above 124.70-75 would bring rebound to 125.31, however, only break of previous chart resistance at 125.82 would confirm recent upmove has resumed and extend subsequent headway to 126.50-60, then 127.00-10 but overbought condition should limit upside and price should falter well below 128.00-10.
On the downside, whilst initial pullback to 123.00 and then 122.56-63 cannot be ruled out, reckon downside would be limited to 121.60-65 (38.2% Fibonacci retracement of 114.85-125.82) and bring another upmove later to aforesaid upside targets. Below indicated previous support at 120.60 would abort and signal a temporary top has been formed, bring retracement of recent entire rise to 120.30-35 (50% Fibonacci retracement) and then 120.00 but reckon downside would be limited to 119.40-50 and price should stay above indicated support at 118.92, bring rebound later.
Recommendation: Buy at 121.60 for 124.60 with stop below 120.60.
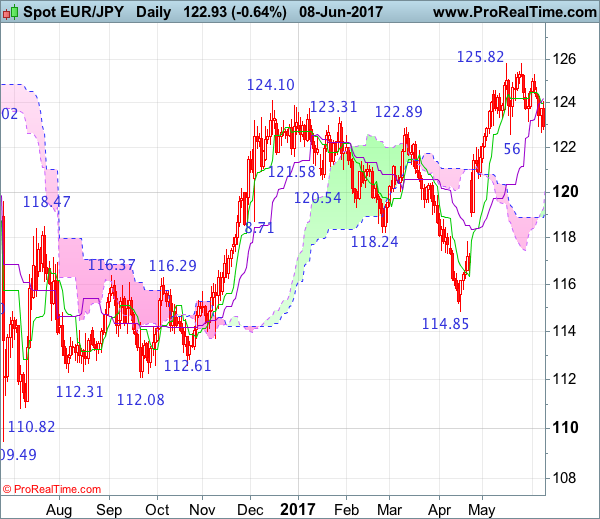
On the weekly chart, as the single currency has continued meeting resistance below recent high of 125.82 and has retreated, retaining our view that further consolidation below this level would be seen, however, reckon downside would be limited to 122.00 and 121.50-60 should hold, bring another rise later, above 125.82 would extend the erratic rise from 109.49 low to 126.45-50, then towards 127.40-50 but reckon another previous resistance at 128.23 would limit upside and price should falter below 129.60-65 (50% Fibonacci retracement of 149.79-109.49) and price should falter below psychological resistance at 130.00, bring retreat later this month.
On the downside, although initial pullback to 123.00 and possibly 122.56-63 cannot be ruled out, reckon downside would be limited to 122.40-50 and renewed buying interest should emerge around 121.60-65 and bring another rise later. Only below support at 120.60 would defer and risk weakness to the Kijun-Sen (now at 120.34) and then 120.00 which is likely to hold on first testing. Looking ahead, euro needs to penetrate indicated support at118.92 to shift risk to the downside for further fall to 118.00, however, downside should be limited to previous resistance at 117.82 and bring rebound later. A weekly close below 117.82 would suggest first leg of rebound from 114.85 has ended, bring weakness to 117.00 but price should stay above 116.20-25, bring another rebound later.
USD/CAD Candlesticks and Ichimoku Analysis
Weekly
• Last Candlesticks pattern: Shooting doji
• Time of formation: 02 May 2016
• Trend bias: Up
Daily
• Last Candlesticks pattern: Bearish engulfing
• Time of formation: 5 May 2017
• Trend bias: Up
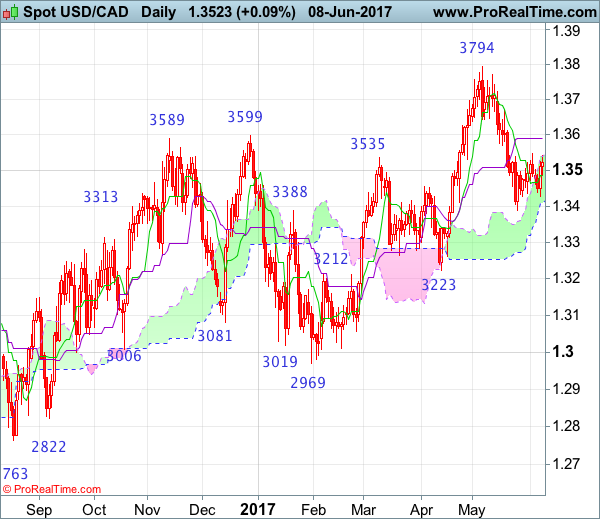
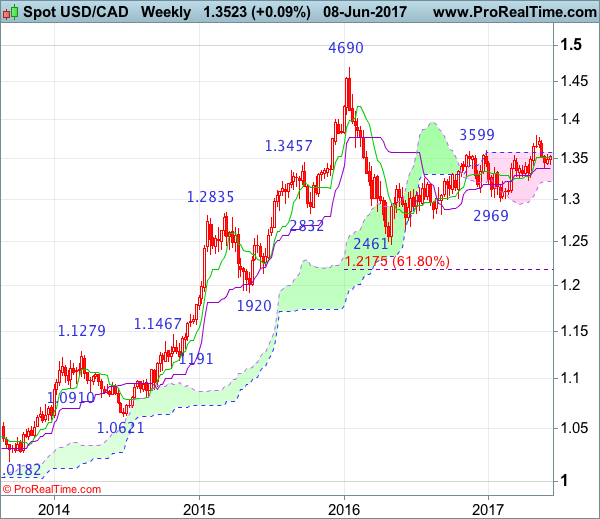
USD/CAD – 1.3512
Although the greenback has rebounded again after finding support at 1.3426 and further consolidation above support at 1.3387 would be seen, reckon upside would be limited to 1.3545-50 and price should falter below the Kijun-Sen (now at 1.3591), bring another decline later, below 1.3426 would bring retest of said support at 1.3387 but break there is needed to signal the fall from 13794 top has resumed and extend weakness to 1.3300-10, however, break of support at 1.3262 is needed to retain bearishness and bring test of key level at 1.3223. Looking ahead, only a daily close below this support would signal recent entire rise from 1.2461 has ended instead, bring further fall to 1.3150-60 and possibly towards 1.3100 but support at 1.3056 should remain intact and price should stay above 1.3009.
On the upside, whilst initial recovery to 1.3530-40 cannot be ruled out, reckon the Kijun-Sen (now at 1.3591) would cap upside and bring another decline. Only a daily close above the Kijun-Sen would defer and suggest first leg of decline from 1.3794 has ended instead, bring a stronger rebound to 1.3630 and then 1.3670 but upside should be limited to 1.3700-10 and price should falter below said resistance at 1.3794, bring another decline later.
Recommendation: Hold short entered at 1.3540 for 1.3340 with stop above 1.3640.
On the weekly chart, as the greenback recovered after finding support right at the Kijun-Sen, suggesting further consolidation above support at 1.3387 would be seen, however, reckon upside would be limited to 1.3545-50 and the upper Kumo (now at 1.3576) should hold, bring another decline later, below said support at 1.3387 would signal the fall from 1.3794 top is still in progress for retracement of recent rise to 1.3345-50, then towards 13262 support but break of key level at 1.3223 is needed to add credence to this view, bring further fall to 1.3140-50, then 1.3080-85, however, downside should be limited to 1.3000-10 and previous chart support at 1.2969 should remain intact.
On the upside, expect recovery to be limited to 1.3547 resistance (last week’s high) and bring another decline. Above the upper Kumo (now at 1.3576) would bring a stronger rebound towards resistance at 1.3670 but still reckon upside would be limited to 1.3700 and bring another decline later. Only a break of 1.3794 resistance would revive bullishness and signal recent erratic upmove from 1.2461 (2016 low) has resumed and extend further gain to 1.3835-40 (61.8% Fibonacci retracement of 1.4690-1.2461) and then 1.3900 but psychological resistance at 1.4000 should remain intact.
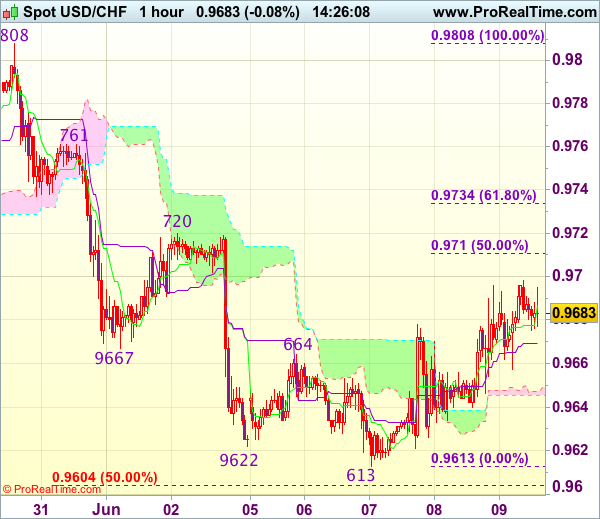
Trade Idea : USD/CHF – Sell at 0.9720
USD/CHF - 0.9693
Most recent candlesticks pattern : N/A
Trend : Near term down
Tenkan-Sen level : 0.9687
Kijun-Sen level : 0.9669
Ichimoku cloud top : 0.9647
Ichimoku cloud bottom : 0.9646
Original strategy :
Sell at 0.9720, Target: 0.9620, Stop: 0.9755
Position : -
Target : -
Stop : -
New strategy :
Sell at 0.9720, Target: 0.9620, Stop: 0.9755
Position : -
Target : -
Stop : -
Although dollar’s rebound from 0.9613 (this week’s low) suggests near term upside risk remains for gain towards resistance at 0.9720, as this move is viewed as retracement of recent decline, reckon upside would be limited too 0.9730-35 (61.8% Fibonacci retracement of 0.9808-0.9613) and bring retreat later, below 0.9645-50 would suggest an intra-day top is formed, bring weakness towards said support at 0.9613 but break there is needed to signal decline has resumed for fall to to 0.9600-05 (50% projection of 1.0100-0.9692 measuring from 0.9808) later.
In view of this, we are looking to sell dollar on recovery as resistance at 0.9720 should limit upside. Above 0.9740 would abort and signal a temporary low is formed instead, bring a stronger rebound to 0.9761 resistance but price should falter below resistance at 0.9808.
Trade Idea : GBP/USD – Sell at 1.2760
GBP/USD - 1.2700
Most recent candlesticks pattern : N/A
Trend : Near term down
Tenkan-Sen level : 1.2735
Kijun-Sen level : 1.2810
Ichimoku cloud top : 1.2944
Ichimoku cloud bottom : 1.2921
New strategy :
Sell at 1.2760, Target: 1.2630, Stop: 1.2795
Position : -
Target : -
Stop : -
Cable has tumbled on UK election result, the breach of indicated previous support at 1.2769, adding credence to our view that top has been formed at 1.3048 earlier and bearishness remains for the decline from there to bring retracement of early upmove to 1.2616 (previous resistance turned support), break there would extend weakness to 1.2575-80 but reckon near term oversold condition would limit downside to 1.2550, bring recovery later.
In view of this, would not chase this fall here and would be prudent to sell on recovery as 1.2750-60 should limit upside. Only above 1.2800-05 would defer and risk a stronger rebound to 1.2830-35 but price should falter below 1.2870-75 and bring another decline later.
Trade Idea : EUR/USD – Stand aside
EUR/USD - 1.1193
Most recent candlesticks pattern : N/A
Trend : Up
Tenkan-Sen level : 1.1198
Kijun-Sen level : 1.1224
Ichimoku cloud top : 1.1251
Ichimoku cloud bottom : 1.1244
New strategy :
Stand aside
Position : -
Target : -
Stop : -
Euro’s decline after faltering below indicated strong resistance at 1.1285 suggests top has possibly been formed there and further consolidation would be seen with downside bias for weakness to indicated support 1.1164, however, break there is needed to add credence to this view, bring further subsequent fall to 1.1145-50 and then towards 1.1120 but support at 1.1109 should hold from here.
In view of this, would not chase this fall here and would be prudent to stand aside in the meantime. Above 1.1235-40 would bring another bounce to 1.1270 but only break of said resistance at 1.1285 would revive bullishness and confirm recent upmove has resumed and extend further gain to previous chart resistance at 1.1300, break there would encourage for headway to 1.1340-45 and later towards chart point at 1.1366.
Trade Idea : USD/JPY – Hold short entered at 110.20
USD/JPY - 110.26
Most recent candlesticks pattern : N/A
Trend : Down
Tenkan-Sen level : 110.09
Kijun-Sen level : 109.89
Ichimoku cloud top : 109.69
Ichimoku cloud bottom : 109.65
Original strategy :
Sold at 110.20, Target: 109.20, Stop: 110.55
Position : - Short at 110.20
Target : - 109.20
Stop : - 110.55
New strategy :
Hold short entered at at 110.20, Target: 109.20, Stop: 110.55
Position : - Short at 110.20
Target : - 109.20
Stop : - 110.55
Although the greenback has rebounded after finding renewed buying interest at 109.38 yesterday, as this move from 109.11 is viewed as retracement of recent decline, reckon upside would be limited and 110.50 should hold, bring retreat later, below said support at 109.38 would signal an intra-day top is formed, bring another fall towards this week’s low at 109.11 which is likely to hold on first testing.
In view of this, we are holding on to our short position entered at 110.20. Above 110.50 would defer and suggest low is formed instead, bring a stronger rebound to 110.60 but break of resistance at 110.73 is needed to add credence to this view.
Britain Heads For A Hung Parliament As Tories Lost Majority
With 98% of the vote declared, PM Theresa May's Conservative Party would remain the biggest party with over 300 seats in the Parliament. However, Tories would highly likely fall short of majority. The disastrous scenario in our previous report materializes: A hung parliament is now inevitable. Yet, unlike the situation in 2010, Tories would find it very challenging to form a coalition government with other parties. The snap election not only has resulted a reduction in number of seats for Tories, but also has scrapped their majority status in the Parliament. This would only make the Brexit negotiation with the EU more difficult, even if Tories managed to form a coalition government.
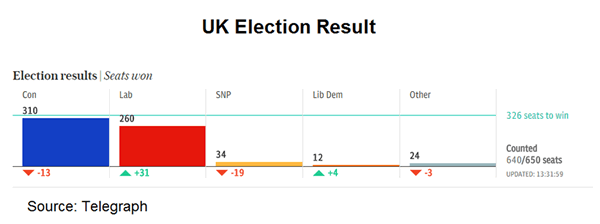
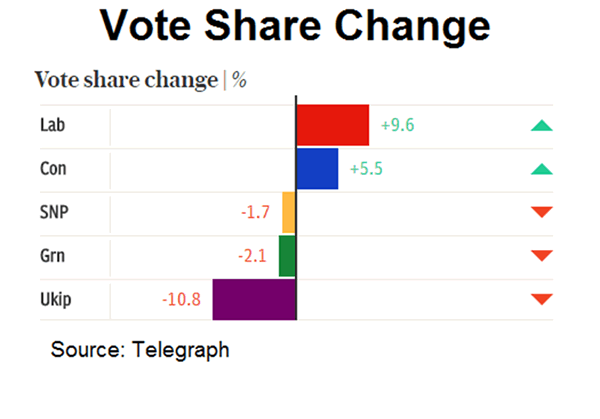
So far, Conservatives have got 310 seats, down -13 seats from previously, while Labors gained +31 seats to 260 The result for the Scottish National Party (SNP) was also shocking as the party only retain 34 of the 53 seats it held previously. Liberal Democrats gained +5 seats more to 12 but its ex-leader and UK's former Deputy Prime Minister Nick Clegg lost his seat to the Labour Party in Sheffield Hallam. The party's former leader Ming Campbell confirmed that it would make "no pact, no deal, no coalition" with either Labour or the Conservatives in case of a hung parliament. The SNP and DUP (10 seats) would likely be king-makers in a hung parliament.
It now remains uncertain which parties would come up with a coalition government. The increasing uncertainty does not bode well for sentiment in the near- to medium- term. Even if Tories eventually managed to form a minority government with other parties, there are louder voices demanding Theresa May to resign. On Brexit negations, domestic noise over the issue would inevitably be louder than before. Undoubtedly, the election result has deteriorated UK's bargaining power in Brexit negotiation. Meanwhile, there have been rising speculations over another Brexit referendum. Additionally, the rise of Labour's might be perceived as negative by some investors, as Jeremy Corbyn, the party leader, has proposed to re-nationalize industries, increase business and personal taxation and raise government spending. The overhang would remain over the coming few months, at least.