

Sample Category Title
The Donald Trump And Angela Merkel Meeting
Market movers today
In the US, we are due to get preliminary University of Michigan consumer confidence data (one of the soft economic indicators) for March today.
The Donald Trump and Angela Merkel meeting, initially scheduled for this Monday but postponed due to the blizzard in the north eastern part of the US, is set to take place at the White House today. This will be the first meeting between the German Chancellor and the new American President. Likely topics on the agenda are the future of the transatlantic alliance but also funding for NATO and relations with Russia.
In the euro area, S&P is scheduled to update its rating and outlook on Portugal, Finland, Austria and Cypress, while Moody's will be reviewing Estonia.
In Denmark, the Association of Danish Mortgage Banks is due to release its housing market statistics for Q4 16.
Selected market news
Different camps of the Governing Council within the ECB seem to be forming, both when it comes to how the 'normalisation' of monetary policy should start and regarding when it is time to embark on a clearer adjustment to the forward guidance. Overnight Ewald Nowotny (Hawk) was quoted in a Handelsblaat interview as saying that the 'deposit rate could rise before [the] main rate', while Peter Praet said during a speech in Brussels that 'inflation dynamics haven't yet become self-sustained'. It will be interesting to see how this 'gorge' continues to develop.
Donald Trump's first budget outline was presented yesterday. As expected, it had heavy emphasis on infrastructure spending without further detail and an increased defence budget, which he plans to fund with deep cuts to diplomatic and foreign aid programmes. Also, the Environmental Protection Agency is set to see its budget cut by 31%. The full 2018 budget is due to be released later this spring and it will include 'our specific mandatory and tax proposals, as well as a full fiscal path'.
Yesterday's Norges Bank meeting did not bring any surprises, as the sight deposit rate was left unchanged at 0.50% and the Board maintained the 'neutral bias' introduced in September. The rate path was revised 'postponing' the expectation of when the first rate hike will occur and stating 'the key policy rate will most likely remain at today's level in the period ahead'.
The Bank of England meeting did not surprise much either, as it made no policy changes and reiterated its neutral stance by repeating it could move 'in either direction'. However, the meeting was not completely uneventful, as Kristin Forbes (a known hawk) voted for a March hike and the statement disclosed that 'some members noted that it would take relatively little further upside news…for them to consider that a more immediate reduction in policy support might be warranted'.
The overnight session was very quiet, with the Asian equity indices seeing marginal gains and losses, no big FX moves and slightly higher yields of Japanese government bonds.
USDJPY Elliott Wave View: Ending Impulse
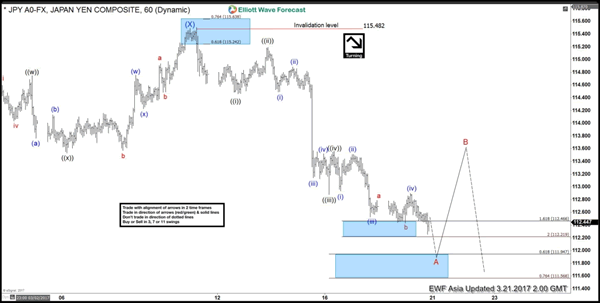
Short term Elliott Wave view in USDJPY suggests that rally to 115.48 on 3/10 ended Intermediate wave (X). Decline from there is unfolding as a zigzag Elliott wave structure in which the first leg wave A is subdivided in 5 impulsive waves. Down from 3/10 high, Minute wave ((i)) ended at 114.46, Minute wave ((ii)) ended at 115.195, Minute wave ((iii)) ended at 112.88 and Minute wave ((iv)) ended at 113.56. Cycle from 3/10 high is mature and Primary wave A has enough extension to be called complete, but more downside towards 111.56 – 111.95 area can’t be ruled out to complete Primary wave A. Afterwards, pair should bounce in Primary wave B in 3, 7, or 11 swing to correct cycle from 3/10 high before the decline resumes. A break above proposed Minutte wave (iv) at 112.9 may be an early indication that Primary wave A has ended.
USDJPY 1 Hour Chart
GBP/USD Bearish ABC Zigzag Within Wave-E Triangle
Currency pair GBP/USD
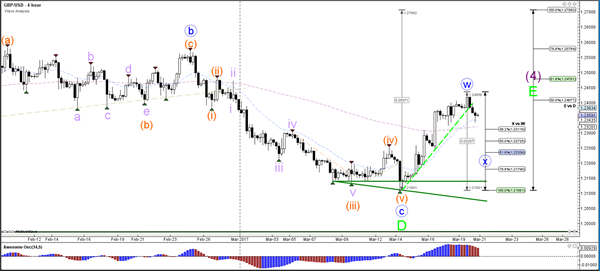
The GBP/USD turned at the 50% Fibonacci level of wave E (green) but a larger bullish correction via a WXY (blue) seems likely at this point. The Fibonacci levels of wave X (blue) could therefore be bouncing spots.
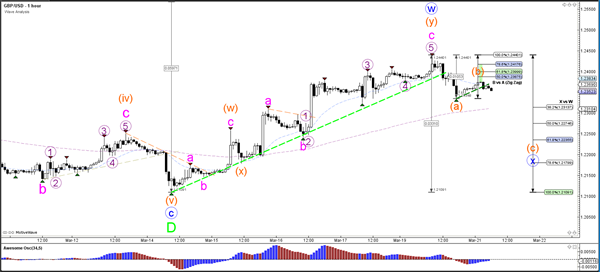
The GBP/USD seems to have completed a 5th wave (purple) and is now building a bearish correction via an ABC (orange) zigzag.
Currency pair EUR/USD
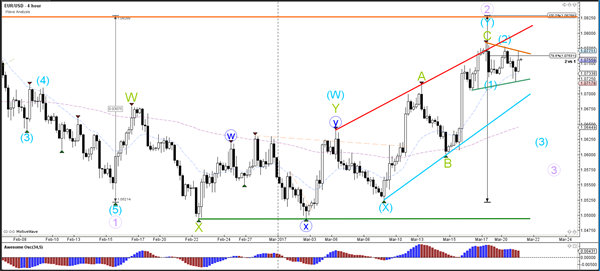
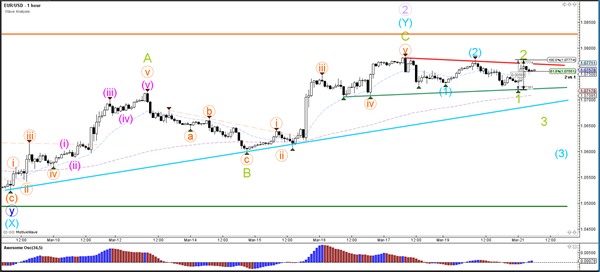
The EUR/USD is building a contracting triangle (green/orange lines) at the 78.6% Fibonacci resistance level of wave 2 (purple). A potential break above the 100% level invalidates the current wave 1-2 (purple) structure but a breakout below support (green/blue) could see a new downtrend emerge.
The EUR/USD could be building a second pullback with waves 1-2 (blue/green). A break above the 100% level invalidates the bearish reversal and could see price retest 1.08 and the resistance top (orange).
Currency pair USD/JPY
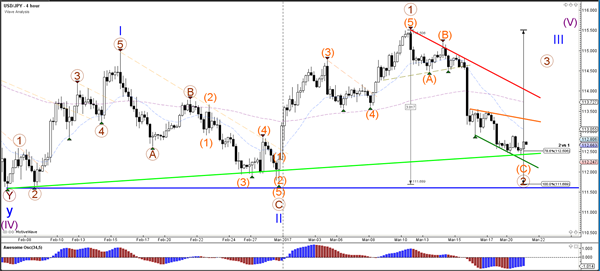
The USD/JPY is building a pullback and could bounce at the 78.6% Fibonacci retracement level of wave 2 (brown). A break below the 100% Fibonacci level invalidates wave 2 (blue/brown).
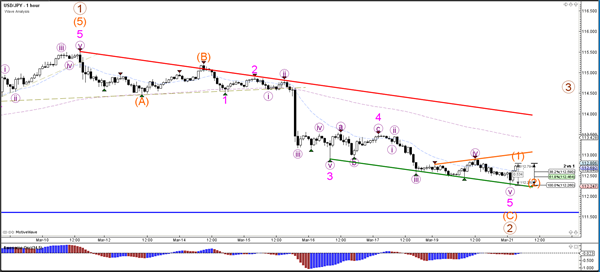
The USD/JPY might be starting its bullish turn via a wave 1-2 (orange) if price stays above the 100% level and manages to break above resistance (orange/red).
Daily Technical Outlook And Review
A note on lower timeframe confirming price action...
Waiting for lower timeframe confirmation is our main tool to confirm strength within higher timeframe zones, and has really been the key to our trading success. It takes a little time to understand the subtle nuances, however, as each trade is never the same, but once you master the rhythm so to speak, you will be saved from countless unnecessary losing trades. The following is a list of what we look for:
- A break/retest of supply or demand dependent on which way you're trading.
- A trendline break/retest.
- Buying/selling tails ... essentially we look for a cluster of very obvious spikes off of lower timeframe support and resistance levels within the higher timeframe zone.
- Candlestick patterns. We tend to only stick with pin bars and engulfing bars as these have proven to be the most effective.
EUR/USD
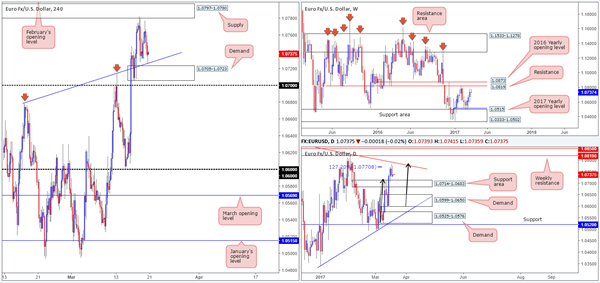
Shortly after the open, EUR bulls rose up and took charge, lifting the major to a high of 1.0777 going into the London open. This is where things began to turn sour for the bulls. The pair fell from here, broke Friday's low at 1.0727 and clipped the H4 trendline support extended from the high 1.0679. Although a buy from this angle is tempting, given that the approach to this line was in the form of a symmetrical H4 AB=CD bullish pattern, we'd still prefer to see price connect with the H4 demand sitting just below it at 1.0705-1.0723 before considering a position here.
Over on the weekly chart, the candles are seen hovering just ahead of a weekly resistance level pegged at 1.0819, shadowed closely by the 2016 yearly opening base line drawn from 1.0873. Looking down to the daily chart, nevertheless, we can see that the unit came into contact with a daily bearish AB=CD (black arrows) 127.2% Fib ext. at 1.0770 on Friday. As you can probably see though, there's not much room left for the bears to stretch their legs from here owing to the daily support area positioned just below at 1.0714-1.0683.
Our suggestions: In view of the current H4 demand area being seen around the top edge of the aforementioned daily support area, and room seen to advance north on the weekly chart, there's still a healthy chance of a bounce being seen from the H4 base.
However, as we mentioned in Monday's report, it is obviously down to the individual trader as to whether or not this zone requires additional price confirmation. For us personally, we believe it's best to wait for a reasonably sized H4 bullish rotation candle to take shape before a long trade is executed for the simple reason that we do not favor being stopped out on a fakeout down to the nearby 1.07 handle.
Data points to consider: FOMC member Dudley speaks at 10am GMT.
Levels to watch/live orders:
- Buys: 1.0705-1.0723 ([waiting for a reasonably sized H4 bull candle to form is advised before pulling the trigger] stop loss: ideally beyond the confirming candle).
- Sells: Flat (stop loss: N/A).
GBP/USD
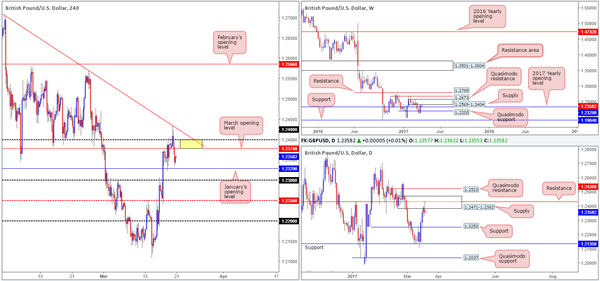
In recent sessions, H4 price briefly whipsawed through the 1.24 handle and tagged in offers around a nearby H4 trendline resistance stretched from a high of 1.2706. From here, cable dove lower and ended the day on its back foot; closing just ahead of January's opening base line drawn from 1.2329. Yesterday's bearish assault likely has something to do with the fact that both the weekly and daily charts show this market to be trading from supply (weekly supply: 1.2569-1.2404/daily supply: 1.2471-1.2382).
Should the H4 candles retest the 1.24/1.2378 neighborhood today (psychological handle/March opening level – yellow zone) before testing January's open level, our desk has noted that they would be interested in shorting from here.
Our suggestions: Assuming that the above comes to fruition, and we see rejection printed from the H4 sell zone, a short trade will be initiated, targeting 1.2329 followed closely by the 1.23 handle.
Data points to consider: UK inflation data at 9.30am. FOMC member Dudley speaks at 10am GMT.
Levels to watch/live orders:
- Buys: Flat (stop loss: N/A).
- Sells: 1.24/1.2378 (stop loss: ideally placed beyond the rejection wick).
AUD/USD
Trade update: stopped out at 0.7742 on the short taken from 0.7732).
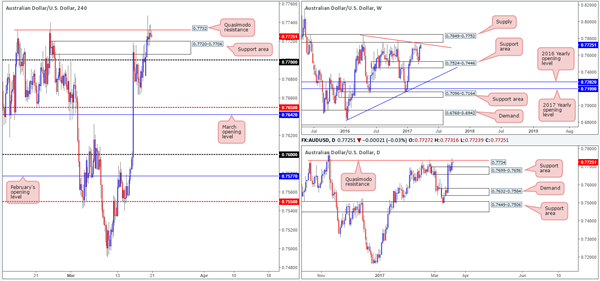
Beginning with a look at the weekly chart this morning, weekly action is currently seen testing a weekly trendline resistance taken from the high 0.7835, which is positioned nearby the underside of a weekly supply penciled in at 0.7849-0.7752. Turning our attention to the daily chart, the Aussie gravitated north from the daily support area at 0.7699-0.7656 yesterday and shook hands with a daily Quasimodo resistance level drawn in at 0.7734.
Jumping across to the H4 chart, we can see that upside is presently capped by a H4 Quasimodo resistance level pegged at 0.7732. However, with the close-at-hand H4 support area lurking at 0.7720-0.7706 (seen positioned directly above the current daily support area), the bears equally have little room to stretch their legs!
Our suggestions: While weekly, daily and H4 charts do indicate that bearish structure is in play, we cannot justify a short at this time. It would just be too risky given that there is not only a H4 support area sitting nearby, but just beneath this there's also a daily support area (see above). Therefore, opting to stand on the sidelines here may very well be the better path to take today.
Data points to consider: Australian monetary policy meeting minutes at 12.30am. FOMC member Dudley speaks at 10am GMT.
Levels to watch/live orders:
- Buys: Flat (stop loss: N/A).
- Sells: Flat (stop loss: N/A).
USD/JPY
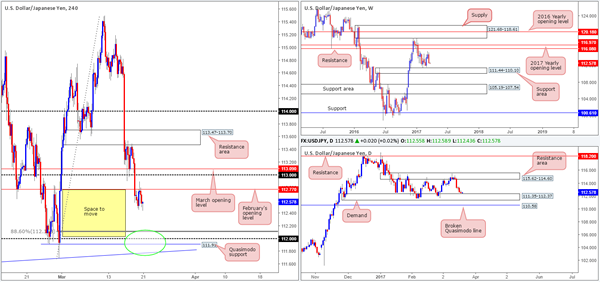
February's opening level at 112.77 managed to elbow its way into the spotlight as a resistance during the early hours of yesterday's London morning segment. Our reason for not choosing to take part in selling from this line was simply due to the daily demand zone lurking within touching distance at 111.35-112.37.
As can be seen from the daily chart this morning, daily price is in fact now trading close by the top edge of the above said daily demand. Be that as it may, we do not plan on buying from here. Instead we have our eye on the 112 handle (green circle). There are a number of technical aspects that support a buy from this angle:
The H4 88.6 retracement value seen at 112.11.
The H4 Quasimodo support at 111.91.
A H4 trendline support taken from the low 111.59.
All of the above is positioned within the current daily demand, which happens to be located around the top edge of a weekly support area at 111.44-110.10.
Our suggestions: Given the above points, a long from 112 is far more appealing to us. Nevertheless, seeing as how the H4 buy zone (111.75/112.11) is rather large, a reasonably sized H4 bullish candle is required to be seen before we pull the trigger. This will not only show buyer intent but it will also help in avoiding any aggressive fakeout seen through our pre-determined zone.
Data points to consider: FOMC member Dudley speaks at 10am GMT.
Levels to watch/live orders:
- Buys: 111.75/112.11 ([waiting for a reasonably sized H4 bull candle to form is advised before pulling the trigger] stop loss: ideally beyond the confirming candle).
- Sells: Flat (stop loss: N/A).
USD/CAD
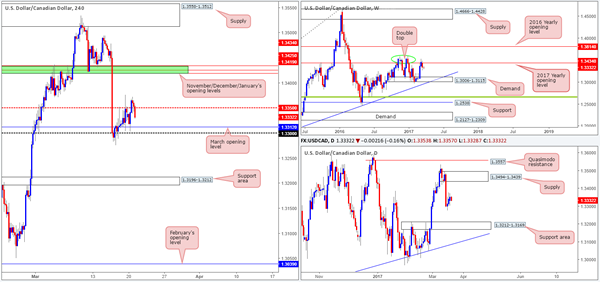
Working our way from the top this morning, we can see that weekly action sold off. Price whipsawed through the 2017 yearly opening level at 1.3434 and came so very close to tapping the weekly double-top formation seen around the 1.3588 region (green circle). The next downside area to have an eyeball from here is the weekly demand pegged at 1.3006-1.3115. The story on the daily chart, however, shows that price is loitering mid-range between a daily supply seen at 1.3494-1.3439 and a daily support area at 1.3212-1.3169.
Looking over to the H4 candles, price looks to be on course to cross swords with March's opening level at 1.3312, following a rather deep fakeout above the H4 mid-way resistance level at 1.3350. Would we consider a buy from 1.3312? Although this number is bolstered by a nearby psychological handle at 1.33, we would still probably not buy from here. Our reason for why simply comes down to there being no higher-timeframe convergence.
Our suggestions: With the above points in mind, we feel that even though a bounce MAY be seen from the 1.33 region today, it's just not worth the risk, in our opinion. As a result, we will be placing this pair on the back burner today and revisiting it going into tomorrow's open.
Data points to consider: FOMC member Dudley speaks at 10am. Canadian core retail sales at 12.30pm GMT.
Levels to watch/live orders:
- Buys: Flat (stop loss: N/A).
- Sells: Flat (stop loss: N/A).
USD/CHF
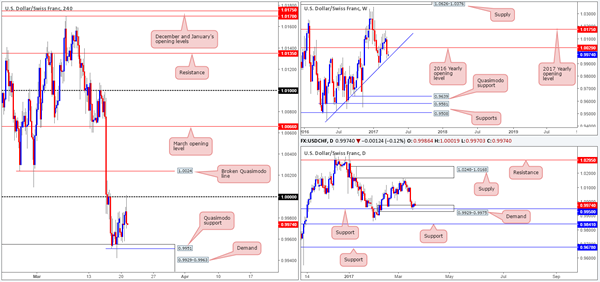
Recent action shows that the Swissy extended Friday's bounce from the H4 demand at 0.9929-0.9963 up to parity (1.0000), which, as you can see, is currently proving to be a stable line of resistance. Given the velocity of the rebound from 1.0000, could further selling be seen? While it's possible the market may continue to pump lower, we would advise caution here! Not only is there a daily demand base currently in play right now at 0.9929-0.9975 (houses the current H4 demand), there's also a weekly trendline support intersecting with this zone! Therefore, the bears certainly have their work cut out for them if they intend on pushing this market lower.
Our suggestions: Owing to the above, our team has absolutely no interest in selling today. Instead, we're actually looking at buying from the H4 Quasimodo support at 0.9951 that's lodged within the aforementioned H4 demand. Usually, we'd look to place stops below the apex of the Quasimodo formation, but given where it's positioned, we feel stops would be best placed beyond the H4 demand base at 0.9927.
Data points to consider: FOMC member Dudley speaks at 10am GMT
Levels to watch/live orders:
- Buys: 0.9951 (stop loss: 0.9927).
- Sells: Flat (stop loss: N/A).
DOW 30
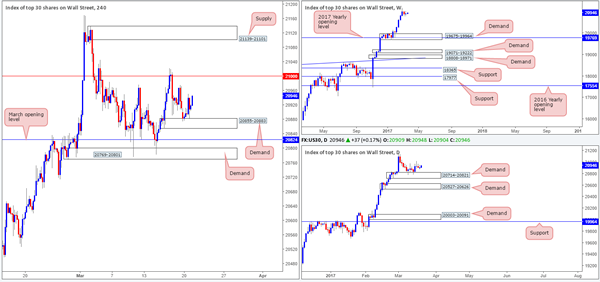
US equities bounced nicely from the H4 demand base fixed at 20855-20883 during the course of yesterday's sessions. Assuming that the bulls remain in control here, the next area of interest can be seen at the 21000 mark: a level that capped upside beautifully on Thursday. With the daily demand zone at 20714-20821 currently holding ground, and the weekly chart showing absolutely no weekly resistance ahead, we feel further buying is likely going to transpire today/this week.
Our suggestions: However, before our team can become buyers, we will need to see the H4 candles engulf the 21000 mark. In the event that this comes to fruition, and the H4 candles retest 21000 as support, we will look to buy the rejection candle off this number and target the H4 supply seen overhead at 21139-21101.
Data points to consider: FOMC member Dudley speaks at 10am GMT.
Levels to watch/live orders:
- Buys: Watch for price to engulf 21000 and then look to trade any retest seen thereafter (stop loss: dependent on the rejection candle, but ideally beyond the rejection candle's tail).
- Sells: Flat (stop loss: N/A).
GOLD
As can be seen from the H4 chart this morning, bullion is heavily selling off and has brought the unit to within touching distance of the H4 support area drawn from 1227.5-1223.9. While it is true that price bounced beautifully from this H4 zone on Thursday last week, it might be worth noting that the daily candles are currently housed within a daily resistance area at 1232.9-1224.5. Therefore, although history could repeat itself here, we would not feel comfortable buying from this barrier today.
Our suggestions: Should price engulf the current H4 support zone on the other hand, then we feel taking a short on any retest to the underside of this zone is attractive (assuming a reasonably sized H4 bear candle is seen following the retest), since the next area of support does not come into view until we connect with February's opening base line at 1211.5.

Levels to watch/live orders:
- Buys: Flat (stop loss: N/A).
- Sells: Watch for price to engulf the H4 support area at 1227.5-1223.9 and then look to trade any retest seen thereafter (stop loss: dependent on the rejection candle, but ideally beyond the rejection candle's wick).
Trade Idea : USD/CHF – Sell at 1.0020
USD/CHF - 0.9980
Most recent candlesticks pattern : N/A
Trend : Near term down
Tenkan-Sen level : 0.9985
Kijun-Sen level : 0.9980
Ichimoku cloud top : 0.9975
Ichimoku cloud bottom : 0.9969
Original strategy :
Sell at 1.0020, Target: 0.9920, Stop: 1.0055
Position : -
Target : -
Stop : -
New strategy :
Sell at 1.0020, Target: 0.9920, Stop: 1.0055
Position : -
Target : -
Stop : -
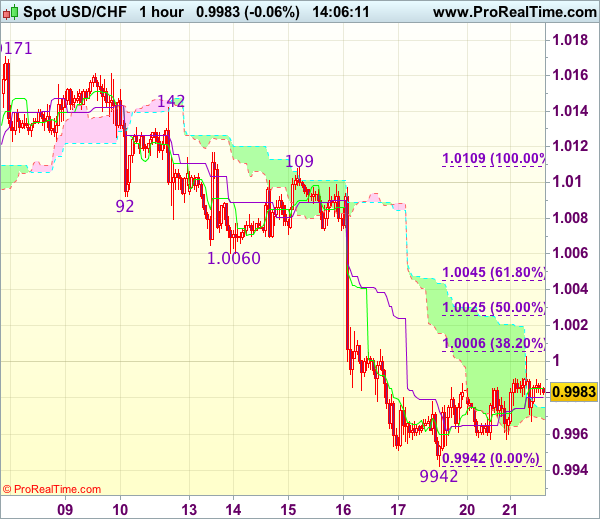
As the greenback recovered after finding support at 0.9942 on Friday, suggesting consolidation above this level would be seen and corrective bounce to 1.0005-10 (38.2% Fibonacci retracement of 1.0109-0.9942) cannot be ruled out, however, reckon upside would be limited to 1.0025 (50% Fibonacci retracement) and bring another decline later. Below said support at 0.9942 would extend recent decline from 1.0171 to 0.9920-25 but loss of near term downward momentum should prevent sharp fall below 0.9900 and reckon 0.9870-75 would hold from here.
In view of this, would not chase this fall here and would be prudent to sell dollar on recovery as 1.0020-25 should limit upside and bring another decline. Only above previous support at 1.0060 (now resistance) would abort and signal low is formed instead, risk rebound to 1.0090-95 first.
Trade Idea : GBP/USD – Buy at 1.2300
GBP/USD - 1.2345
Most recent candlesticks pattern : N/A
Trend : Near term up
Tenkan-Sen level : 1.2362
Kijun-Sen level : 1.2386
Ichimoku cloud top : 1.2375
Ichimoku cloud bottom : 1.2323
Original strategy :
Buy at 1.2310, Target: 1.2435, Stop: 1.2275
Position : -
Target : -
Stop : -
New strategy :
Buy at 1.2300, Target: 1.2435, Stop: 1.2265
Position : -
Target : -
Stop : -
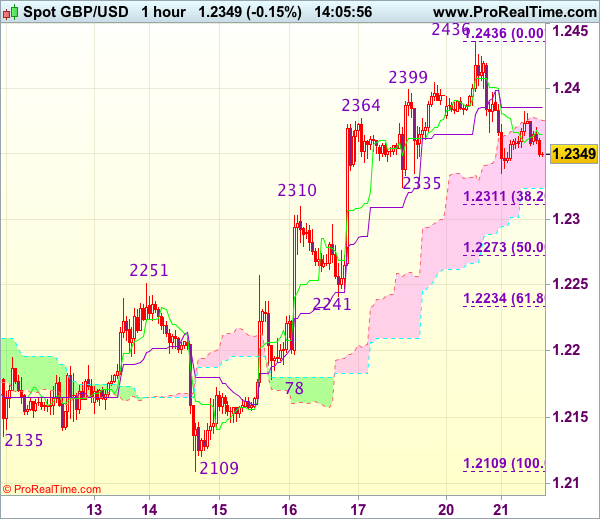
Cable’s retreat after yesterday’s brief rise to 1.2436 suggests consolidation below this level would be seen and pullback to support at 1.2335 cannot be ruled out, however, reckon downside would be limited to 1.2310 (previous resistance now support) and bring another rise later, above said resistance at 1.2436 would extend recent upmove from 1.2109 (this month’s low) to 1.2450 but loss of near term momentum should prevent sharp move beyond previous resistance at 1.2479, risk from there has increased for a retreat to take place later.
In view of this, would not chase this move from here and we are looking to buy cable on pullback as said previous resistance at 1.2310 should limit downside and bring another rise. Below 1.2270-75 (50% Fibonacci retracement of 1.2109-1.2436) would defer and suggest top is possibly formed, risk correction to 1.2241 support.
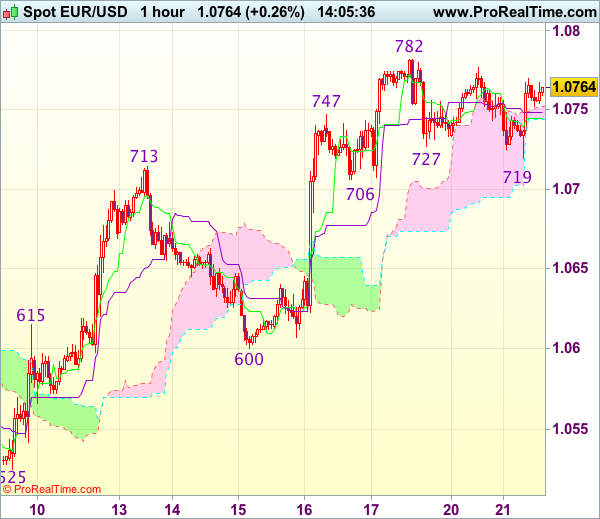
Trade Idea : EUR/USD – Buy at 1.0700
EUR/USD - 1.0763
Most recent candlesticks pattern : N/A
Trend : Near term up
Tenkan-Sen level : 1.0745
Kijun-Sen level : 1.0748
Ichimoku cloud top : 1.0752
Ichimoku cloud bottom : 1.0744
Original strategy :
Buy at 1.0700, Target: 1.0800, Stop: 1.0665
Position : -
Target : -
Stop : -
New strategy :
Buy at 1.0700, Target: 1.0800, Stop: 1.0665
Position : -
Target : -
Stop : -
As the single currency has continued trading with a firm undertone after last week’s rally, suggesting recent erratic upmove from 1.0493 low is still in progress and may extend further gain towards previous chart resistance at 1.0829, however, loss of near term upward momentum should prevent sharp move beyond 1.0850-60 and price should falter well below 1.0890-00, risk from there has increased for a retreat to take place later.
In view of this, would not chase this rise here and we are looking to buy euro on subsequent pullback as 1.0706 support should limit downside and bring another rise later. Below 1.0675-80 would defer and suggest top is possibly formed, risk weakness to 1.0640 (previous resistance now support) but still reckon indicated support at 1.0600 would remain intact.
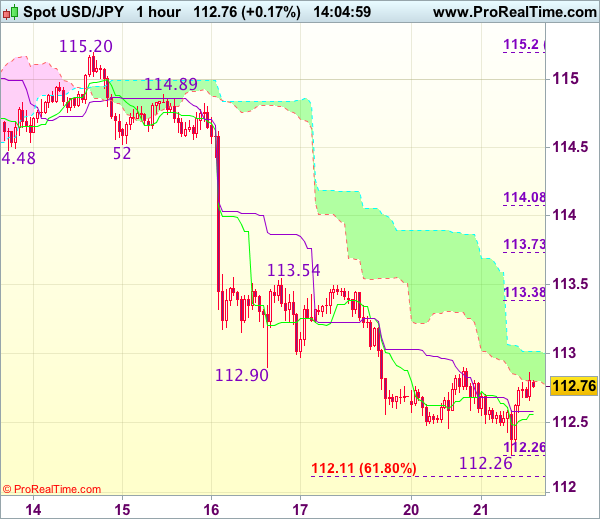
Trade Idea : USD/JPY – Buy at 112.55
USD/JPY - 112.75
Most recent candlesticks pattern : N/A
Trend : Near term down
Tenkan-Sen level : 112.56
Kijun-Sen level : 112.58
Ichimoku cloud top : 113.01
Ichimoku cloud bottom : 112.80
Original strategy :
Sell at 113.50, Target: 112.40, Stop: 113.85
Position : -
Target : -
Stop : -
New strategy :
Buy at 112.55, Target: 113.55, Stop: 112.20
Position : -
Target : -
Stop : -
Although the greenback fell briefly to 112.26, the subsequent rebound suggests consolidation above this level would be seen and gain to 113.00-05 is likely, above there would suggests low is possibly formed, bring a stronger rebound to 113.35-40 (38.2% Fibonacci retracement of 115.20-112.26), however, break of resistance at 113.54 is needed to provide confirmation, bring further subsequent gain to 113.70-75 (50% Fibonacci retracement).
In view of this, we are looking to buy dollar on dips but one must exit on such rebound. Below said support at 112.26 would risk one more fall to 112.10-15 (61.8% projection of 115.20-112.90 measuring from 113.54) but loss of downward momentum should prevent sharp fall below previous support at 111.69, risk remains for a rebound to take place later.
European Open Briefing
Global Markets:
- Asian stock markets: Nikkei down 0.35 %, Shanghai Composite gained 0.20 %, Hang Seng rose 0.40 %, ASX 200 lost 0.10 %
- Commodities: Gold at $1228 (-0.45 %), Silver at $17.36 (-0.45 %), WTI Oil at $49.10 (+0.40 %), Brent Oil at $51.90 (+0.50 %)
- Rates: US 10-year yield at 2.48, UK 10-year yield at 1.24, German 10-year yield at 0.44
News & Data:
- Australia ANZ Roy Morgan Weekly Consumer Confidence Index Mar 20: 112.0 (Prior 113.1)
- Australia House Price Index QoQ Q4: 4.1% (Prior 1.50%)
- Australia House Price Index YoY Q4:7.7% (Prior 3.50%)
- PBoC Fixes USDCNY Reference Rate At 6.9071 (Prev 6.8998)
RBA Meeting Minutes:
- Judged steady policy consistent with growth and inflation targets
- A rising AUD would complicate economic transition
- Recent data suggested a 'build-up of risks' in the housing market
- Home prices strong and rising briskly in Sydney and Melbourne
- Home investment borrowing had picked up, debt rising faster than household incomes
- Slow growth in incomes could restrain consumption given high debt levels
- Soft GDP wage measure suggests very little labour cost pressure in economy
- Wages growth, underlying inflation expected to rise only gradually
- Still difficult to assess momentum in labour market
Markets Update:
The Australian Dollar declined overnight as the RBA meeting minutes were considered rather dovish. Recent economic data out of Australia was weak too, especially the latest jobs market numbers. AUD/USD fell from 0.7735 to a low of 0.77. The pair found solid support there and bounced back to 0.7710, where it consolidated into the Sydney session close. Key support is now seen at 0.7650/60, while resistance lies at 0.7740, followed by 0.7780.
USD/JPY came under pressure in the early Asian session, falling to 112.25. However, the pair caught a bid later and recovered to 112.80. Resistance is noted at 113.00, and decent selling interest lies around 113.50.
The Pound was sold yesterday, following the news that Brexit will officially start next week. However, that was already expected and the downside momentum quickly waned. GBP/UD consolidated in a 1.2355-80 range in Asia. The focus now lies on the upcoming inflation data, which be released today at 09:30 GMT. The market is expecting an increase in the CPI numbers, from -0.5 % in January to +0.5 % in February.
Upcoming Events:
- 09:30 GMT – UK CPI
- 10:00 GMT – BoE Governor Carney speaks
- 10:00 GMT – FOMC Member Dudley speaks
- 12:30 GMT – US Current Account
- 12:30 GMT – Canadian Retail Sales
- 16:00 GMT – FOMC Member George speaks
- 22:00 GMT – FOMC Member Mester speaks
- 23:50 GMT – Japanese Trade Balance
- 23:50 GMT – BoJ Meeting Minutes
AUD/USD: RBA Concerned About House Prices And Highly Indebted Households
For the 24 hours to 23:00 GMT, the AUD rose 0.08% against the USD and closed at 0.7726.
On the data front, Australia's CB leading indicator advanced by 0.4% in January, compared to a drop of 0.1% in the preceding month.
LME Copper prices rose 0.03% or $2.0/MT to $5891.0/MT. Aluminium prices rose 0.4% or $7.0/MT to $1908.0/MT.
In the Asian session, at GMT0400, the pair is trading at 0.7709, with the AUD trading 0.22% lower against the USD from yesterday's close.
According to minutes of the Reserve Bank of Australia's (RBA) March meeting, board members expect to see Australian consumer prices continue to rise, albeit at a gradual pace. Further, the central bank warned of risks from rapidly climbing nation's house prices and an acceleration of domestic household debt.
In other economic news, Australia's house price index advanced 4.1% on a quarterly basis in 4Q 2016, more than market expectations for a rise of 2.5%. The index had climbed 1.5% in the previous quarter.
The pair is expected to find support at 0.7688, and a fall through could take it to the next support level of 0.7668. The pair is expected to find its first resistance at 0.7738, and a rise through could take it to the next resistance level of 0.7768.
Going ahead, Australia's Westpac leading index for February, set to release overnight, will be on investor's radar.
The currency pair is trading below its 20 Hr moving average and showing convergence with its 50 Hr moving average.
