Sample Category Title
GBP Rose Sharply As CPI Beats Forecast
News and Events:
UK inflation accelerate faster than BoE expected
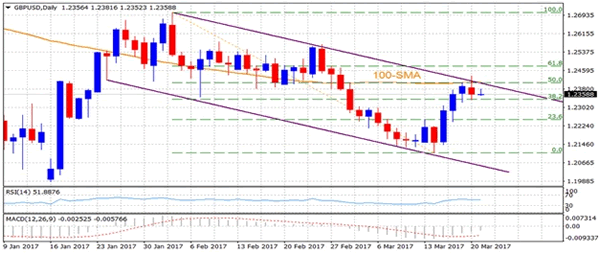
UK inflation accelerated substantially in February as the headline gauge rose 2.3%y/y versus 2.1% expected. More importantly, the core gauge, which excludes the most volatile components, climbed to 2%y/y (1.7% median forecast), adding pressure on the BoE. The pound sterling jumped sharply after the release as investors speculated about potential tightening measures from the central bank. GBP/USD was up 0.75% to 1.2450 this morning, while the pound rose 0.20% against the single currency with EUR/GBP hitting 0.8660.
Despite the fact that inflation accelerated faster than projected by the BoE at its February MPC meeting, we remain doubtful that the institution would take the risk to tighten its monetary policy at such an inappropriate time. Indeed, the government is about to trigger Article 50 and no one knows what is on the other side. In such a situation, the BoE cannot afford to reduce its support to the economy and will just have to sit tight and wait for inflation to decelerate. The committee projected that growth would slow over 2017 as households adjust their spending to lower real income growth, mostly due to the sharp depreciation of the sterling over the last few years.
In the short term, we are not ruling out further GBP strength with GBP/USD testing the 1.26 threshold.
Swiss watch exports fall...again
There is little respite for the Swiss watch industry despite broader improvements in global demand. Data released today showed that annual Swiss watch exports fell -10% to $1.50bn in February, further extending the sector's rapid decline witnessed since 2010. The negative data zapped growing optimism generated by year-end bounce and communication from leading watch exporters reporting solid demand. Swiss watch exports fell -26 to USA, -12 to Hong Kong, and 23 to UAE. However, China posted a 6.7% gain, a positive sign for the industry and China's domestic economic stability driver. Cleary the overvalued, uncompetitive Swiss CHF is having a significant effect on demand. However, changes in consumer behaviour must also be factored in. EURCHF remains the barometer for European political risk. With the result of the first French presidential debate and snap opinion polls suggesting a Macron victory, EURCHF rallied on fading political risk.
First French debate reveals clear two-horse race
The first of the French election televised debates kicked off last night with the six leading candidates taking to the podium on core election issues such as immigration, national security and economy.
Though relatively heated, with Macron and Le Pen in particular trading barbs, the debate did not reveal anything we did not already know. The debates agenda also lacked any focus on broader European issues and the current fragility of the EU. We would have been keen to gain further insight on how each potential president plans to engage with this issue. In particular, it would have been interesting to ascertain more concrete details from Le Pen’s concerning her Frexit plans as laid out in the National Front’s election manifesto.
Today, the single currency is enjoying a boost against the dollar with markets pricing in a stronger likelihood of a victory from Euro-centric candidate, Emmanuel Macron. At this stage, the election is rather looking like a three-horse race (Le Pen, Macron and Fillon) as o candidates such as Benoit Hamon and Jean-Luc Melenchon seem to be fading into the background. Hamon was the clear and outright loser of this debate. It is worth recalling that the socialist candidate, who was the victor of the left primary has now lost the support of Manuel Valls because of "diverging views”.debate. It is worth recalling that the socialist candidate, who was the victor of the left primary has now lost the support of Manuel Valls because of "diverging views”.
Today's Key Issues (time in GMT):
- Jan Trade Balance, last -2447m EUR / 08:00
- Feb Money Supply M3 YoY, last 2,90% CHF / 08:00
- Fed's Dudley Speaks on Reforming Bank Culture at Closed Event USD / 08:20
- Feb CPIH YoY, exp 2,20%, last 1,90% GBP / 09:30
- Feb CPI MoM, exp 0,50%, last -0,50% GBP / 09:30
- Feb CPI YoY, exp 2,10%, last 1,80% GBP / 09:30
- Feb CPI Core YoY, exp 1,70%, last 1,60% GBP / 09:30
- Feb Retail Price Index, exp 267,5, last 265,5 GBP / 09:30
- Feb RPI MoM, exp 0,80%, last -0,60% GBP / 09:30
- Feb RPI YoY, exp 2,90%, last 2,60% GBP / 09:30
- Feb RPI Ex Mort Int.Payments (YoY), exp 3,10%, last 2,90% GBP / 09:30
- Feb PPI Input NSA MoM, exp 0,10%, last 1,70%, rev 1,60% GBP / 09:30
- Feb PPI Input NSA YoY, exp 20,10%, last 20,50%, rev 20,10% GBP / 09:30
- Feb PPI Output NSA MoM, exp 0,30%, last 0,60% GBP / 09:30
- Feb PPI Output NSA YoY, exp 3,70%, last 3,50%, rev 3,60% GBP / 09:30
- Feb PPI Output Core NSA MoM, exp 0,20%, last 0,50% GBP / 09:30
- Feb PPI Output Core NSA YoY, exp 2,50%, last 2,40%, rev 2,50% GBP / 09:30
- Jan House Price Index YoY, exp 6,40%, last 7,20%, rev 5,70% GBP / 09:30
- Feb Public Finances (PSNCR), last -26.5b, rev -22.7b GBP / 09:30
- Feb Central Government NCR, last -27.8b GBP / 09:30
- Feb Public Sector Net Borrowing, exp 2.8b, last -9.8b, rev -11.7b GBP / 09:30
- Feb PSNB ex Banking Groups, exp 3.2b, last -9.4b, rev -11.0b GBP / 09:30
- Fed's Dudley, BOE's Carney Speak at Bank Ethics London Event USD / 10:35
- Mar CBI Trends Total Orders, exp 5, last 8 GBP / 11:00
- Mar CBI Trends Selling Prices, exp 32, last 32 GBP / 11:00
- Jan Retail Sales MoM, exp 1,50%, last -0,50% CAD / 12:30
- 4Q Current Account Balance, exp -$129.0b, last -$113.0b USD / 12:30
- Jan Retail Sales Ex Auto MoM, exp 1,30%, last -0,30% CAD / 12:30
- Conference Board China February Leading Economic Index CNY / 13:00
- Fed's George Speaks in Washington on U.S. Economy and the Fed USD / 16:00
- Bank of Canada Deputy Governor Lawrence Schembri Speech CAD / 19:45
- Fed's Mester Speaks at University of Richmond USD / 22:00
- 4Q BoP Current Account Balance, exp -$12.00b, last -$3.40b INR / 22:00
- Feb Tax Collections, exp 93000m, last 137392m BRL / 23:00
The Risk Today:
EUR/USD is challenging the resistance implied by its rising trendline (around 1.0795). A break of upside would signal persistent buying pressures. Key resistance is still given at a distance 1.0874 (08/12/2017 high). Strong support can be found at 1.0493 (22/02/2017 low). The technical structure suggests deeper increase towards resistance at 1.0874. In the longer term, the death cross late October indicated a further bearish bias. The pair has broken key support given at 1.0458 (16/03/2015 low). Key resistance holds at 1.1714 (24/08/2015 high). Expected to head towards parity.
GBP/USD has successfully tested the support at 1.2110 and continues to bounce higher. A break of key resistance (at 1.2429) is needed to open the way for further strength. Yet, the pair remains in a clear downtrend suggesting short term correction. Key resistance can be located at 1.2570 (24/02/2017 high). Hourly support is at 1.2324 (03/17/2017 low). The long-term technical pattern is even more negative since the Brexit vote has paved the way for further decline. Long-term support given at 1.0520 (01/03/85) represents a decent target. Long-term resistance is given at 1.5018 (24/06/2015) and would indicate a long-term reversal in the negative trend. Yet, it is very unlikely at the moment.
USD/JPY has failed to break key resistance given at 115.62 (19/01/2016 high) confirming persistent selling pressure. The pair remains stuck in sideways trading pattern between 111.36 and 115.62. Hourly support given at 112.27 (intraday low). Hourly resistance can be located at 113.57 (16/03/2017 high). We favor a long-term bearish bias. Support is now given at 96.57 (10/08/2013 low). A gradual rise towards the major resistance at 135.15 (01/02/2002 high) seems absolutely unlikely. Expected to decline further support at 93.79 (13/06/2013 low).
USD/CHF has paused after sharp exit from uptrend channel. Hourly support is given at 0.9862 (31/01/2017 low) has been broken. Key resistance can be found at a distance at 1.0344 (15/12/2016 high). Expected to consolidate. In the long-term, the pair is still trading in range since 2011 despite some turmoil when the SNB unpegged the CHF. Key support can be found 0.8986 (30/01/2015 low). The technical structure favours nonetheless a long term bullish bias since the unpeg in January 2015.
| EURUSD | GBPUSD | USDCHF | USDJPY |
| 1.1300 | 1.3445 | 1.0652 | 121.69 |
| 1.0954 | 1.3121 | 1.0344 | 118.66 |
| 1.0874 | 1.2771 | 1.0171 | 115.62 |
| 1.0792 | 1.2464 | 0.9963 | 112.57 |
| 1.0454 | 1.1986 | 0.9862 | 111.36 |
| 1.0341 | 1.1841 | 0.9550 | 106.04 |
| 1.0000 | 1.0520 | 0.9444 | 101.20 |
Gold Consolidating Around 1235, Silver Consolidating After Friday Gains, Crude Oil Pausing Above 48.00.
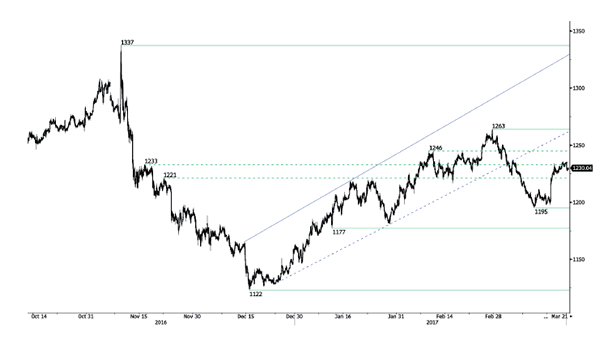
Gold Consolidating around 1235.
Gold has risen sharply, nearly invalidating the bearish short-term outlook. The momentum seems back to bullish. Key resistance is located at 1263 (27/02/2017 high). Hourly support can be found at 1224.10 (16/03/2017 low).
In the long-term, the technical structure suggests that there is a growing upside momentum. A break of 1392 (17/03/2014) is necessary ton confirm it, A major support can be found at 1045 (05/02/2010 low).
Silver Consolidating after Friday gains..
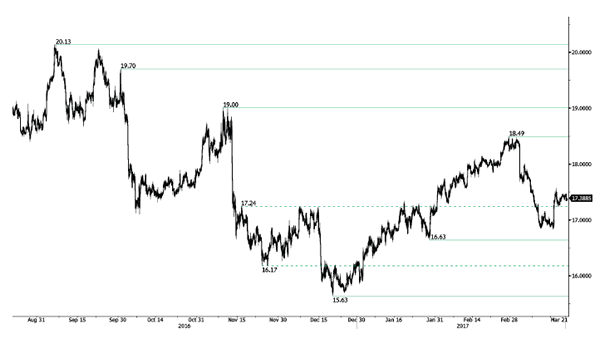
Silver rose sharply Friday, invalidating the bearish outlook linked to the previous bearish pause. Correct pullback has failed to find seller indicating test of 17.56 resistance (16/03/2017 high). Strong support is given at 16.84 (27/01/2016 low).
In the long-term, the death cross indicates that further downsides are very likely. Resistance is located at 25.11 (28/08/2013 high). Strong support can be found at 11.75 (20/04/2009).
Crude oil Pausing above 48.00.
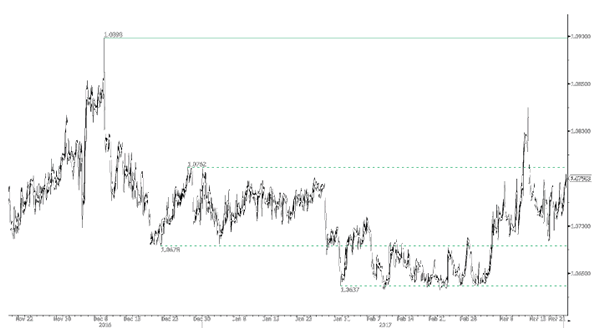
Crude oil's bearish pressures continues despite correct bounce due to a short-squeeze. The commodity had been unable to mount a serious challenge to resistance at 49.61 (08/12/2017 low) hourly support given at 47.09 (016/03/2017 low) Expected to see deeper selling pressures.
In the long-term, crude oil has recovered after its sharp decline last year. However, we consider that further weakness are very likely. Strong support lies at 24.82 (13/11/2002) while resistance can now be found at 55.24 (03/01/2017 high).
USD/CHF Candlesticks and Ichimoku Analysis
Weekly
• Last Candlesticks pattern: Doji
• Time of formation: 26 Sep 2016
• Trend bias: Sideways
Daily
• Last Candlesticks pattern: Shooting star
• Time of formation: 25 Oct 2016
• Trend bias: Near term up
USD/CHF – 0.9963
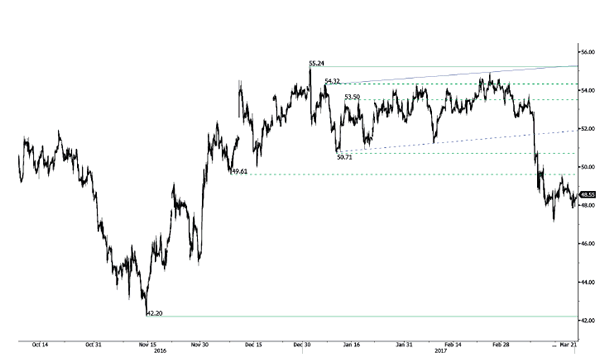
The greenback dropped again last week and has remained under pressure, adding credence to our bearish view that top has possibly been formed at 1.0171 earlier this month and consolidation with mild downside bias remains for test of 0.9930-35, however, a daily close below there is needed to confirm early rebound from 0.9861 has ended at 1.0171, bring further fall to said support at 0.9861. A drop below this level would revive bearishness and extend erratic decline from 1.0344 top for retracement of early upmove to 0.9850-55 (61.8% Fibonacci retracement of 0.9550-1.0344) and possibly towards 0.9800.
On the upside, whilst initial recovery to 1.0000-10 cannot be ruled out, reckon the Tenkan-Sen (now at 1.0052) would limit upside and bring another decline later. A break of the upper Kumo (now at 1.0103) would abort and prolong choppy trading within recent established broad range, however, said resistance at 1.0171 should remain intact. Only above 1.0171 would signal the erratic rise from 0.9861 (Jan’s low) is still in progress and may extend further gain to 1.0195-00, having said that, reckon key resistance at 1.0248 would cap upside and bring retreat later.
Recommendation: Sell at 1.0010 for 0.9810 with stop above 1.0110.
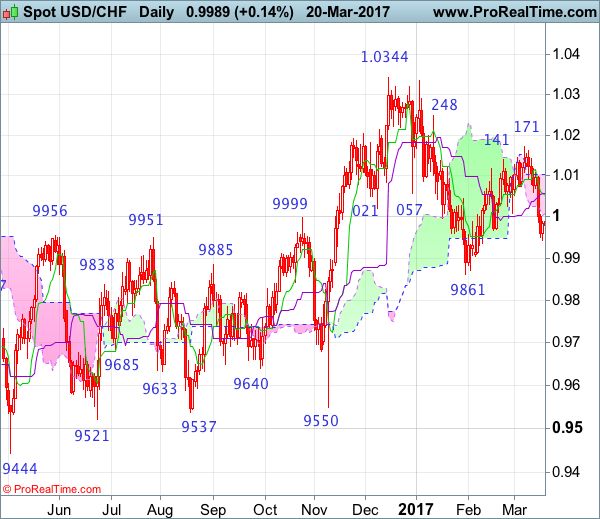
On the weekly chart, last week’s selloff adds credence to the indicated shooting star bearish candlestick pattern, justifying our view that the rebound from 0.9861 low has ended there and consolidation with downside bias remains for weakness to 0.9930-35, however, a weekly close below there is needed to confirm and signal the fall from 1.0344 top has resumed for retracement of early upmove to 0.9850-55 (61.8% Fibonacci retracement) and possibly towards the Ichimoku cloud bottom (now at 0.9722) but reckon downside would be limited to 0.9690-00 and price should stay well above support at 0.9550.
On the upside, expect recovery to be limited to the Tenkan-Sen (now at 1.0016) and price should falter below 1.0075-80, bring another decline. Only break of said resistance at 1.0171 would extend the rebound from 0.9861 to 1.0195-00 but price should falter below key resistance at 1.0248, bring further choppy trading. A sustained breach above this level would signal the retreat from 1.0344 has ended, bring further gain to 1.0335-44 resistance area but break there is needed to signal early upmove has resumed for headway to 1.0400-10 and later 1.0500.
EUR/CHF Buying Pressures Increase, EUR/JPY Temporary Surge, EUR/GBP Bullish Flag Pattern.
EUR/CHF Buying pressures increase.
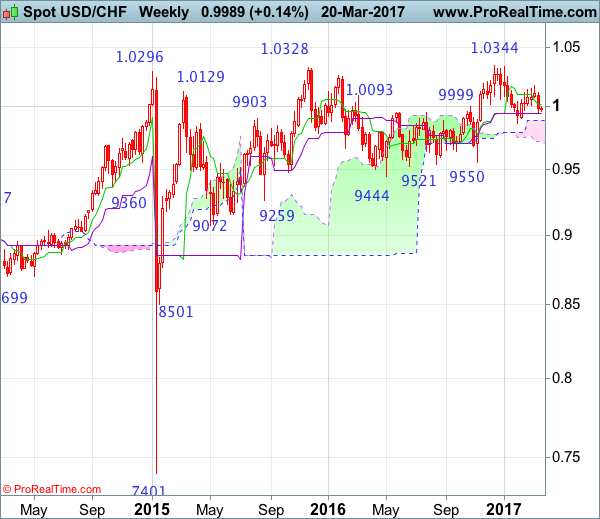
EUR/CHF's bullish pressures increase. The medium-term pattern suggests us to see continued bearish pressures towards key support that can be found at 1.0623 (24/06/2016 low). Yet, the pair is facing stronger short-term bullish pressures.
In the longer term, the technical structure is mixed. Resistance can be found at 1.1200 (04/02/2015 high). Yet,the ECB's QE programme is likely to cause persistent selling pressures on the euro, which should weigh on EUR/CHF. Supports can be found at 1.0184 (28/01/2015 low) and 1.0082 (27/01/2015 low).
EUR/JPY Temporary surge.
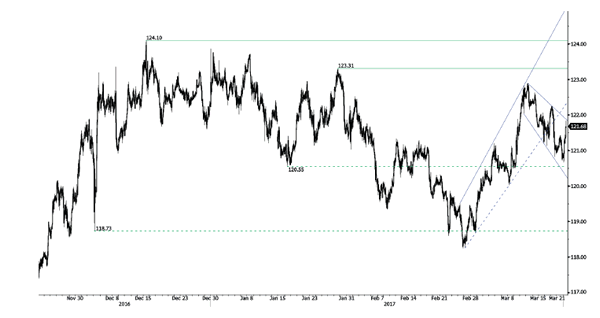
EUR/JPY rejection at 122.88 has triggered a correction. Yet, the pair is very volatile. Supports stand at 120.55 (17/01/2017 low) and 120.02 (08/03/2017 low). Resistance stands at 122.88 (13/03/0217 high).
In the longer term, the technical structure validates a medium-term succession of lower highs and lower lows. As a result, the resistance at 149.78 (08/12/2014 high) has likely marked the end of the rise that started in July 2012. Strong support at 94.12 (24/07/2012 low) looks nonetheless far away.
EUR/GBP Bullish flag pattern.
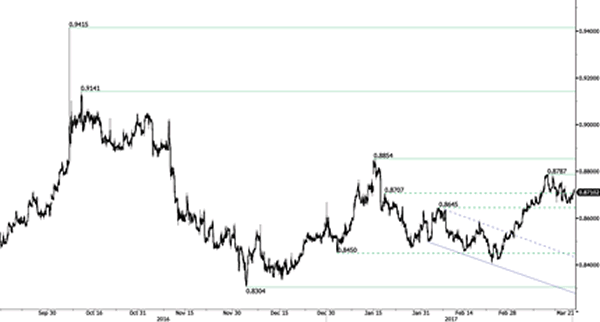
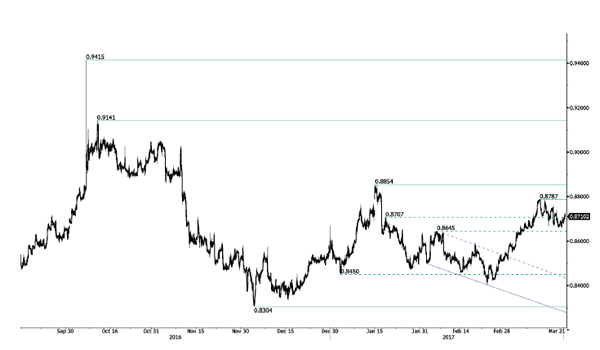
EUR/GBP is correcting lower yet formation of bullish flag suggest reversal of current weakness targeting 0.9000. Key resistance is given at 0.8854 (15/01/2017 high). Support is located at 0.864505/02/2017).
In the long-term, the pair has largely recovered from recent lows in 2015. The technical structure suggests a growing upside momentum. The pair is trading above from its 200 DMA. Strong resistance can be found at 0.9500 psychological level.
USD/CHF Consolidating, USD/CAD Slight Bounce, AUD/USD Monitor The Key Resistance At 0.7778.
USD/CHF Consolidating.
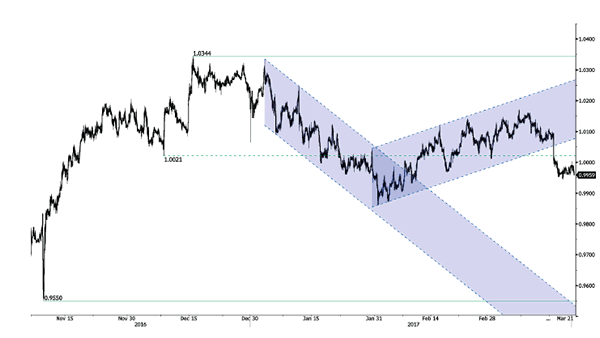
USD/CHF has paused after sharp exit from uptrend channel. Hourly support is given at 0.9862 (31/01/2017 low) has been broken. Key resistance can be found at a distance at 1.0344 (15/12/2016 high). Expected to consolidate.
In the long-term, the pair is still trading in range since 2011 despite some turmoil when the SNB unpegged the CHF. Key support can be found 0.8986 (30/01/2015 low). The technical structure favours nonetheless a long term bullish bias since the unpeg in January 2015.
USD/CAD Slight bounce.
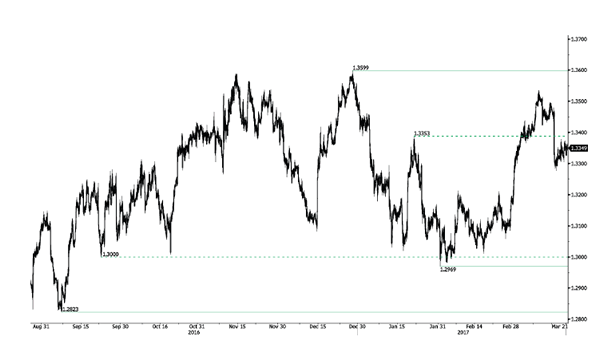
USD/CAD is bouncing. However a break of resistance area around 1.3400 is needed to invalidate the current short term bearish technical structure. The road seems still wideopen for larger decline. Key support is given at 1.2969 (31/01/2017 low).
In the longer term, there is a golden cross with the 50 dma crossing the 200 dma indicating further upside pressures. Strong resistance is given at 1.4690 (22/01/2016 high). Long-term support can be found at 1.2461 (16/03/2015 low).
AUD/USD Monitor the key resistance at 0.7778.
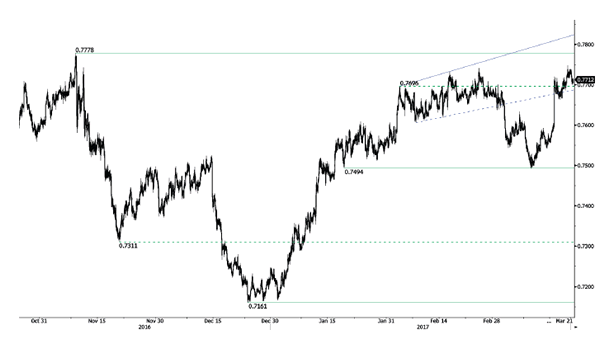
AUD/USD has successfully tested the support at 0.7497. A break of the key resistance at 0.7778 (08/11/2016 high) is needed to open the way for further strength. Hourly supports can be found at 0.7664 (16/03/2017 low).
In the long-term, we are waiting for further signs that the current downtrend is ending. Key supports stand at 0.6009 (31/10/2008 low) . A break of the key resistance at 0.8295 (15/01/2015 high) is needed to invalidate our long-term bearish view.
EUR/USD Pushing Higher, GBP/USD Challenging Its Declining Trendline, USD/JPY Continued Weakness Within Sideways Channel.
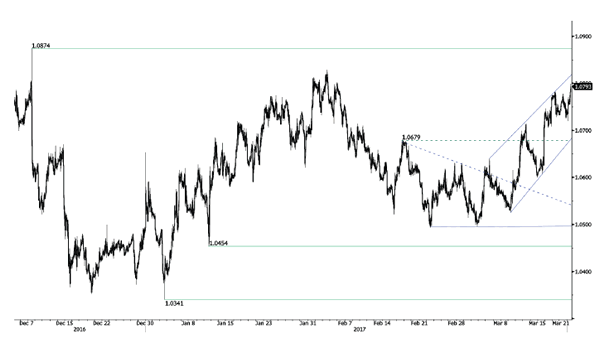
EUR/USD Pushing higher.
EUR/USD is challenging the resistance implied by its rising trendline (around 1.0795). A break of upside would signal persistent buying pressures. Key resistance is still given at a distance 1.0874 (08/12/2017 high). Strong support can be found at 1.0493 (22/02/2017 low). The technical structure suggests deeper increase towards resistance at 1.0874.
In the longer term, the death cross late October indicated a further bearish bias. The pair has broken key support given at 1.0458 (16/03/2015 low). Key resistance holds at 1.1714 (24/08/2015 high). Expected to head towards parity.
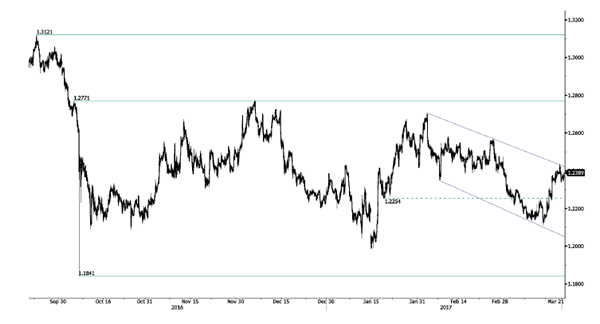
GBP/USD Challenging its declining trendline.
GBP/USD has successfully tested the support at 1.2110 and continues to bounce higher. A break of key resistance (at 1.2429) is needed to open the way for further strength. Yet, the pair remains in a clear downtrend suggesting short term correction. Key resistance can be located at 1.2570 (24/02/2017 high). Hourly support is at 1.2324 (03/17/2017 low).
The long-term technical pattern is even more negative since the Brexit vote has paved the way for further decline. Long-term support given at 1.0520 (01/03/85) represents a decent target. Long-term resistance is given at 1.5018 (24/06/2015) and would indicate a long-term reversal in the negative trend. Yet, it is very unlikely at the moment.
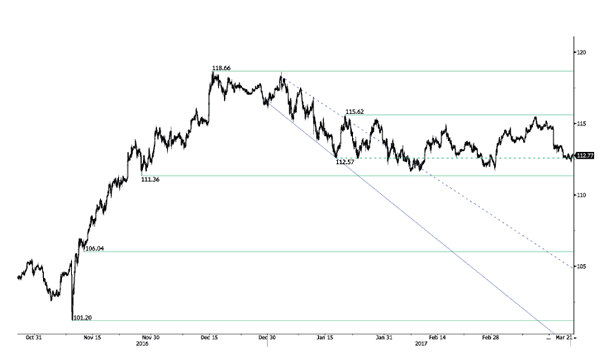
USD/JPY Continued weakness within sideways channel.
USD/JPY has failed to break key resistance given at 115.62 (19/01/2016 high) confirming persistent selling pressure. The pair remains stuck in sideways trading pattern between 111.36 and 115.62. Hourly support given at 112.27 (intraday low). Hourly resistance can be located at 113.57 (16/03/2017 high).
We favor a long-term bearish bias. Support is now given at 96.57 (10/08/2013 low). A gradual rise towards the major resistance at 135.15 (01/02/2002 high) seems absolutely unlikely. Expected to decline further support at 93.79 (13/06/2013 low).
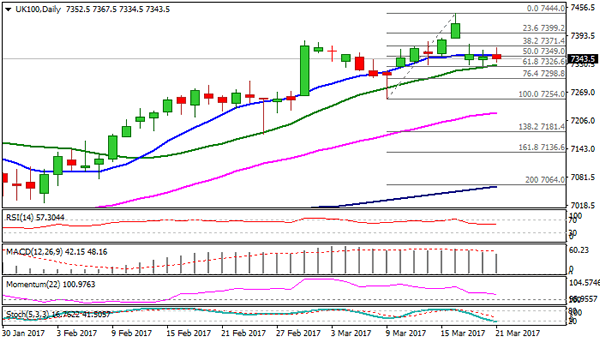
FTSE Fall After CPI Data But Near-Term Action Remains Within 7326/74 Range
FTSE dipped to the session low at 7334 on upbeat UK CPI data that boosted pound, falling from session high at 7367, where hourly cloud base capped recovery attempts. The index is holding within 7326/7374 range for the third straight day, after pullback from fresh record high at 7444 found footstep at 7326 pivot (Fibo 61.8% of 7254/7444 upleg, reinforced by rising 20SMA). Near-term studies are in neutral mode, as the price is in range-trading, however, overall picture remains bullishly aligned. While 7326 support holds, scope exists for fresh attempts higher. Break above range top and filling last week's gap are needed to generate stronger bullish signal and re-focus 0.7444 top. Otherwise, increased downside risk could be expected on violation and close below 7326 Fibo support that would expose next pivot at 7309 (sideways-moving daily Kijun-sen) and risk return to 7254 (09 Mar trough) on stronger bearish acceleration.
Res: 7367, 7374, 7399, 7424
Sup: 7334, 7326, 7309, 7298
EUR/USD – Euro Hits 1.08 After French Election Debate
EUR/USD has posted gains in the Tuesday session. Currently, the pair is trading at the 1.08 line. On the release front, it's another quiet day. The sole event in Europe is a meeting of EU finance ministers. In the US, FOMC member William Dudley will speak at a Bank of England conference in London. The US will also release Current Account, with the deficit expected to rise to $129 billion.
With the Fed's quarter-rate point behind us, what's next for Janet Yellen & Co.? The CME Group has priced a rate hike in May at just 6%, while a June move is priced at 54%. With a dearth of key fundamentals in the US this week, the markets are left to monitoring comments from FOMC members who will be speaking this week, including Fed Chair Janet Yellen. On Monday, Chicago Fed President Charles Evans said he expects the Fed to raise rates two more times this year. This echoes the Fed's projection in its rate statement. Although three rate hikes in 2017 appears impressive, market players want four hikes, and have reacted with disappointment to the Fed's more cautious approach. This has sent the US dollar lower, and the euro has improved to 5-week highs, briefly punching past the 1.08 line on Tuesday.
The Dutch election last week was cheered by EU backers across the continent and boosted the euro. Next stop on the election train is France, which holds presidential elections next month. Polls have far rightist Marine Le Pen and centrist Emmanuel Macron running neck and neck in the first round of the presidential election on April 23. Still, Macron is expected to win in the second-round vote in May. In a highly-anticipated television debate on Monday, Macron and Le Pen had a chance to hawk their wears, and a survey found that Macron won the debate. Le Pen, a far right candidate and euro-sceptic, has pledged to take France out of the euro and hold a referendum on EU membership. Macron's strong showing in the debate has improved market sentiment and helped boost the euro on Tuesday. France boasts the number two economy in the eurozone, so we can expect more volatility from the euro as we get closer to Election Day.
Forex Technical Analysis
EUR/USD
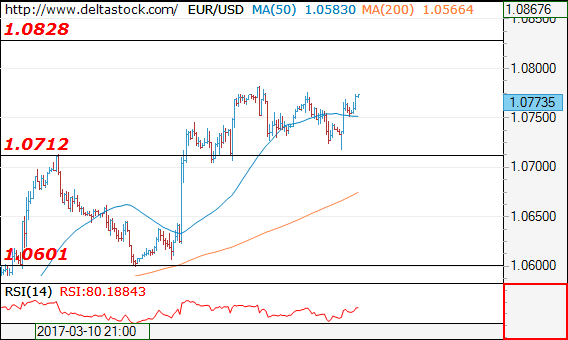
Current level - 10773
Yesterday's slide to 1.0712 support has finalized the corrective pattern below 1.0780 and the bullish outlook is reinstated, for a rise towards 1.0828 resistance.
| Resistance | Support | ||
| intraday | intraweek | intraday | intraweek |
| 1.0828 | 1.0870 | 1.0712 | 1.0600 |
| 1.0870 | 1.0945 | 1.0600 | 1.0490 |
USD/JPY
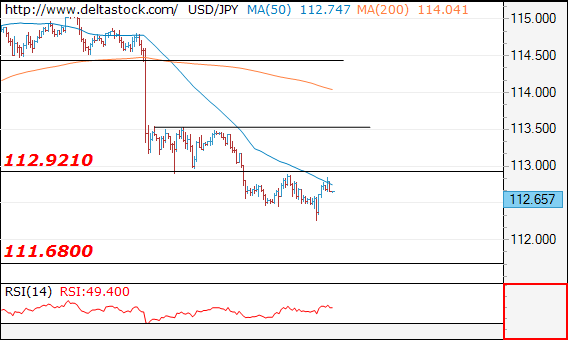
Current level - 112.66
The overall outlook remains negative below 112.90, for a slide towards 111.60 area. Crucial on the upside is still 113.50.
| Resistance | Support | ||
| intraday | intraweek | intraday | intraweek |
| 112.90 | 115.65 | 111.60 | 111.60 |
| 114.50 | 118.65 | 111.60 | 110.30 |
GBP/USD
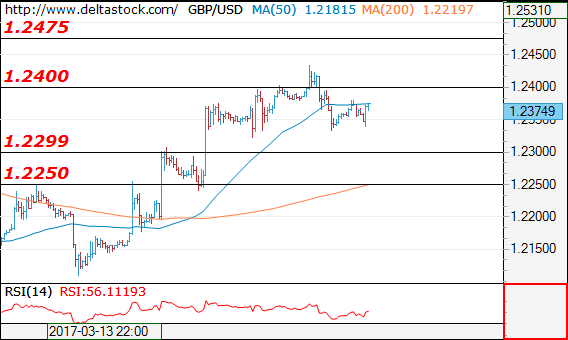
Current level - 1.2374
There is a minor reversal at 1.2432 and there is an intraday risk of a dip to 1.2300 area before advancing towards 1.2570 resistance zone.
| Resistance | Support | ||
| intraday | intraweek | intraday | intraweek |
| 1.2475 | 1.2570 | 1.2300 | 1.2107 |
| 1.2570 | 1.2570 | 1.2250 | 1.1984 |
GBPUSD – Upbeat CPI Data Send Cable Above Daily Cloud
Sterling gained strong support from upbeat CPI numbers, on 2.3% y/y in Feb vs 2.1% forecast and 0.7% m/m release beat the forecast at 0.5%.
Cable surged through daily cloud in immediate reaction on data and met next target at 1.2457 (Fibo 76.4% of 1.2568/1.2107 downleg), with 1.2476 (27 Feb high) and psychological 1.2500 barrier being in focus.
Better-than-expected inflation data are expected to further boost BoE’s hawkish hold from last week’s MPC meeting for early interest rate hike.
Broken daily cloud top now acts as immediate support, with the pair looking for daily close above it to confirm strong bullish stance.
Next support lies at 1.2408 (100 SMA) and guarding daily cloud base at 1.2379 that marks lower pivot.
Res: 1.2476, 1.2500, 1.2521, 1.2568
Sup: 1.2435, 1.2408, 1.2379, 1.2337