Sample Category Title
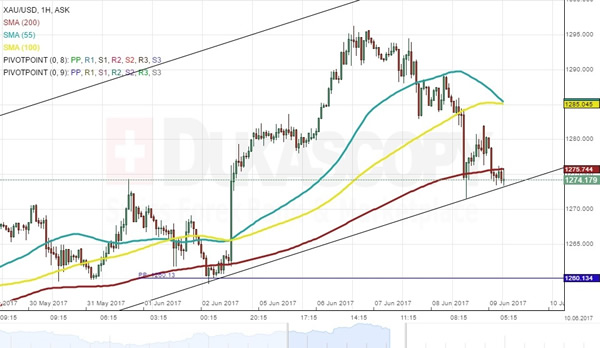
Gold Analysis: Reaches Significant Support
During the early hours of Friday's trading session the yellow metal was located near the lower trend line of the medium term ascending channel pattern near the 1,274 level. The metal was facing the resistance of the 200-hour SMA, which was pushing the commodity price into the support level. Due to that reason it is yet to be seen whether the pattern holds its ground. However, it is more likely that it will hold, as no significant fundamental changed have occurred in the world. Moreover, the recent political turmoil in the US has increased. Although, if the trend line is broken a fall down to the monthly PP at the 1,260.13 level will be a high probability. Meanwhile, in the case of breaking free from the 200-hour SMA the bullion might jump to the 1,285 mark.
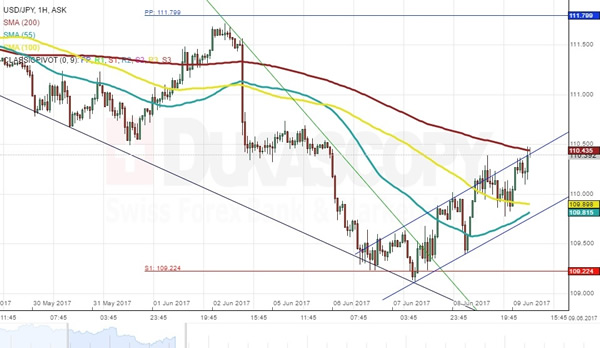
USD/JPY Analysis: To Slide Back To 110.00
The USD/JPY currency pair confirmed the ascending channel pattern with its recovery from the 109.40 area, with the exchange rate now continuing to test the upper boundary. The trend-line is now also coinciding with the 200-hour SMA, which altogether should cause the Buck to slightly weaken against the Yen, allowing the pair to slide back to 110.00, thus, retesting the pattern's support line. Technical indicators in all timeframes support this possibility, but before this scenario plays out temporary volatility breaches to the upside could occur, due to yesterday's excessive USD-buying. The majority, namely 62%, are still buying the Greenback, although it is still far from being overbought, which could mean bad news for the channel, as upside breakout risks emerge.
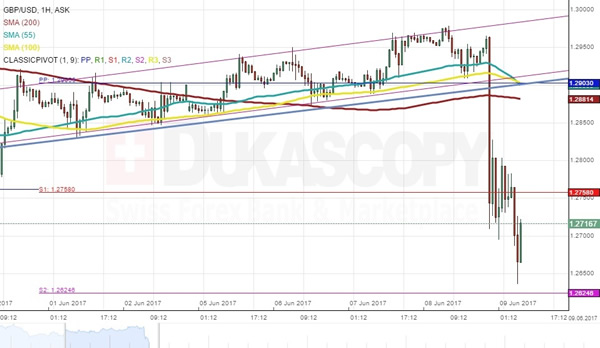
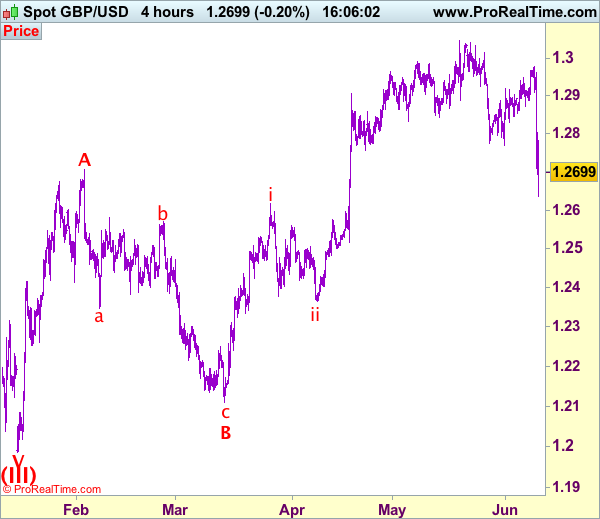
GBP/USD Analysis: Plummets After Election Results
The UK Parliamentary Election results had a devastating effect on the Pound, causing it to trim all previous month's gains against the Buck. Even though the bearish momentum should now persist, the Sterling still has a chance to undergo a corrective recovery. The RSI indicator is near its lower border, which suggests the bullish trend is about to return. However, no solid supports are present to help achieve this goal, the only nearest one being the monthly S1 at 1.2624. On a larger scale the bearish development is not a surprise, as the breach of the wedge's support line was anticipated. In case losses do continue to take place, a solid turnaround points are around 1.26 and 1.2550.
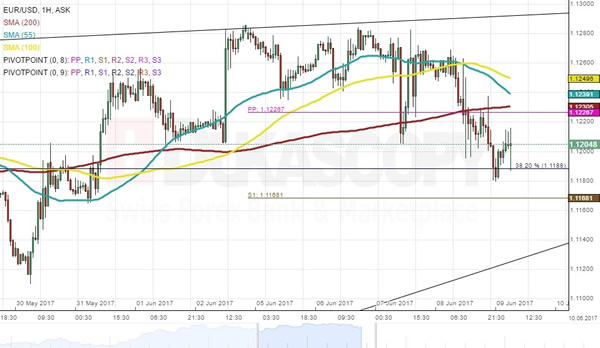
EUR/USD Analysis: Falls Below 1.12 Mark
The European Central Bank did not change its policy on Thursday. However, the release of the suspense was enough to cause the reveal of the future direction of the EUR/USD currency exchange rate. The pair began to move lower, as it passed the support of the weekly PP at 1.1227 until it reached the support of the 38.20% Fibonacci retracement level at the 1.1188 mark. By having a glance at the movements of the pair during the past few trading sessions it can be assumed that the rebound from the retracement level is a marking of the first point in a short term pattern. The pattern is most likely going to guide the pair lower to the medium term ascending channel's lower trend line, which on Friday was close to the 1.1140 level.
Technical Outlook: FTSE100 Bounced On Weaker Pound, Signals Of Correction End Turn Near-Term Focus Higher
FTSE100 bounced strongly on Friday, backed by significantly weaker pound after election results were out. The index spiked to session high at 7544 in early hours of European trading, on bounce from 7410 low, hit after market opening.
Today’s bounce retraced 76.4% of 0.7587/7410 pullback, signaling that correction may be over. Strong support at 7517 (Fibo 38.2% of 7143/7587 upleg) managed to contain dip as expected,
with fresh upside attempts seen after correction. Pullback from session high at 7544 found support at 7477 (4-hr cloud base / 50% retracement of today’s 7410/7544 rally), which is expected to hold and keep fresh near-term bulls intact.
Slow Stochastic on daily chart is emerging from oversold territory and supports scenario of fresh upside action for full retracement of 7587/7140 corrective phase and possible extension higher, as outlook for pound looks negative on rising political uncertainty after UK election.
Res: 7512, 7544, 7570, 7587
Sup: 7477, 7461, 7431, 7410
Technical Outlook: AUDUSD – Extended Consolidation Between 100/200SMA’s But Risk Of Deeper Pullback In Play
Strong four-day recovery from 0.7369 (02 June low) is showing initial signs of stall after rally peaked at 0.7566 on Wednesday and is holding in range between 200SMA (0.7527) and 100SMA (0.7556) for the second day. The Aussie is expected to maintain firm tone while 200SMA is holding that may result in prolonged consolidation. On the other side, increased risk of pullback is expected on firm break below 200SMA which may extend towards next significant supports at 0.7496/91 (55SM/Fibo 38.2% of 0.7369/0.7566 upleg). Slow stochastic is turning lower in overbought territory on daily chart and would support scenario on reversal.
Res: 0.7556, 0.7585, 0.7610, 0.7664
Sup: 0.7527, 0.7495, 0.7468, 0.7476
Draghi Signals No Early ECB Tightening
- Stubbornly soft core inflation leads ECB to call for ‘patience' on policy
- ECB emphasises good news on growth is not threatening higher inflation
- Reduced downside risks means possibility of lower rates no longer signalled…
- … But main message is that policy will remain easy for longer
- We think this message could change before end-year
ECB president Mario Draghi had two clear and related messages for markets. The first is that the ECB is increasingly confident in the strength and durability of the current upswing in Euro area growth (which he attributes significantly to its monetary policy support).
The second is that because inflation remains subdued, even with this improvement in activity, there is no reason to contemplate any early reduction in the current ‘very substantial degree of monetary accommodation' being provided by the ECB. Indeed, the ECB would be willing to ease again if conditions deteriorate although that is now deemed less likely as upside and downside risks to activity have become broadly balanced with the progress of the recovery.
These two messages are more dovish than many had expected, but not dramatically so. As a result, there was no major market reaction although term interest rates softened marginally while the exchange rate of the Euro eased slightly. There is a general sense in markets that tough and potentially divisive decisions on ECB policy won't be needed for another three or six months. So, the decision to kick those particular cans down the road isn't entirely surprising and could still be consistent with a range of different outcomes by end‐year
The tone Mr Draghi adopted is clearly intended to limit market speculation about the possibility of any major change in ECB policy being signalled at the next major ECB policy meeting in September (the next press conference meeting on July 20th was never regarded as a likely date for significant policy pronouncements). In turn, this will encourage the view that decisions regarding the Asset Purchase Programme scheduled to run until at least the end of this year and the future course of ECB policy rates will take longer to translate into a meaningful move away from the ECB's current policy stance.
In principle, the primary reason for Mr Draghi's relaxed message was the ‘Goldilocks' picture of the outlook for the Euro area painted by the ECB's new projections. These suggest that economic growth up to 2019 will remain robust, with growth revised up (albeit by a marginal 0.1%) in each of the three years.
Healthier activity is seen delivering a fractionally lower unemployment rate than foreseen three months ago (8.3% v 8.4% in 2019). However, underlying inflation is expected to be slightly lower (by 0.1%) in both 2018 and 2019. Importantly, this means the new projection for 2019, at 1.7%, is a shade below levels Mr Draghi described previously as meeting the ECB target of ‘below, but close to, 2%'.
The new projections formalise the distinction drawn by Mr Draghi at the previous ECB press conference in late April between strengthening activity and subdued inflation in the Euro area of late. The current divergence between strong growth and subdued inflation in the Euro area is unusual but not unique. The key question is whether the ECB thinks it will be sustained.
It is notable that on two previous occasions, somewhat stronger spikes in growth prompted an eventual ECB response in the shape of higher policy rates. It may well be that the chastening experience of altogether unwise rate hikes in the Spring of 2011 are informing the current ECB perspective, but it is likely that a more fundamental questioning of the link between stronger activity and higher inflation is also taking place.
Looking through the impact of volatility in food and energy costs, price pressures have been largely absent for some considerable time. ‘Core' inflation in the Euro area has now been below rates consistent with the ECB's definition of price stability since August 2012. In the US, where economic recovery has been longer and stronger, core PCE inflation, has been below the Federal Reserve's target of 2% since March 2012.
A key question is whether this diminished pass through is permanent or merely prolonged by the aftermath of the crisis. The projections do not provide a definitive answer. Our interpretation of Mr Draghi's frequent request during the press conference for ‘patience' in relation to policy hints that the ECB sees the transmission from growth to inflation as delayed rather than broken.
With the recovery in the Euro area only emerging from a tentative stage and core inflation, as Mr Draghi repeatedly emphasised, largely unchanged for some considerable time, it makes perfect sense for the ECB not to pre‐commit at this point.
It should be emphasised that Mr Draghi's ability to remain non‐committal will diminish notably between now and end year. In a practical sense, the scheduled December end of the Asset Purchase Programme means intentions in this regard to will need to be signalled most likely by September (or October at the latest).
It should also be noted that the December economic projections will extend to 2020. In the absence of a marked softening in growth or a clear consensus that the link between activity and inflation has altered materially, it is difficult to imagine that the December projections (and perhaps even those in September) will not show inflation returning to levels consistent with the ECB's target. That could provide the basis for the start of a reduction in ECB accommodation.
In that event, only a modest uptick in core inflation would likely be required to signal a measure of ‘convergence' towards the ECB's inflation goal. Moreover, as the current projections assume the end of the Asset Purchase Programme at the end of this year (as well as current market expectations for slightly firmer market interest rates), even the forecasts may imply that the pick‐up in inflation is self‐sustaining.
Our sense is that a number of arguments can be made for Mr Draghi's relatively dovish tone. Probably the most straightforward is that the ECB is still unsure that inflation will move towards its goal in the next year or so. In this context, the softness of recent inflation readings likely strengthened the position of the ‘doves' on the ECB Governing council.
A subdued inflation outlook together with a still ‘youthful' Euro area economic recovery might imply, as ECB vicepresident Constancio previously indicated, that the ECB might judge that the costs of acting too soon may be greater than the costs of acting too late. This argument also implies a need to prevent market interest rates or the exchange rate of the Euro from rising pre‐emptively and, consequently, emphasises the importance of a dovish tone to ECB pronouncements.
If this reading is correct, it implies there may be more scope for the ECB to move to a somewhat different position over the balance of the year. A wide range of developments have the potential to contribute to a subtle but significant re‐assessment. These include the continuation of robust activity for another quarter, a slight pick‐up in core inflation, various financial stability considerations, a quieter political backdrop and technical constraints on the operation of the Asset Purchase Programme as well as deep divisions on the Governing council as to its appropriateness. Some or all of these might argue a little louder in the second half of 2017 for a clearly smaller degree of monetary accommodation.
By distancing any change in ECB policy, yesterday's pronouncements might be expected to have a calming influence on markets through the summer months. The problem is that the dovish tone from Mr Draghi may be interpreted as signalling what he recently described as ‘an extraordinary amount of monetary policy support' as effectively permanent rather than temporarily extended. In that event, a quiet summer might give way to a stormy autumn.
Technical Outlook: USDJPY – Death Cross Of 10/200 SMA Is Forming And So Far Caps Extended Recovery
Recovery rally from 109.11 (07 June low) extends into third day and pressures strong resistances at 110.40/50 zone (daily Tenkan-sen / 10 / 200SMA which are forming Death Cross / broken Fibo 61.8% 108.11/114.36 rally).
Correction should be ideally capped here to keep intact overall bears for retest of 109.11 and final push towards key short-term support at 108.11 (17 Apr low).
However, fresh strength of the US dollar (dollar index opened with gap-higher on Friday) may push the pair above 110.40/50 pivots for extended correction.
Today's close above these barriers is needed to confirm scenario.
Res: 110.50; 110.95; 111.12; 111.70
Sup: 110.00; 109.71; 109.38; 109.11
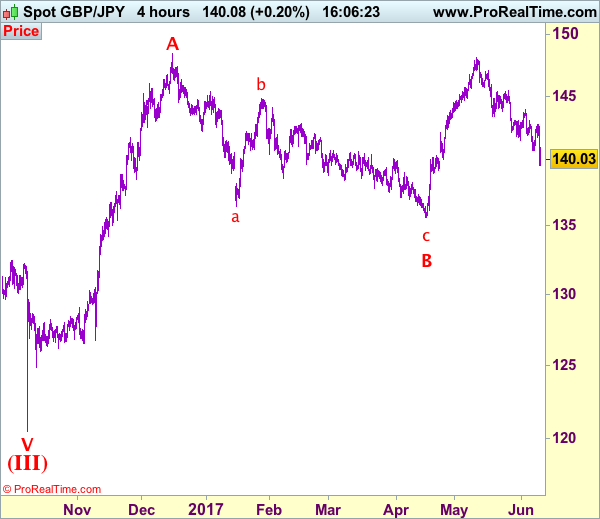
Trade Idea: GBP/USD – Sell at 1.2800
GBP/USD – 1.2732
Recent wave: Wave V of larger degree wave (III) has ended at 1.1986 and major correction has commenced from there for gain to 1.3000 and 1.3140-50
Trend: Near term up
New strategy :
Sell at 1.2800, Target: 1.2600, Stop: 1.2860
Position: -
Target: -
Stop:-
The British pound dropped sharply after UK election results, the breach of previous support at 1.2769 confirms top has been formed at 1.3048 earlier and revives our bearishness for the decline from there to bring retracement of recent upmove, hence further fall to 1.2630-35 and 1.2600 would be seen, however, near term oversold condition should limit downside to 1.2550 and reckon previous support at 1.2515 would hold from here.
Our preferred count on the daily chart is that cable's rebound from 1.3500 (wave (A) trough) is unfolding as a wave (B) with A ended at 1.7043, followed by triangle wave B and wave C as well as wave (B) has ended at 1.7192, the subsequent selloff is the larger degree wave (C) which is still unfolding with minor wave (III) of larger degree wave 3 ended at 1.1986, hence wave (IV) correction is in progress which could either be a triangle wave (IV) of a complex formation but upside should be limited to 1.3500 and price should falter well below 1.4000, bring another decline in wave (V) of 3 for weakness to 1.1500, then 1.1200.
On the upside, expect recovery to be limited to 1.2790-00 and bring another decline. Above 1.2850-60 would defer and suggest low is possibly formed instead, risk a stronger rebound towards 1.2900 but price should falter well below this week’s high at 1.2978 and bring another decline next week.
Trade Idea: GBP/JPY – Sell at 141.30
GBP/JPY - 140.55
Recent wave: Medium term low formed at 120.50 and (A)-(B)-(C) major correction has commenced with (A) leg ended at 148.45, hence wave (B) is unfolding for retreat to 131.00-10.
Trend: Near term up
New strategy :
Sell at 141.30, Target: 139.30, Stop: 141.90
Position: -
Target: -
Stop:-
Sterling met renewed selling interest at 142.75 yesterday and has dropped again on pound’s broad-based weakness after UK election, reviving our bearishness for the decline from 148.10 top to extend further fall to 139.50, then towards previous support at 139.20, however, near term oversold condition should limit downside to 138.75-80 and price should stay above 138.00-10.
In view of this, we are looking to sell sterling again on recovery as upside should be limited to 141.30-40 and bring another decline. Above 141.90-00 would defer and risk rebound to 142.40-50 but said resistance at 142.75 should limit upside and bring another selloff later next week.
Our preferred count is that larger degree wave V with circle is unfolding from 251.12 with wave (I) 219.34, (II): 241.38 and wave (III) is subdivided into 1: 192.60, 2: 215.89 (23 Jul 2008) and wave 3 ended at 118.87 earlier in 2009. The correction from there to 162.60 is wave 4 which itself is a double three and is labeled as first a-b-c ended at 151.53, followed by wave x at 139.03, 2nd a ended at 162.60, 2nd b at 146.75 and 2nd c leg of wave 4 ended at 163.00. Therefore, the decline from 163.00 to 116.85 is now treated as wave 5 which also marked the end of larger degree wave (III), hence wave (IV) major correction has commenced for retracement of the wave (III) from 241.38 and upside target at 183.95-00 (50% Fibonacci retracement of the wave (II) from 241.38) had been met, a drop below 160.00 would suggest wave (IV) has ended at 195.85, bring decline in wave (V) for initial weakness to 130 (already met) and 120.