

Sample Category Title
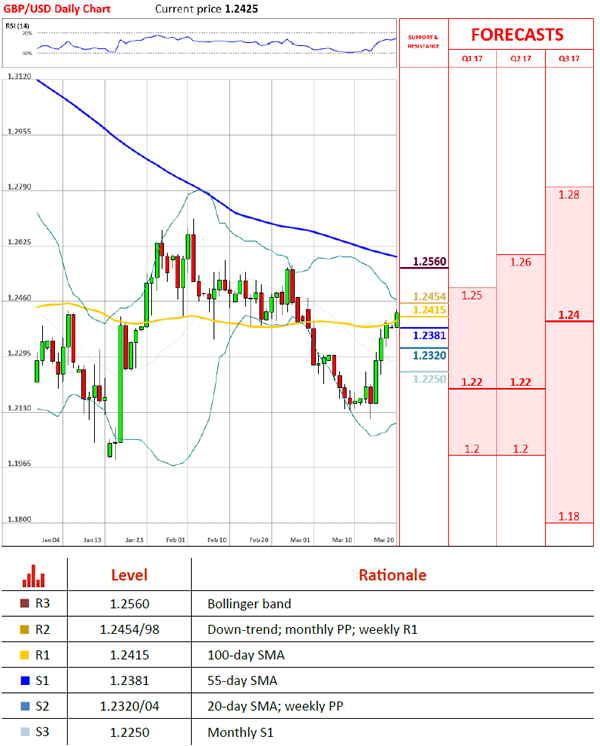
GBP/USD In Limbo Between 55 And 100-Day SMAs
'This [the overnight high] coupled with the strong daily closing suggest further upwards pressure and a daily closing above 1.2370 would indicate that GBP has moved into a bullish phase (with an immediate target of 1.2500).' – UOB Group (based on PoundSterlingLive)
Pair's Outlook
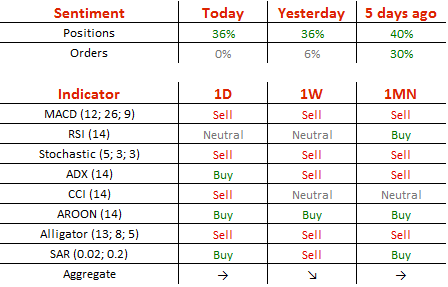
The Cable managed to unexpectedly recover from its intraday low on Friday, ultimately ending trade in the green zone. Moreover, the British Pound was able to breach the immediate resistance, but with gains unable to climb over the 1.24 major level, where psychological resistance was strong. Friday's rally only confirmed the overall outlook, with the GBP/USD pair now being one step closer to reaching its main goal, namely the nine-month down-trend. The final obstacle ahead of this target is the 100-day SMA, which provides resistance circa 1.2415, but technical studies are unable to confirm the possibility of another positive outcome.
Traders' Sentiment
There are still 68% of traders being long the Sterling today, while all pending orders are now equally divided between buy and sell ones.
USD/JPY On The Edge Of Breaking Channel Pattern
'There will likely be a two month hiatus before the next overt signalling on a Fed rate hike, enough of a time lag not to immediately undermine the favourable risk and carry environment.' – Alan Ruskin, Deutsche (based on Business Recorder)
Pair's Outlook
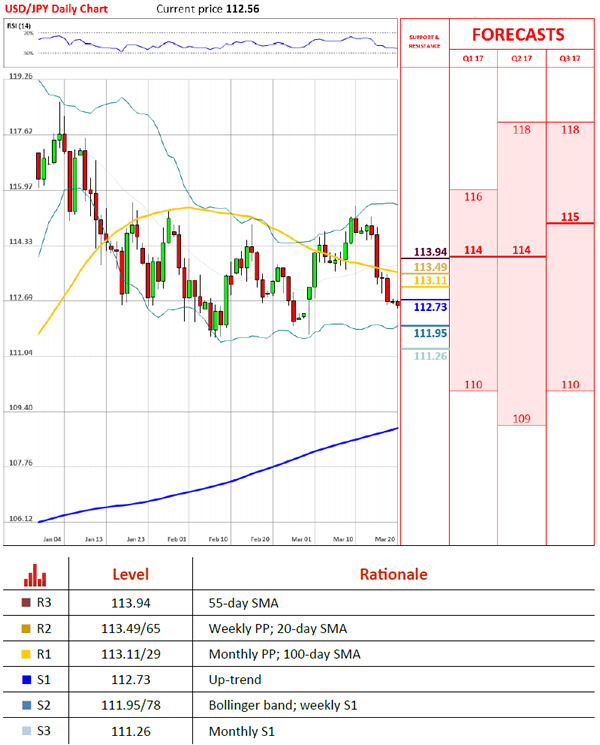
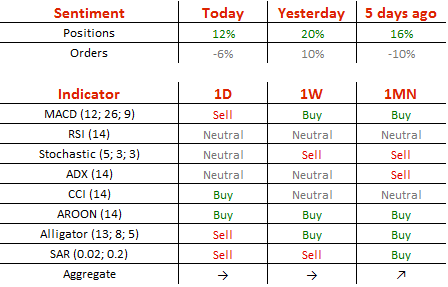
The Greenback suffered another loss on Friday, edging 60 pips lower, thus, providing the ascending channel's lower boundary with an additional confirmation. However, the USD/JPY pair remains under pressure and now risks breaking the pattern to the downside. The plunge could be severe, as the nearest significant area to reverse polarity rests only under 112.00. Even though technical indicators are unable to confirm the possibility of the positive outcome, from the technical perspective this outcome is more likely. The monthly PP and the 100-day SMA form immediate resistance around 113.20.
Traders' Sentiment
Bears retreated over the weekend, as now 56% of all open positions are long (previously 60%). At the same time, the number of orders to sell the US Dollar edged up from 55 to 47%.
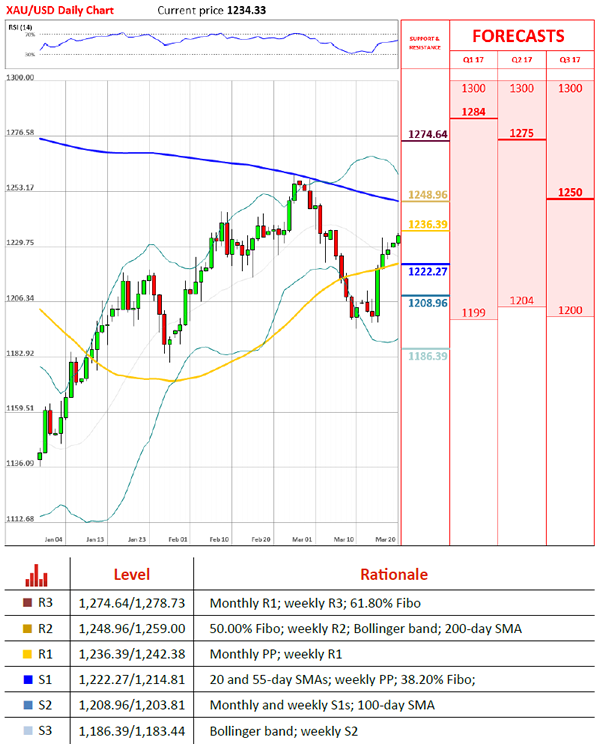
Gold Trades Above 1,230 Level
'Spot gold is expected to test a resistance at $1,237 per ounce, a break above which could lead to a gain to $1,243.' – Wang Tao, Reuters
Pair's Outlook
On Monday morning the yellow metal's price continued its way higher, as the bullion traded above the 1,230 mark. The commodity price is set to face the resistance put up by the monthly PP, which is located at the 1,236.39 level. The pivot point is a lone resistance, and it is highly possible that it will be broken. In that case the metal will be set to face another lone resistance level, as the weekly R1 is located at the 1,242.38 mark. On the other hand the metal might bounce off the monthly level of significance and retreat to the 20-day SMA, which is located at the 1,222.24 level.
Traders' Sentiment
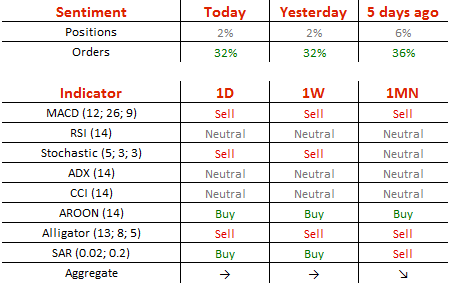
Traders remain neutral bullish, as 51% of open positions are long. Meanwhile, 66% of trader set up orders are to buy the metal.
EUR/USD Candlesticks and Ichimoku Analysis
Weekly
• Last Candlesticks pattern: Shooting star
• Time of formation: 03 May 2016
• Trend bias: Down
Daily
• Last Candlesticks pattern: Shooting star
• Time of formation: 3 May 2016
• Trend bias: Sideways
EUR/USD – 1.0765
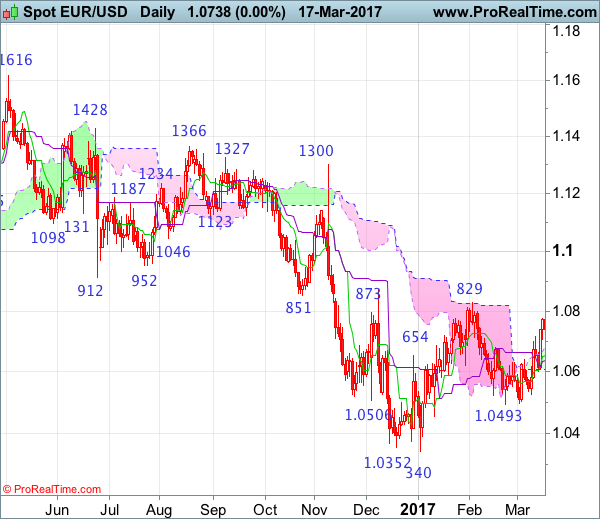
The single currency found renewed buying interest at 1.0600 last week and has rallied again in line with our bullish expectation, our long position entered at 1.0580 met our upside target at 1.0780 with 200 points profit as price rose to as high as 1.0782, this anticipated rise adds credence to our bullish view that the fall from 1.0829 has ended at 1.0493 earlier and upside bias remains for further gain to 1.0790-00 but break of said resistance at 1.0829 is needed to confirm early erratic rise from 1.0340 low for further subsequent gain to 1.0890-00 and possibly 1.0930-35 (61.8% Fibonacci retracement of 1.1300-1.0340) which is likely to hold on first testing.
On the downside, whilst initial pullback to 1.0680-90 cannot be ruled out, as long as support at 1.0600 holds, mild upside bias remains for further gain to indicated upside targets. A drop below said support at 1.0600 would abort and signal the rebound from 1.0493 has ended instead, bring further fall to 1.0550 and possibly 1.0525 but said support at 1.0493 should remain intact. Only a drop below support at 1.0493 would signal shift risk back to downside and extend far to 1.0454 support, a sustained breach below there is needed to confirm the rebound from 1.0340 (Jan low) has ended, bring further fall to 1.0400 and later retest of said support which is likely to hold from here.
Recommendation: Long entered at 1.0580 met target at 1.0780 with 200 points profit and would buy again at 1.0690 for 1.0890 with stop below 1.0590.
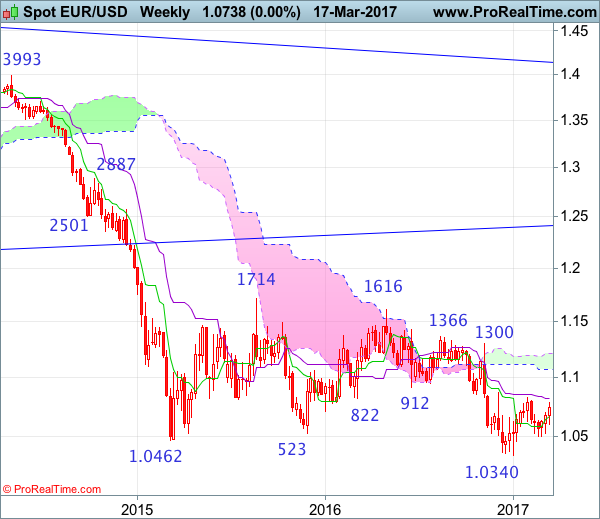
On the weekly chart, euro found good support at 1.0525 last week and has rebounded again, a white candlestick with a relatively long lower shadow was formed, retaining our bullish view that further consolidation above 1.0493 would be seen and mild upside bias remains for another bounce to 1.0770-80, however, only a break of resistance at 1.0829 would suggest another leg of rise from 1.0340 low is underway, bring retracement of early decline to previous resistance at 1.0873 and later 1.0930-35 (61.8% Fibonacci retracement of 1.1300-1.0340) but reckon 1.1000 would limit upside and price should falter below 1.1050-60.
On the downside, although pullback to 1.0690-00 is likely, reckon 1.0600 would hold and bring another rebound. Below said support at 1.0600 would suggest the rebound from 1.0493 has ended, risk weakness to 1.0525 support but break there is needed to risk retest of said support at 1.0493-96, a drop below 1.0493-96 would extend the retreat from 1.0829 towards key support at 1.0454, however, only a sustained breach below this level would signal the rebound from 1.0340 has ended, then further fall to 1.0390-00 and later retest of this January low would follow.
GBPUSD Penetrated Daily Cloud, Strong Bullish Signal On Break Higher
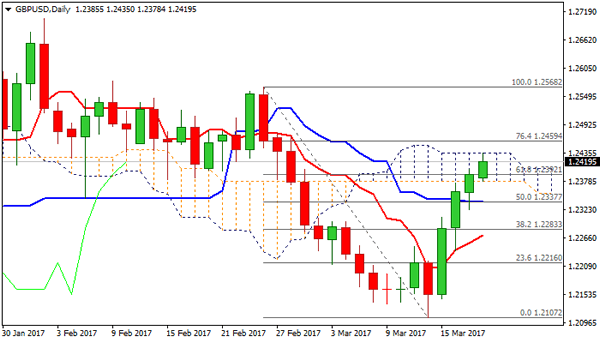
Cable closed in the daily cloud on Friday, ending strong 1.2100/1.2400 rally last week. The pair was up 1.85% for the week, driven mainly by weaker dollar and broke some important technical barriers that further accelerated the rally.
Fresh upside extension in early Monday trading, took out 100 SMA barrier at 1.2407 and is pressuring daily cloud top at 1.2435, which is the highest traded in the session so far.
Firm break above the cloud is expected to generate strong bullish signal for extension of bull-leg from 1.2107 (14 Mar low) towards targets at 1.2470 zone, with attack at psychological 1.2500 barrier not ruled out.
Daily MA's turned into bullish setup and support scenario, however, corrective dips could be expected meantime on strongly overbought slow stochastic.
Daily cloud base, reinforced by 55SMA offers solid support at 1.2379, with extend downticks required to stay above broken 20 SMA at 1.2316.
Sustained break below the latter would generate reversal signal.
Res: 1.2435, 1.2459, 1.2476, 1.2500
Sup: 1.2409, 1.2379, 1.2337, 1.2316
USD/JPY Candlesticks and Ichimoku Analysis
Weekly
• Last Candlesticks pattern: Hanging man
• Time of formation: 22 May 2016
• Trend bias: Down
Daily
• Last Candlesticks pattern: Shooting star
• Time of formation: 15 Feb 2017
• Trend bias: Down
USD/JPY – 112.77
Last week’s selloff dampened our previous bullishness and suggests the corrective bounce from 111.59 has possibly ended at 115.51 earlier this month, hence consolidation with mild downside bias is seen for further weakness to 112.00-10 would be seen, however, break of indicated support at 111.59-69 is needed to confirm early decline has finally resumed and extend fall to 111.00 but near term oversold condition should limit downside to 110.50 and reckon downside would be limited to 110.00, risk from there is seen for a rebound to take place later.
On the upside, whilst initial recovery to 113.00 cannot be ruled out, reckon upside would be limited to resistance at 113.54, bring another decline later. Only break of previous support at 114.48 would abort and signal low is formed, instead and prolong choppy trading, risk rebound d to 114.90-00 but price should falter well below said resistance at 115.51, bring retreat later. Only a break of said resistance at 115.51 would revive near term bullishness and signal the erratic rise from 111.59 is still in progress for further gain to 116.00, then 116.85-90.
Recommendation : Turn short at 113.50 for 111.50 with stop above 114.50.
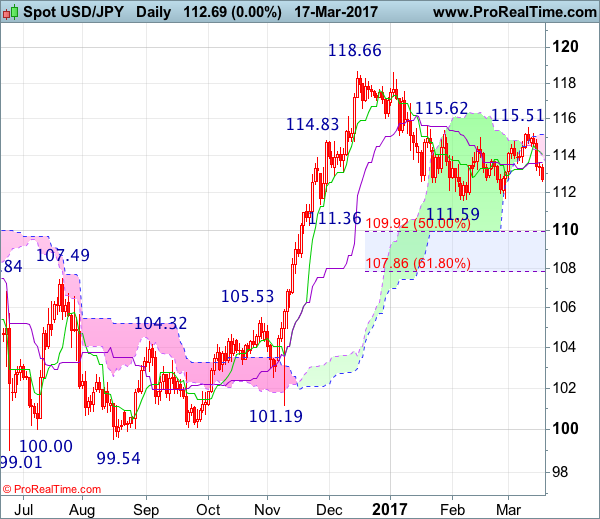
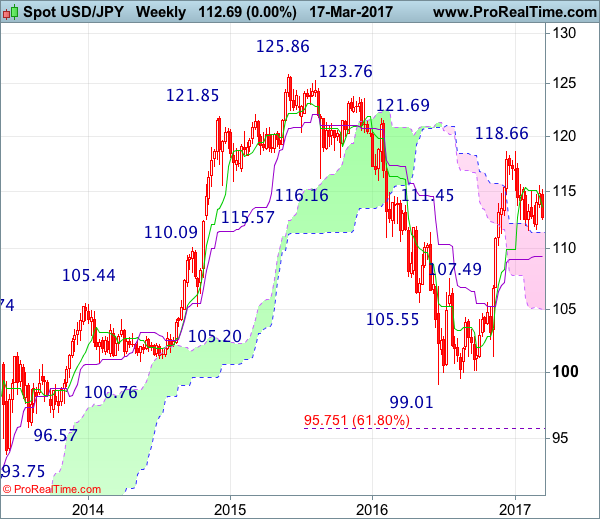
On the weekly chart, last week’s retreat formed a black candlestick and suggests the rebound from 111.59 has possibly ended at 115.51, hence consolidation with downside bias is seen for further fall to 112.00, however, break of indicated support at 111.59-69 is needed to signal the fall from 118.66 top is still in progress for retracement of early upmove to support at 111.36, then towards 110.90-95 (50% Fibonacci retracement of 101.19-118.66) but reckon downside would be limited to 110.00 and the Kijun-Sen (now at 109.38) should hold, bring another rebound later.
On the upside, whilst recovery to 113.00 and possibly the Tenkan-Sen (now at 113.55) cannot be ruled out, reckon 114.48 (previous support) would hold and bring another decline later. Above there would bring rebound to 115.20 but only break of 115.51-62 resistance would revive bullishness and extend the rebound from 111.59 to 116.40-50, break there would signal the pullback from 118.66 has ended at 111.59, bring subsequent rise to 116.87.
Oil Settles Into A Range For Now
Despite an early sell-off in Asia trading, crude has rallied to rest almost unchanged on the day.
All said crude has held up reasonably well as the week starts, following Friday's Baker Hughs Rig Count showing shale had added another 14 rigs and U.S. oil production was topping 9.1 million barrels a day (bpd). That is an increase of 600,000 bpd since the mid-year and certainly, puts a hole in OPEC/NOPEC's attempts to chop 1.8 million barrels per day. Interestingly, much of the talk of impending doom on the supply front later in the year seems to have quietened down pretty suddenly as well as the crunch date gets put back by commentators.
If this sort of information had come out at the start of last week, I can only imagine what the reaction would have been. More adrenalin to the panic selling I would imagine. As it is, although Asia had an initial selloff of about 0.5% this morning; we move into European trading almost unchanged. So both Brent and WTI seem to be settling calmly into a new trading range which is a surprise in itself given the histrionics last week. I think a couple of dynamics are at work here.
Firstly we have now passed the predicted FOMC Fed Funds rate hike. That seems to have been so well telegraphed, that the actual event was a bit of a non-event. Will still no concretely policies from the Trump administration's 100 days of inaction, USD bulls have taken some risk of the table with the big dollar soft against most currencies and commodities, and U.S. yields a bit lower. This has also been supportive of oil.
Secondly, the CME Commitment of Traders (COT)report released over the weekend which encompasses positioning in the CME futures up until last Tuesday, showed a massive 23% drop in speculative long positioning in the WTI contracts. Overall, at net long 288,774 contracts, this is also far below the record longs of 413,637 seen earlier year on year. So in a nutshell, a lot of speculative longs have cut their positions.
A couple of caveats here, firstly the COT report does not encompass Wednesday's FOMC meeting or the rest of the week. Secondly, given that WTI (and Brent) rallied before selling off again post FOMC, we don't know just how much the “herd” has been thinned. We will have to wait until next Monday morning for that. Although the report is backward looking, it does provide a fascinating and useful insight into market positioning. My take is that given both Brent and WTI had choppy price action within a largish range, the fact that we have come nowhere near retesting the lows implies that the herd further thinned itself over the course of the week.
Before oil bulls get all excited again, it is important to note that the markets seem to have fallen into a lethargic range pattern. Traders would be far better off concentrating on this in the short term before the API and EIA crude inventory numbers come out later this week. We also have either Fed. Governors are speaking including the Chair, Ms. Yellen this week. So trading becomes a business of watching the short term levels, while keeping an eye on the major levels for an indication of multi-day moves.
Turning to the short term charts.
Spot Brent Crude
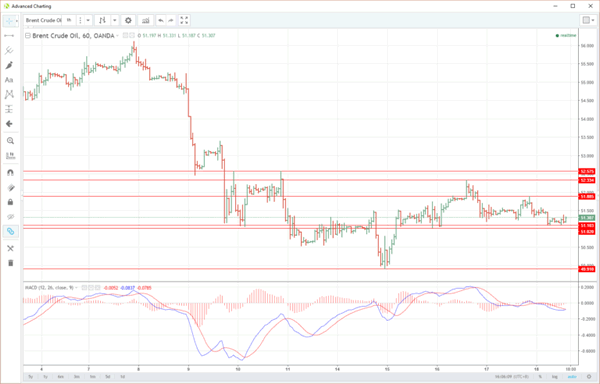
The hourly chart support just below current levels at $51.10 and $51.00. Short term resistance lies at $51.90 and then $52.35.
Major support is at the $49.90/$50.00 level, last week's low. Major resistance is at $52.575, last week's high.
The hourly MACD gives no real clues at these levels supporting the near time range trade argument.
Brent Hourly
Spot West Texas Intermediate
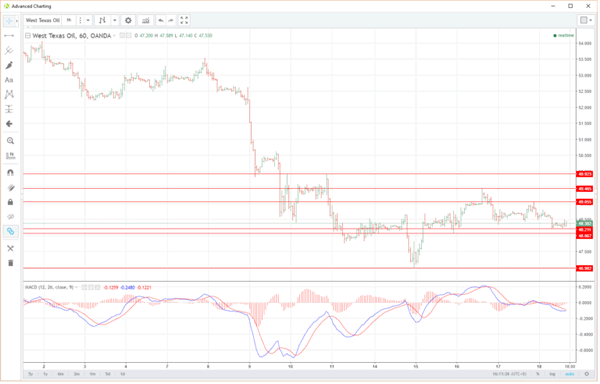
Short term support rests again, just below current levels at $48.20 and $48.05 areas.
Short term resistance lies at $49.05 and $49.45 areas.
Major support is at the $47.00 area and the major resistance at the $49.90/$50.00 area. Respectively last weeks low and high.
Summary
Both crude's look set for a period of ranging consolidation in the short term. Traders should play this of the short-term levels. However, this is unlikely to last with speculative long positioning almost certainly whittled down massively. Therefore it is important to keep an eye on the “big picture” levels for clues to the next move.
Trade Idea : USD/CHF – Sell at 1.0020
USD/CHF - 0.9978
Most recent candlesticks pattern : N/A
Trend : Near term down
Tenkan-Sen level : 0.9968
Kijun-Sen level : 0.9965
Ichimoku cloud top : 1.0025
Ichimoku cloud bottom : 0.9974
Original strategy :
Sell at 1.0020, Target: 0.9920, Stop: 1.0055
Position : -
Target : -
Stop : -
New strategy :
Sell at 1.0020, Target: 0.9920, Stop: 1.0055
Position : -
Target : -
Stop : -
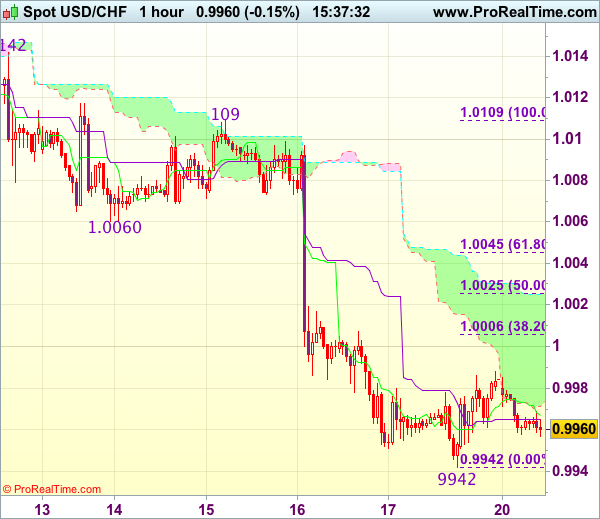
As the greenback has rebounded after finding support at 0.9942 on Friday, suggesting consolidation above this level would be seen and corrective bounce to 1.0005-10 (38.2% Fibonacci retracement of 1.0109-0.9942) cannot be ruled out, however, reckon upside would be limited to 1.0025 (50% Fibonacci retracement) and bring another decline later. Below said support at 0.9942 would extend recent decline from 1.0171 to 0.9920-25 but loss of near term downward momentum should prevent sharp fall below 0.9900 and reckon 0.9870-75 would hold from here.
In view of this, would not chase this fall here and would be prudent to sell dollar on recovery as 1.0025 (current level of the upper Kumo) should limit upside and bring another decline. Only above previous support at 1.0060 (now resistance) would abort and signal low is formed instead, risk rebound to 1.0090-95 first.
Trade Idea : GBP/USD – Buy at 1.2325
GBP/USD - 1.2414
Most recent candlesticks pattern : N/A
Trend : Near term up
Tenkan-Sen level : 1.2408
Kijun-Sen level : 1.2380
Ichimoku cloud top : 1.2334
Ichimoku cloud bottom : 1.2266
Original strategy :
Buy at 1.2290, Target: 1.2400, Stop: 1.2255
Position : -
Target : -
Stop : -
New strategy :
Buy at 1.2325, Target: 1.2445, Stop: 1.2290
Position : -
Target : -
Stop : -
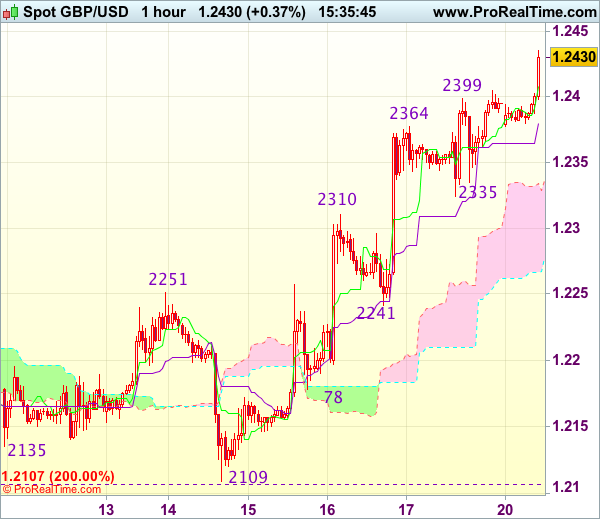
As cable has risen again after finding renewed buying interest at 1.2335, suggesting recent upmove from 1.2109 (this month’s low) is still in progress and may extend further gain to 1.2445-50, however, loss of near term momentum should prevent sharp move beyond previous resistance at 1.2479, risk from there has increased for a retreat to take place later.
In view of this, would not chase this move from here and we are looking to buy cable on pullback as said support at 1.2335 should limit downside and bring another rise. Below previous resistance at 1.2310 would defer and suggest top is possibly formed, risk correction to 1.2265-70 but price should stay above indicated support at 1.2241.
Dollar Still Looking For A Post-Fed Bottom
Sunrise Market Commentary
- Rates: More sideways trading?
Core bonds gained some ground on Friday and traded slightly higher in Asia, but in absence of Japanese traders (holiday). So, a slightly risk-off sentiment may dominate at the start of European trading. However, with the eco and event calendar nearly empty, we bet on a sideways oriented session maybe with a slight upward bias. - Currencies: Dollar still looking for a post-Fed bottom
On Friday, US consumer confidence was ok, but failed to change fortunes for the dollar. This morning, sentiment is slightly risk-off as the G-20 didn't repeated its intention to avoid all kinds of protectionism. The risk-off sentiment might continue to weigh somewhat on core yields. In context, the dollar might remain in the defensive.
The Sunrise Headlines
- US equities closed Friday's session flat to marginally lower in dull, be it volatile, trading. Asian equities trade slower to mixed on disappointment about the G-20 inability to restate their rejection of all forms of protectionism.
- Chinese housing prices defied restrictions designed to cool the nation's property market. The cost of new homes gained in 56 of 70 urban areas last month, compared with 45 in January
- The G-20 couldn't say more about trade in its statement than that it will “work to strengthen the contribution of trade”. According to participants, US Mnuchin didn't have a mandate to negotiate new or creative wordings on trade policy.
- Moody's cut the outlook on Turkey's Ba1 rating to negative, citing persistent political uncertainty after last July's failed coup. S&P raised Iceland's rating to A from A- and increased the Russian outlook on its BB+ rating to positive.
- S&P kept Portugal's BB+ rating, stable outlook unchanged. A fragile banking system and high private/public debt are of concern, but the fiscal situation and growth improves. Only DBRS gives the country still an investment grade.
- Trump followed his awkward meeting with Merkel by slamming Germany on Twitter. "Germany owes vast sums of money to NATO & the US must be paid more for the powerful, and very expensive, defence it provides to Germany!"
- The eco calendar is virtual empty today. Only highlights are an Eurogroup meeting on amongst others Greece and speeches from ECB Weidmann and Chicago Fed Evans. Belgium holds an regular OLO auction
Currencies: Dollar Still Looking For A Post-Fed Bottom
USD correction continues
On Friday, US eco data, including the Michigan consumer confidence were OK, but not strong enough to change USD sentiment for the better. Interest rate differentials were still marginally supportive for the euro. Post-Fed USD softness persisted. EUR/USD finished the session at 1.0738 from 1.0766 on Thursday. USD/JPY closed at 112.70 (from 113.31).
Overnight, Asian equities are trading with a slight risk-off bias. This is due to the G20 disappointment. The communiqué doesn't say anymore that the G-20 will intend to avoid all forms of protectionism, mirroring the US shift to more protectionism. Japanese markets are closed today. Even so, USD/JPY remains under pressure from ongoing overall USD weakness. USD/JPY trades around 112.60, near the lowest level this month. EUR/USD is trading around 1.0765. So, the post-Fed top (1.0782) remains also within reach. After a pause in the second half of last week, the oil price is again under pressure as supply concerns remain present.
Today, the eco calendar is completely empty. Regarding events, the Eurogroup meets on Greece, pension systems, the budgetary plans and the implementation of the Stability and Growth path. On Friday, Greece FM Tsakalotos said he expected to reach a deal by April 7 Eurogroup meeting. The problem is complicated though by signals the US is critical about IMF participation. ECB Weidmann speaks, as does Chicago Fed Evans. Last week, USD yields and the dollar drifted south even as the Fed hiked its rates. At the same time, the euro was well bid as markets pondered the chances of an early change in the ECB policy after hawkish comments from ECB's Nowotny. In a longer term perspective, policy divergence between the Fed and the ECB will probably remain big enough to support further USD gains. Yellen suggested that, considering the eco developments, the Fed policy might be relatively close to the ‘dot-path'. The day-to-day USD momentum remains soft though. A cautious riskoff sentiment and a further decline of oil might keep the dollar on the defensive short-term as there are no important US eco data/events to turn momentum in favour of the dollar. So, short-term are in no hurry to the jump in to add to USD long exposure. We wait for strong enough US data that might put a floor on the current USD correction
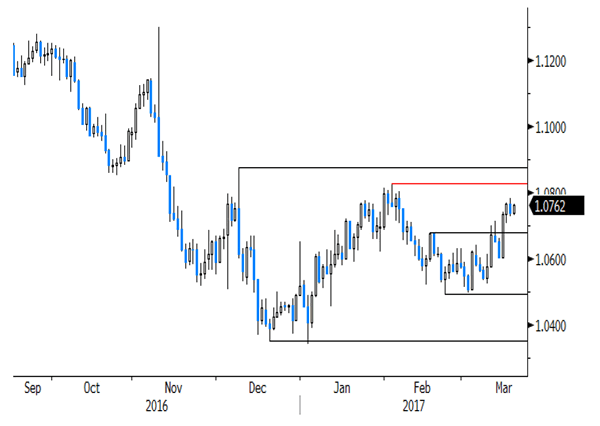
Global context. EUR/USD 1.0874 resistance remains the line in the sand with intermediate resistance at 1.0829. We maintain the view that a sustained break of EUR/USD above this area will be difficult. The US/German (EMU) interest rate differential remains at an absolute high level. Especially at the short end of the curve, the differential might even re-widen. The fundamentals/ interest rate differentials are also supportive for USD/JPY, but of late the momentum/technical picture is not really convincing. We maintain the working hypothesis that the 111.60 range bottom should hold.
EUR/USD holding near ST top as dollar softness persists
EUR/GBP
Political uncertainty to cap GBP rebound?
On Friday, there were no eco data in the UK. Trading in sterling was order-driven and technical in nature. Cable showed some erratic swings in the mid/high 1.23 big figure . The pair closed the session at 1.2396, near the intraday high. The rise in cable was at least partially due to USD softness. EUR/GBP reversed Tuesday's late session rebound (Nowotny). So, from this point of view, sterling still maintained a cautious bid in the wake of Thursday's (more hawkish) BoE policy statement. EUR/GBP finished the session at 0.8663 (from 0.8733 on Thursday).
Overnight, the Rightmove House price measure rose 1.3% M/M to be up 2.3% Y/Y. However, the improvement doesn't help sterling. During the weekend, the debate on a Scottish independence referendum continues. A clash between London and Edinburgh highlights the higher number of institutional issues that could complicate the Brexit procedure. Sterling is reversing a (small) part of Friday's rebound this morning. The cautious risk-off sentiment mighty also be a slightly negative for sterling. There are no other important UK eco data today. So, political headlines (Scotland/Brexit) will remain in focus. At the end of last week, both sterling and the euro were in good shape. Some EUR/GBP consolidation might be on the cards. Despite Thursday's somewhat more hawkish BoE approach, we don't see a real risk for BOE tightening anytime soon. So, any rebound of sterling shouldn't go too far.
Last week, the sterling decline took a breather. Some time ago, EUR/GBP cleared the 0.8592 resistance, improving the MT technical EUR/GBP picture. We don't expect a sustained EUR/USD rebound, but a combination of temporary euro consolidation and ongoing sterling softness as the Brexit negotiations are nearing, might trigger some more ST EUR/GBP gains. The 0.8854 correction top is the next key resistance. The nervous swings over the previous days suggest that a clear break beyond 0.8854 will be difficult without important (UK negative) news.
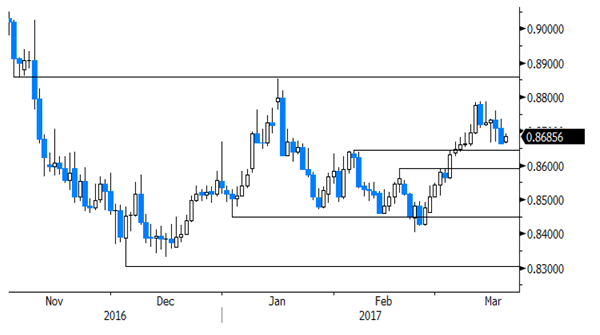
EUR/GBP: post-BoE sterling rebound to slow as political uncertainty grows?