
Sample Category Title
AUD/USD: Aussie Trading On A Stronger Footing In The Morning Session
For the 24 hours to 23:00 GMT, the AUD rose 0.39% against the USD and closed at 0.7699 on Friday.
LME Copper prices declined 0.4% or $22.0/MT to $5889.0/MT. Aluminium prices rose 0.3% or $6.0/MT to $1901.0/MT.
In the Asian session, at GMT0400, the pair is trading at 0.7717, with the AUD trading 0.23% higher against the USD from Friday’s close.
The pair is expected to find support at 0.7678, and a fall through could take it to the next support level of 0.7639. The pair is expected to find its first resistance at 0.7740, and a rise through could take it to the next resistance level of 0.7763.
Going ahead, investors will keep a close watch on Australia’s CB leading indicator for January, scheduled to release later today.
The currency pair is trading above its 20 Hr and 50 Hr moving averages.

EUR/USD: Euro-Zone’s Trade Surplus Shrunk In January, Construction Output Dropped Further In The Same Month
For the 24 hours to 23:00 GMT, the EUR declined 0.28% against the USD and closed at 1.0741 on Friday.
On the macro front, the Euro-zone's seasonally adjusted trade surplus narrowed more-than-expected to a level of €15.7 billion in January, compared to market expectations for the nation's trade surplus to narrow to a level of €22.0 and following a revised surplus of €23.1 billion in the prior month. Moreover, the nation's seasonally adjusted construction output fell 2.3% MoM in January. In the previous month, construction output had registered a revised drop of 0.6%.
Meanwhile, the European Central Bank (ECB) policymaker, Ewald Nowotny, stated that the ECB will decide later whether to raise interest rates before or after ending its bond purchase programme, thus hinting that an interest rate hike could be on the cards by year end.
Macroeconomic data revealed that the US flash Reuters/Michigan consumer sentiment index climbed more-than-anticipated to a level of 97.6 in March, compared to a reading of 96.3 in the previous month, while market participants anticipated for a rise to a level of 97.0. Further, the nation's leading indicator surged to its highest level in more than a decade, after it increased more-than-expected by 0.6% in February, compared to a similar rise in the previous month. Additionally, the nation's manufacturing production registered a rise of 0.5% in February, meeting market expectations and advancing for the sixth consecutive month, suggesting that recovery in the manufacturing sector was gathering speed as rising commodity prices boost demand for machinery and other equipment. In the prior month, manufacturing production had registered a revised similar rise.
Meanwhile, the nation's industrial production remained flat in February, confounding investor consensus for a rebound of 0.2%, as unseasonably warm weather again dragged down utilities. In the prior month, industrial production had registered a revised drop of 0.1%.
In the Asian session, at GMT0400, the pair is trading at 1.0759, with the EUR trading 0.17% higher against the USD from Friday's close.
The pair is expected to find support at 1.0729, and a fall through could take it to the next support level of 1.0700. The pair is expected to find its first resistance at 1.0785, and a rise through could take it to the next resistance level of 1.0812.
Moving ahead, investors will look forward to Germany's producer price index for February, slated to release in a few hours. Moreover, the US Chicago Fed national activity index for February, will also be closely watched by market participants.
The currency pair is trading above its 20 Hr and 50 Hr moving averages.

GBP/USD: UK’s Rightmove House Prices Advanced In March
For the 24 hours to 23:00 GMT, the GBP rose 0.28% against the USD and closed at 1.2388 on Friday.
In the Asian session, at GMT0400, the pair is trading at 1.2384, with the GBP trading marginally lower against the USD from Friday's close.
Overnight data indicated that UK's Rightmove house price index rose 1.3% on a monthly basis in March, following a gain of 2.0% in the previous month.
The pair is expected to find support at 1.2335, and a fall through could take it to the next support level of 1.2287. The pair is expected to find its first resistance at 1.2418, and a rise through could take it to the next resistance level of 1.2453.
With no economic releases in Britain today, traders await UK's inflation figures for February, slated to release tomorrow.
The currency pair is showing convergence with its 20 Hr moving average and trading above its 50 Hr moving average.

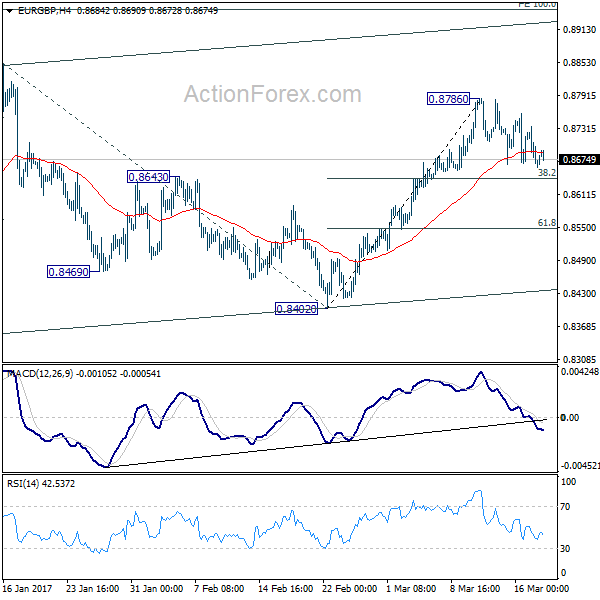
EUR/GBP Daily Outlook
Daily Pivots: (S1) 0.8635; (P) 0.8686; (R1) 0.8712; More...
Intraday bias in EUR/GBP remains neutral as consolidation from 0.8786 continues. Deeper fall might be seen but we'd expect support from 38.2% retracement of 0.8402 to 0.8786 at 0.8639 to contain downside. Break of 0.8786 will target 0.8851 resistance and above. Price actions from 0.8303 are seen as the second leg of the corrective pattern from 0.9304. Hence, we'd expect strong resistance from 100% projection of 0.8303 to 0.8851 from 0.8402 at 0.8950 to limit upside. On the downside, sustained trading below 0.8693 will bring deeper fall to 61.8% retracement 0.8549 and below.
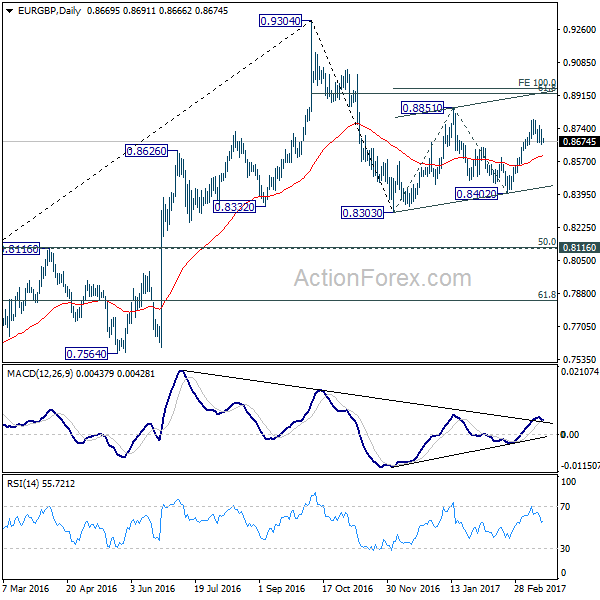
In the bigger picture, price actions from 0.9304 are viewed as a medium term corrective pattern. Deeper fall cannot be ruled out yet. But we'd expect strong support from 0.8116 cluster support (50% retracement of 0.6935 to 0.9304 at 0.8120) to contain downside. Overall, the corrective pattern would take some time to complete before long term up trend resumes at a later stage. Break of 0.9304 will pave the way to 0.9799 (2008 high).
USD/JPY: Japanese Yen Trading Higher In The Morning Session
For the 24 hours to 23:00 GMT, the USD declined 0.59% against the JPY and closed at 112.65 on Friday.
In the Asian session, at GMT0400, the pair is trading at 112.53, with the USD trading 0.11% lower against the JPY from Friday’s close.
The pair is expected to find support at 112.17, and a fall through could take it to the next support level of 111.80. The pair is expected to find its first resistance at 113.18, and a rise through could take it to the next resistance level of 113.82.
On account of a holiday observed in Japan today, trading trend in the JPY is expected to be determined by global macroeconomic factors.
The currency pair is trading below its 20 Hr and 50 Hr moving averages.

USD/CHF: Swiss Franc Reverses Its Losses In The Asian Session
For the 24 hours to 23:00 GMT, the USD rose 0.21% against the CHF and closed at 0.9978 on Friday.
In the Asian session, at GMT0400, the pair is trading at 0.9960, with the USD trading 0.18% lower against the CHF from Friday’s close.
The pair is expected to find support at 0.9936, and a fall through could take it to the next support level of 0.9913. The pair is expected to find its first resistance at 0.9985, and a rise through could take it to the next resistance level of 1.0011.
The currency pair is showing convergence with its 20 Hr and 50 Hr moving averages.

USD/CAD: Loonie Trading Higher In The Asian Session
For the 24 hours to 23:00 GMT, the USD rose 0.11% against the CAD and closed at 1.3336 on Friday.
In economic news, Canada’s manufacturing shipments unexpectedly climbed 0.6% MoM in January, compared to a revised rise of 2.1% in the previous month. Markets were anticipating manufacturing shipments to drop 0.3%.
In the Asian session, at GMT0400, the pair is trading at 1.3323, with the USD trading 0.1% lower against the CAD from Friday’s close.
The pair is expected to find support at 1.3291, and a fall through could take it to the next support level of 1.3259. The pair is expected to find its first resistance at 1.3366, and a rise through could take it to the next resistance level of 1.3409.
The currency pair is showing convergence with its 20 Hr moving average and trading above its 50 Hr moving average.

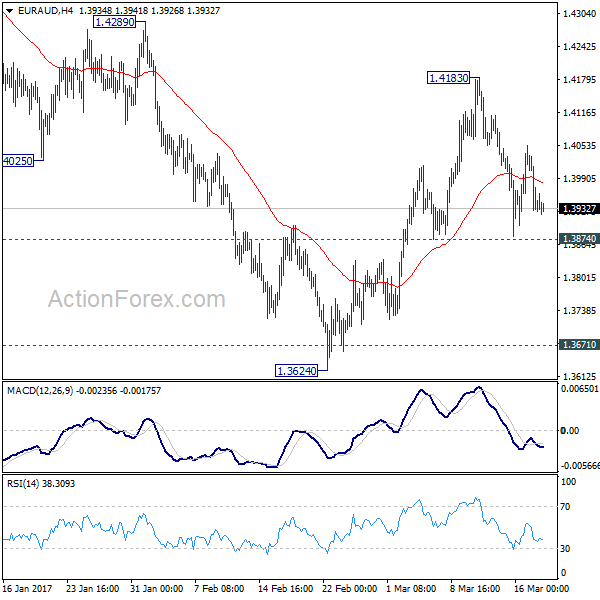
EUR/AUD Daily Outlook
Daily Pivots: (S1) 1.3883; (P) 1.3968; (R1) 1.4012; More...
Intraday bias in EUR/AUD remains neutral at this point. Outlook is unchanged and we're still slightly favoring the case of trend reversal after defending key support level at 1.3671, on bullish convergence condition in daily MACD. On the upside, above 1.4183 will turn bias to the upside for 1.4289 resistance next. Break will affirm our view and target next key resistance level at 1.4721. However, break of 1.3874 minor support will invalidate our view and turn bias back to the downside for retesting 1.3624 low.
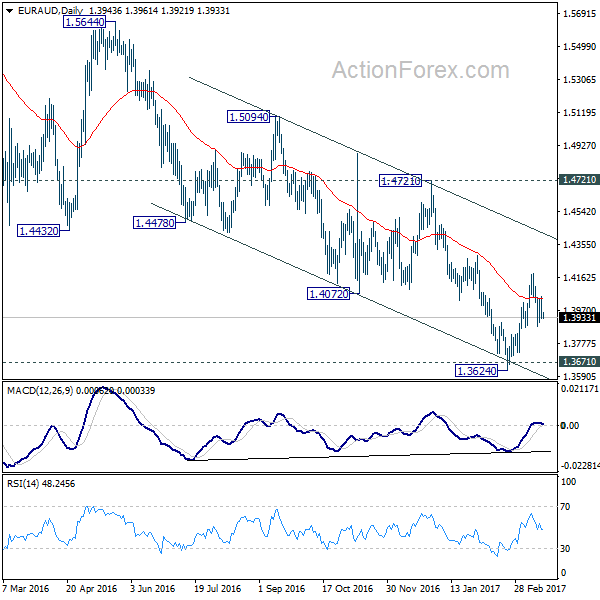
In the bigger picture, price actions from 1.6587 medium term top are viewed as a corrective pattern. We'd expect strong support from 1.3671 key level to contain downside and bring rebound. Up trend from 1.1602 should not be finished and will resume later. Break of 1.4721 resistance will indicate completion of such correction and turn outlook bullish for retesting 1.6587 high. However, sustained break of 1.3671 will invalidate our bullish view and would turn focus back to 1.1602 long term bottom.
EUR/CHF Daily Outlook
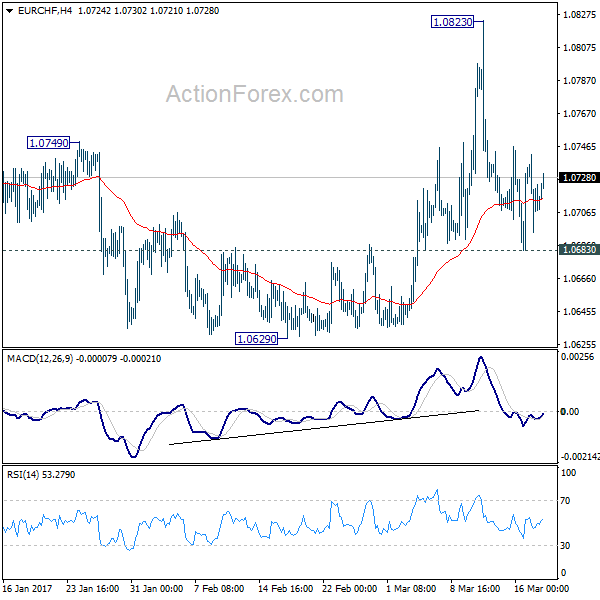
Daily Pivots: (S1) 1.0694; (P) 1.0718; (R1) 1.0742; More...
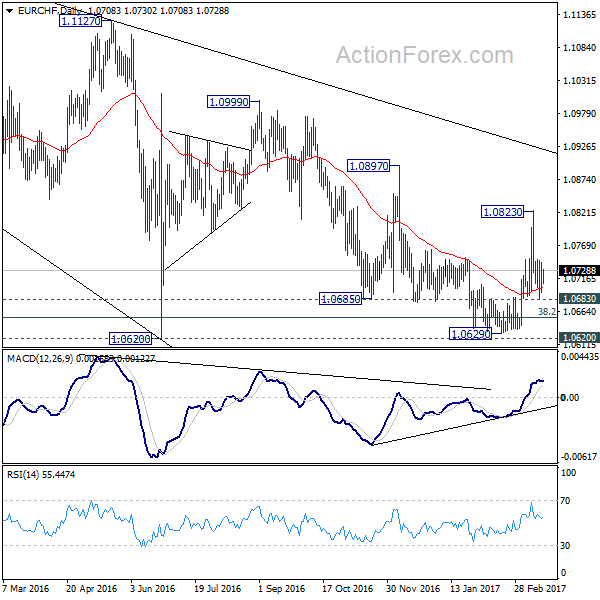
Intraday bias in EUR/CHF remains neutral for the moment. Prior rejection from 55 week EMA mixed up near term outlook. But still, on the upside, break of 1.0823 resistance will re-affirm the case of trend reversal. And intraday bias will be turned back tot he upside for 1.0897 resistance for confirmation. However, break of 1.0683 minor support will turn bias to the downside for 1.0620 key support level again.
In the bigger picture, the decline from 1.1198 is seen as a corrective move. Decisive break of 1.0897 resistance should confirm that it's completed. And in that case, larger up trend is resuming for another high above 1.1198. Meanwhile, sustained trading below 38.2% retracement of 0.9771 to 1.1198 at 1.0653 will target 50% retracement at 1.0485.
USDJPY Likely To Remain Bearish In The Week Ahead
Key Points:
- Dollar bulls largely disappointed by FOMC meeting.
- RSI Oscillator still has room to move on the downside.
- Continued depreciation likely but watch for a Dollar rebound in the near term.
The USD/JPY had a relatively torrid week as the pair was beset by a negative greenback sentiment swing following the FOMC decision. The central bank’s lack of hawkish guidance was the main culprit and this sent the pair sharply lower to close the week over 200 pips lower at 112.69. However, it remains to be seen how the pair will cope in the coming week as the veritable bevy of FOMC pundits hit the wires to shape the markets expectations.
Last week was highly negative for the USDJPY as the pair fell sharply as the U.S. Fed’s decision on interest rates hit the wires. Although the central bank followed through on the expectation of rate hikes, and raised the FFR 25bps to 1.00%, they failed to signal the start of the expected cycle of tightening. Subsequently, Dollar bulls were caught short footed and the appetite for the greenback immediately leaked out of the market. Subsequently, the USDJPY slipped over 200 pips to close the week well down at 112.69. The Fed decision also largely overshadowed a relatively poor JPY Core Machinery Orders result which fell into contraction at -3.2% m/m.
The week ahead is likely to focus sharply on a range of speeches that are due out from the U.S. Federal Reserve, with the market’s interest largely falling on what Janet Yellen has to say. Given the turmoil that the greenback has seen over the past few days, it’s all but assured that the Fed’s PR machine will be out in force to stabilise market expectations. Subsequently, expect to see plenty of volatility as the Fed moves into `Jaw Boning’ mode. On the Japanese side, the Trade Balance figures are also due out early in the week but are unlikely to provide much in the way of movement for the pair.
From a technical perspective, price action’s recent dip below the 100 day MA appears to be beckoning in a move to the short side. In addition, the RSI Oscillator is trending sharply lower and still remains firmly wedged within neutral territory suggesting that there is still room to move. Subsequently, our initial bias is bearish for the week ahead with the caveat to watch for a rebound around the 111.61 mark. Support is currently in place for the pair at 112.55, 111.61, and 110.61. Resistance exists on the upside at 113.74, 114.75, and 115.50.
Ultimately, the pair retains its bearish predilection and it will take a significant boost from all of the FOMC member speeches due out in the next week to stem the tide. However, note that the greenback is unlikely to stay depressed for long, so be prepared for a rebound at some stage lest you get caught out.