
Sample Category Title
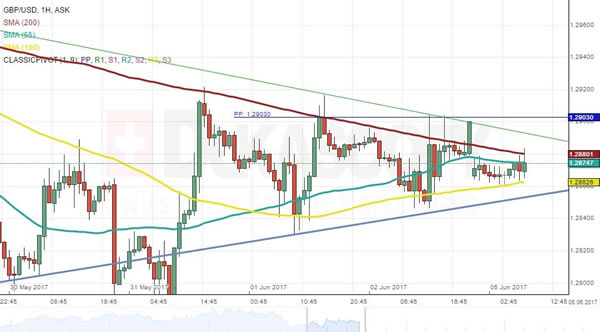
GBP/USD Analysis: To Attempt To Reclaim 1.29
Friday ended with the Cable edging moderately higher, amid the disappointment brought by the US NFP data. The rally caused another confirmation of the two-week down-trend, which now acts as the resistance line of a triangle pattern. This pattern is nearing its apex, with a breakout to occur by mid-Tuesday. The lower border of the triangle is much stronger, as it is a support line of a much larger pattern—the broadening rising wedge. Moreover, it is supported by a larger number of significant levels than the down-trend. Technical indicators are also in favour of the bullish scenario, thus, the GBP/USD pair is likely to take another shot at climbing over the 1.29 mark this week and pierce the resistance around that area, which is represented by the monthly pivot point.
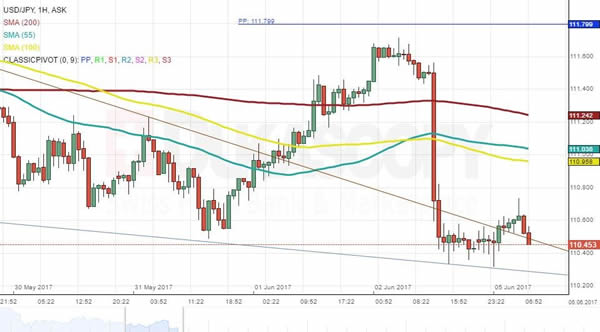
USD/JPY Analysis: Struggles To Rebound
The Buck's attempts to appreciate against the Yen at the end of the previous week were in vain, as downbeat US NFP data caused the given pair to erase all of that week's gains. Nevertheless, the Greenback appears to be reluctant to fall under the 110.50 mark, as it remained above this handle ever since it was retaken back in April. Technical indicators, on the other hand, suggest the USD/JPY is to continue slumping, but that might not be the case due to the breach of the three-week down-trend. Furthermore, the US Dollar is also supported by another trend-line circa 110.30, which should limit the possible losses and provide sufficient impetus for a future recovery.
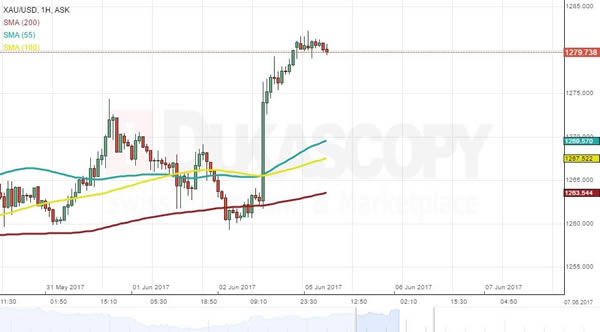
XAU/USD Analysis: Finds Support And Surges The Yellow
The yellow metal traded above a significant level of support on Monday morning, as the commodity price was located above the 1,280 level. Due to the fact that the bullion could count on the support of the 61.80% Fibonacci retracement level at the 1,278.96 mark, a hypothesis of a continuation of the surge was made. The yellow metal’s price is most likely going to surge up to the newly calculated weekly R1, which is located at the 1,286.87 level. Moreover, the commodity faces no other resistance levels up to that mark, as even the upper Bollinger band is located above the weekly level of significance. On the other hand a decline might occur, in which case the metal will search for support in the weekly PP at 1,273.06.
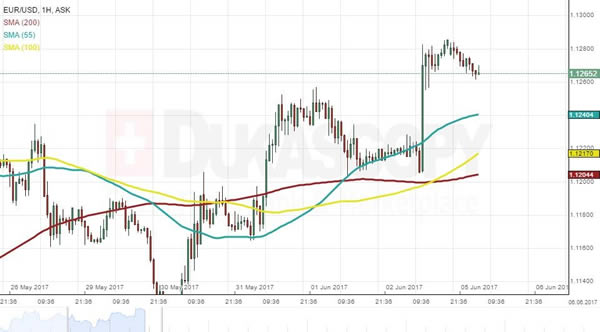
EUR/USD Analysis: Aims For 1.13 Mark
After scoring major gains against the US Dollar during the second half of Friday’s trading session the common European currency had retreated on Monday morning. The EUR/USD currency pair had jumped on Friday at 12:30 GMT when the worse than expected fundamental US data was released. It is most likely that the currency exchange rate will continue its short decline until it encounters the support of the 55-hour SMA. On Monday morning the SMA was moving higher near the 1.1240 mark, and it was supported by the lower Bollinger band of the hourly chart. In the case of a surge the pair would then begin the ascent to the weekly R1, which is located at the 1.1344 level.
Technical Outlook: Spot Gold Rises To Six-Week High On Increased Safe Haven Demand
Spot Gold rose to six-week high at $1282 on Monday, extending strong rally from last Friday, when gold price was boosted by weaker dollar on disappointing US jobs data.
Terrorist attack in London over the weekend and rising geopolitical tensions in the Middle East, increased safe haven demand and further inflated gold price.
Friday's long bullish daily candle (the biggest one-day rally since 17 May) continue to underpin the action, after gold closed above $1276 pivot (Fibo 76.4% of $1295/$1214) on Friday and break above bull-trendline resistance signaled bullish continuation.
Fresh bulls may extend towards $1288 (21 Apr high), with key barrier at $1295 (17 Apr peak) expected to come in focus.
Initial supports lay at $1278 (session low) and $1276 (broken Fibo 76.4%) with broken daily cloud top ($1270) expected to contain extended corrective downticks.
Res: 1282, 1288, 1295, 1300
Sup: 1278, 1276, 1270, 1265
Market Update – European Session: Focus On Thursday’s ECB Decision And UK Parliamentary Elections
Focus on Thursday's ECB decision and UK Parliamentary elections
Notes/Observations
Whit Monday holiday keeps European participation light (markets closed in Germany, Denmark, Austria, Switzerland and Norway). Bank Holidays in a number of others (France included)
Week's main focus will be on the ECB and the outcome of the British General election
Major European Services PMI data remains in expansion (Beats: Euro Zone, Germany, Russia; misses: UK; France, Italy)
Oil rises after a Saudi-led alliance cut diplomatic ties with Qatar and moved to close off access to the Gulf country
Overnight
Asia:
China May Caixin PMI Services hits a 4-month high (52.8 v 51.5 prior)
China PBOC deputy Gov Chen Yulu: To maintain a monetary policy that is "neither too tight or too loose"
North Korea fully rejected latest US/UN sanctions; to continue firing missiles and will pursue its nuclear program
US Defense Sec Mattis: North Korea had increased pace of pursuing nuclear weapon; US will take further steps to protect homeland from North Korean threat
Europe:
London armed police responded to incidents on Saturday of vehicle driving into pedestrians at London Bridge and stabbings in Borough Market (7 people were killed and 48 injured in the attacks).
PM May stated after the latest terror incident that "enough was enough"; things needed to change when it came to taking on extremism. Could not defeat ideology through military intervention alone and stressed that there was too much tolerance of extremism in UK; hade disrupted five terror plots since Manchester attack. Election campaigns would resume on Monday
Islamic State claimed responsibility for the attacks in the UK on Saturday
ECB's Visco (Italy): Italy needed jobs to revive economy, must focus on medium-long term policies
Recent UK election Polls:
Survation/Mail poll on Parliamentary elections: Support for UK Conservatives at 40% (-6 ppt); Labour at 39% (+5 ppt)
Daily Yougov model on upcoming Parliamentary elections; suggests 14-seat majority for PM May but 18 seats short of 326-seat majority. Conservative: 42% (-1) with 308 seats (313 prior poll); Labour: 38% (+2) with 261 seats (257 prior poll) Opinium/Observer: Conservatives 43% (-2); Labour 37% (+2) ComRes: Conservatives 47% (+1); Labour 35% (+1) ORB/Telegraph: Conservatives 45% (+1); Labour 36% (-2) ICM: Conservatives 45% (-1); Labour 34% (+2)
Energy:
Saudi Arabia, UAE, Bahrain, and Egypt said to have cut diplomatic relations with Qatar after leaked tape where Qatari Emir Tamim bin Hamad al-Thani criticized Gulf rhetoric against Iran. Saudi Arabia accused Qatar of supporting "terrorism" and financing "groups" linked to Iran. Planned to shut down Sea, Airspace, Land crossings with Qatar
Economic Data
(IN) India May PMI Services: 52.2 v 50.2 prior (4th month of expansion and highest since Oct), PMI Composite: 52.5 v 51.3 prior
(RU) Russia May PMI Services: 56.3 v 55.6e (16th month of expansion), PMI Composite: 56.0 v 55.3 prior
(SE) Sweden May PMI Services: 57.9 v 60.3 prior
(TR) Turkey May CPI M/M: 0.5% v 0.4%e; Y/Y: 11.7% v 11.7%e; CPI Core Y/Y: 9.4% v 9.6%e
(ZA) South Africa May PMI (Whole Economy: 50.2 v 50.3 prior
(ES) Spain May Services PMI: 57.3 v 57.5e, Composite PMI: 57.2 v 57.1e
(IT) Italy May Services PMI: 55.1 v 55.3e (12th month of expansion), Composite PMI: 55.2 v 55.7e
(FR) France May Final Services PMI: 57.2 v 58.0e (11th month of expansion),, Composite PMI: 56.9 v 57.6e
(DE) Germany May Final Services PMI: 55.4 v 55.2e (confirms 47th month of expansion), Composite PMI: 57.4 v 57.3e
(EU) Euro Zone May Services PMI: 56.3 v 56.2e (confirms 47th month of expansion), Composite PMI: 56.8 v 56.8e
(UK) May Services PMI: 53.8 v 55.0e (10th month of expansion), Composite PMI: 54.4 v 55.5e
Fixed Income Issuance:
None seen
SPEAKERS/FIXED INCOME/FX/COMMODITIES/ERRATUM
Equities
Indices [Stoxx50 -0.3% at 3579, FTSE -0.2% at 7530, DAX Closed, CAC-40 -0.6% at 5312, IBEX-35 -0.5% at 10850, FTSE MIB -1.0% at 20724, SMI Closed, S&P 500 Futures -0.1%]
Market Focal Points/Key Themes European Indices trade slightly lower in light trade with German Markets shut for observance of Whit Monday. Reaction to this weekends terror attacks in London are having little impact, although travel and leisure names seeing downside with Easyjet and International Consolidated Airlines down over 1.5%. Elsewhere shares of Sponda is higher by over 20% after its to be acquired by funds managed by Blackstone, whilst Banco Populare is lower after reportedly will meet with the ECB to boost liquidity. Looking ahead looking out for earnings from Jinkosolar as well as Supercom.
Equities
Consumer discretionary [Ocado [OCDO.UK] +5.2% (First customer for OSP), ICG [IAG.UK] -1.5%, Easyjet [EZJ.UK] -1.8% (London Terror attack)]
Industrials: [Cape [CIU.UK] +1.3% (Contract win, Raised outlook), Royal Mail [RMG.UK] +1.4% (Awarded contracts of sale of two plots on the Nine Elms site for £101M in cash), BBA Aviation [BBA.UK] -1.7% (CEO steps down)]
Financials: [Banco Populare [POP.ES] -8% (To discuss option with ECB for options to boost liquidity), Sponda [SDA1V.FI] +20% (To be acquired for €5.19/shr)]
Speakers
S&P analyst Kraemer: UK sovereign rating depended on Brexit negotiations and not the election outcome
Russia said not to see any cause for alarm from an energy point of view regarding the Qatar diplomatic row
Russia to spend RUB2.1B/day buying FX during Jun 7th thru July 6th period; Expected extra oil/gas revenues of RUB41.2B in June
Indonesia Energy Min Djuraid: To reactivate OPEC membership (as expected)
Currencies
USD consolidated some of its recent losses after declines following the US jobs data last Friday. The USD tested its lowest level since Nov 8th as non-farm payrolls underwhelmed. FX markets seemed to ignore that US unemployment rate was its lowest level in 16 years
The week's main focus will be on the ECB decision and the outcome of the British General election
EUR/USD softer by 0.2% in quiet trading at 1.1265. Dealers were looking ahead to Thursday's ECB meeting. The ECB may take out its easing bias when meeting in Tallinn, but Draghi will continue emphasizing inflation downside risks. Analysts were bullish on Europe noting that the Euro currency had become more positively correlated with growth and political uncertainty has diminished
UK election uncertainties have risen with some opinion polls seeing the Conservatives lead narrowing to only around 1-4% points ahead of Labour. GBP/USD was fractionally softer at 1.2875. Softer-than-expected May Serviced PMI data provided some headwinds foe the GBP in the session.
Fixed Income
Bund futures trade at 164.49 down 17 ticks, after improving Chinese Caixin PMI data. Resistance lies near the 165.95 level followed by 167.79. A break of the 162.65 support level could see lows target 159.96 followed by 157.50.
Gilt futures trade at 128.62 lower by 22 ticks, off the lows of the day following disappointing UK PMI Services reading. Last week's decline fell back below both the 129.00 handle and the 129.14 April 18th high. Price finds key support at the 128.27 support level. An acceleration lower could test the 127.43 region. Resistance remains the noted 129.00/129.14 region, then 129.75 followed by 130.28.
Monday's liquidity report showed Friday's excess liquidity dropped lower to €1.656T a decline of €11B from €1.667T prior. Use of the marginal lending facility fell to €262M from €327M prior.
Corporate issuance saw $27.55B issued last week, ahead of last week's forecast of $20B. For the week ahead, analysts eye issuance to come in around $25B.
In Euro denominated issuance €28.27B came to market last week.
Looking Ahead
06:45 (US) Daily Libor Fixing - 07:00 (IN) India announces details of upcoming bond sale (held on Fridays)
07:25 (BR) Brazil Central Bank Weekly Economists Survey
08:00 (ES) Spain Debt Agency (Tesoro) announces size of upcoming auctions
08:30 (CH) Swiss Government question time in Parliament
08:15 (UK) Baltic Dry Bulk Index
08:30 (US) Q1 Final Nonfarm Productivity: -0.2%e v -0.6% prelim; Labor Cost: 2.5%e v 3.0% prelim
08:30 (CL) Chile Apr Economic Activity Index (monthly GDP) M/M: +0.2%e v -0.2% prior; Y/Y: 0.9%e v 0.2% prior
08:50 (FR) France Debt Agency (AFT) to sell combined €5.0-6.2B in 3-month, 6-month. 9-month and 12-month BTF Bills
09:00 (BR) Brazil May PMI Services: No est v 50.3 prior, PMI Composite: No est v 50.4 prior
09:00 (MX) Mexico May Consumer Confidence: No est v 83.8 prior
09:00 (MX) Mexico Mar Gross Fixed Investment: No est v -3.1% prior
09:30 (EU) ECB announces Covered-Bond Purchases
09:35 (EU) ECB calls for bids in 7-Day Main Refinancing Tender
09:45 (US) May Final Markit Services PMI: No est v 54.0 prelim, Composite PMI: No est v 53.9 prelim
10:00 (US) May ISM Non-Manufacturing Composite: 57.0e v 57.5 prior
10:00 (US) Apr Factory Orders: -0.2%e v +0.2% prior; Factory Orders (Ex Transportation): No est v -0.3% prior
10:00 (US) Apr Final Durable Goods Orders: No est v -0.7%prelim; Durables Ex Transportation: No est v -0.4% prelim, Capital Goods Orders (Non-defense ex aircraft): No est v 0.0% prelim, Capital Goods Shipments (Non-defense/ex-aircraft): No est v -0.1% prelim, Durables Ex-Defense: No est v -0.8% prelim
10:00 (SE) Sweden Central Bank (Riksbank) Jochnick
11:30 (PT) Portugal Central Bank Gov Costa in Parliament
11:30 (US) Treasury to sell 3-Month and 6-month Bills
20:00 (CO) Colombia May CPI M/M: 0.3%e v 0.5% prior; Y/Y: 4.5%e v 4.7% prior, CPI Core M/M: No est v 0.6% prior, Y/Y: No est v 5.6% prior
Technical Outlook: US Oil Rallies On Geopolitical Concerns, Upper Pivots At $48.40/74 In Focus
WTI oil extended recovery rally from last Friday's spike low at $46.74 and hit session high at $48.40 in early Monday's bullish acceleration.
Oil price accelerated higher on fresh geopolitical instability in the Middle East after unexpected action of Saudi Arabia, The United Arab Emirates, Bahrain and Egypt which severed their diplomatic ties with Qatar, accusing it of supporting terrorism.
Oil price was so far unable to sustain break above $48.00 barrier, as action was capped by falling hourly cloud.
However, rising uncertainty over geopolitical situation in the Gulf region would further boost oil price. Additional support comes from long-tailed daily candle left on Friday, which signaled strong downside rejection and failure to clearly break below lower pivot at $46.89 (Fibo 61.8% of $43.74/$51.98 upleg).
Extended recovery needs close above $48.74 (Fibo 38.2% of $51.98/$46.74 downleg) to generate stronger reversal signal and open way for further retracement of $51.98/$46.74 downleg., towards a cluster of strong MA barriers between $49.00 and $49.66.
Session low at $47.65 marks solid support which is expected to hold dips and keep near-term focus at the upside.
Break below here and extension below $47.40 would signal an end of recovery rally from $46.74 and shift near-term focus lower.
Res: 48.18, 48.40, 48.74, 49.00
Sup: 47.76, 47.65, 47.40, 46.89
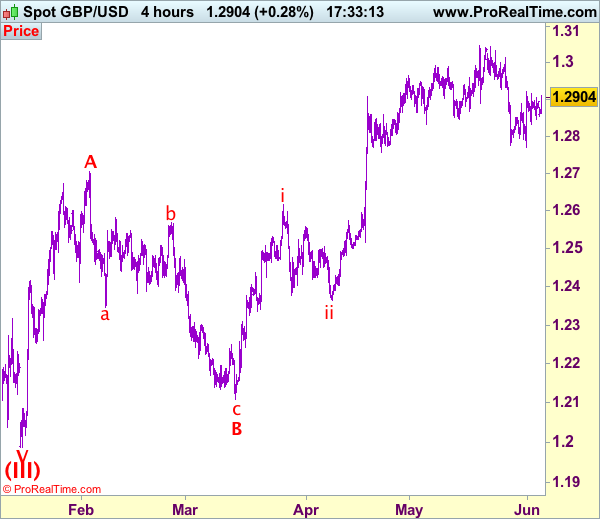
Trade Idea: GBP/USD – Hold short entered at 1.2920
GBP/USD – 1.2896
Recent wave: Wave V of larger degree wave (III) has ended at 1.1986 and major correction has commenced from there for gain to 1.3000 and 1.3140-50
Trend: Near term up
Original strategy :
Sold at 1.2920, Target: 1.2770, Stop: 1.2920
Position: - Short at 1.2920
Target: - 1.2770
Stop: - 1.2920
New strategy :
Hold short entered at 1.2920, Target: 1.2770, Stop: 1.2920
Position: - Short at 1.2920
Target: - 1.2770
Stop:- 1.2920
The British pound has remained confined within recent established range and further consolidation is in store, however, as long as indicated resistance at 1.2921 holds, mild downside bias remains for another retreat, below 1.2830-40 would signal the rebound from 1.2769 has ended, bring weakness to 1.2800, then retest of said support, break there would extend recent decline from 1.3048 to support at 1.2757 which is likely to hold on first testing.
Our preferred count on the daily chart is that cable's rebound from 1.3500 (wave (A) trough) is unfolding as a wave (B) with A ended at 1.7043, followed by triangle wave B and wave C as well as wave (B) has ended at 1.7192, the subsequent selloff is the larger degree wave (C) which is still unfolding with minor wave (III) of larger degree wave 3 ended at 1.1986, hence wave (IV) correction is in progress which could either be a triangle wave (IV) of a complex formation but upside should be limited to 1.3500 and price should falter well below 1.4000, bring another decline in wave (V) of 3 for weakness to 1.1500, then 1.1200.
On the upside, above 1.2921-26 (said resistance and previous support) would defer and suggest low has been formed instead, risk a stronger rebound to 1.2965-70 and possibly towards 1.3000 but only break of resistance at 1.3015 would signal the retreat from 1.3048 has ended.
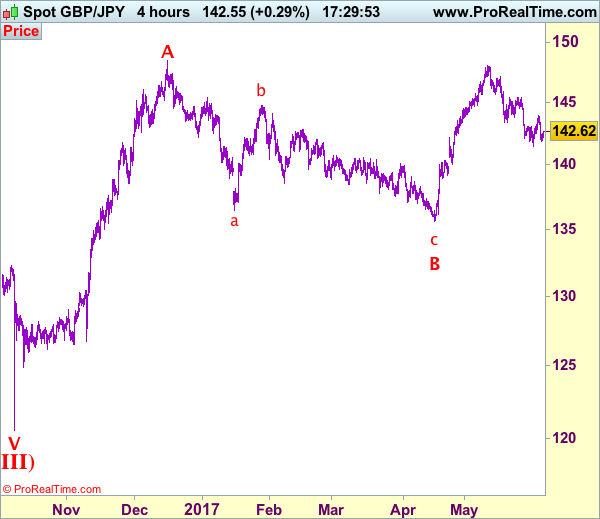
Trade Idea: GBP/JPY – Hold short entered at 143.65
GBP/JPY - 142.60
Recent wave: Medium term low formed at 120.50 and (A)-(B)-(C) major correction has commenced with (A) leg ended at 148.45, hence wave (B) is unfolding for retreat to 131.00-10.
Trend: Near term up
Original strategy:
Sold at 143.65, Target: 141.65, Stop: 144.00
Position: - Short at 143.65
Target: - 141.65
Stop: - 144.00
New strategy :
Hold short entered at 143.65, Target: 141.65, Stop: 143.45
Position: - Short at 143.65
Target: - 141.65
Stop:- 143.45
Sterling met renewed selling interest at 143.95 and the pair has slipped on Friday, retaining our bearishness and below 141.85-90 would signal the rebound from 141.50 has ended, bring retest of this level. Looking ahead, below said support at 141.50 would extend the selloff from 148.10 top to 141.00 but loss of momentum should limit downside to 140.50-55 and price should stay above psychological support at 140.00, bring rebound later.
In view of this, we are holding on to our short position entered at 143.65. Above 143.40 would risk another test of 143.95-00, however, only break there would signal low has been formed instead, bring a stronger rebound to 144.50 but upside would still be limited to 145.00 and price should falter well below said resistance at 145.45, bring another decline later.
Our preferred count is that larger degree wave V with circle is unfolding from 251.12 with wave (I) 219.34, (II): 241.38 and wave (III) is subdivided into 1: 192.60, 2: 215.89 (23 Jul 2008) and wave 3 ended at 118.87 earlier in 2009. The correction from there to 162.60 is wave 4 which itself is a double three and is labeled as first a-b-c ended at 151.53, followed by wave x at 139.03, 2nd a ended at 162.60, 2nd b at 146.75 and 2nd c leg of wave 4 ended at 163.00. Therefore, the decline from 163.00 to 116.85 is now treated as wave 5 which also marked the end of larger degree wave (III), hence wave (IV) major correction has commenced for retracement of the wave (III) from 241.38 and upside target at 183.95-00 (50% Fibonacci retracement of the wave (II) from 241.38) had been met, a drop below 160.00 would suggest wave (IV) has ended at 195.85, bring decline in wave (V) for initial weakness to 130 (already met) and 120.
US Jobs Data Disappoint, But The Fed Remains On Track To Hike
The US labor market cooled somewhat in May, data showed on Friday. Nonfarm payrolls rose by 138k, notably less than the consensus of 185k, while last month's figure was revised down to 174k from 211k previously. The unemployment rate ticked down, but that decline was probably owed to a drop in the labor force participation rate. This suggests that people may have been discouraged and perhaps stopped looking for a job altogether, resulting in fewer registered unemployed people. Meanwhile, average hourly earnings slowed to +0.2% mom in line with expectations from +0.3% mom, though that kept the yearly rate unchanged at +2.5%.
USD/JPY tumbled on Friday following the softness in the US jobs data. The rate slid after it hit resistance near 111.70 (R2) to find support at the 110.30 (S1) barrier, marked by the low of the 18th of May. The price structure on the 4-hour chart suggests a short-term sideways range, between that obstacle and the resistance territory of 112.15 (R3). As a result, given our proximity to the lower bound of the range, we think the pair could rebound somewhat today and recover some of Friday's losses.
Despite the softness in these data, the Fed remains on track to raise borrowing costs next week, evident by market pricing for a June hike, which at the time of writing rests at roughly 95% according to the Fed funds futures. Given that a rate increase is almost fully priced in, we believe that market focus on the day will be on any signals the Committee's sends with regards to future hikes. Specifically, we will look for clues on whether or not the FOMC will deliver a “dovish hike”, communicating that the recent softness in the data could lead to slower hikes in the future. Indeed, slowing inflation, falling inflation expectations and flat wage growth, are all strong arguments in support of a relatively cautious tone by policymakers.
RBA policy gathering in focus
During the Asian morning Tuesday, the RBA policy decision will be in focus and the forecast is for the Bank to keep its policy unchanged. The minutes of the latest gathering showed that the Bank is still concerned about employment, noting that it is “carefully monitoring” developments around the labor market. Nonetheless, April's employment data that were released after that meeting were particularly strong, and we think that the Bank is likely to acknowledge this progress.
That said, we expect policymakers to refrain from appearing too upbeat. Even though Australian data are improving, some forward-looking indicators of the Chinese economy suggest economic activity there is cooling. Specifically, the Caixin manufacturing PMI entered the contractionary territory in May, which is likely to be worrisome news for the RBA, considering Australia's heavy trade exposure to China. What's more, the fact that iron ore prices have continued to slide since the latest RBA meeting enhances the case for a balanced tone by policymakers. Bearing these in mind, we think that AUD could gain if officials acknowledge the progress of the jobs market, but we do not expect any such reaction to be major.
AUD/USD rebounded on Friday after it hit support at 0.7375 (S3), near the upside support line taken from the low of the 9th of May. Although the rate is trading above that line, it remains below the downside resistance line drawn from the peak of the 17th of April. Therefore, we consider the short-term outlook to be flat for now. We would like to see a clear move above 0.7475 (R1) before we get confident on further upside extensions. Something like that could initially aim for our next resistance of 0.7515 (R2).
Today's highlights:
During the European day, the UK services PMI for May is due out and the forecast is for a decline. Even though this could hurt sterling somewhat, we maintain the view that market focus is likely to remain on incoming polls as we draw closer to Election Day on Thursday.
From the US, we get the ISM non-manufacturing PMI for May and the consensus is for the index to have slid somewhat. However, such a decline would still leave the figure at a very elevated level, consistent with strong growth in the non-manufacturing sector. Therefore, we doubt that such a pullback will materially alter investors' expectations regarding the Fed's hiking plans from June onwards, and thus, we expect it to not hurt USD much.
Markets will remain closed in Germany, France, Switzerland, Norway and Sweden in celebration of Whit Monday.
As for the rest of the week, we have a very busy schedule that is packed with potential market-moving events. On Tuesday, the RBA will announce its rate decision as we outlined above. On Wednesday, the only event that could attract some market attention is Australia's GDP for Q1. Meanwhile on Thursday, the UK General Election, the highly anticipated ECB policy meeting, and a testimony by former FBI Director Comey before the US Senate are all likely to keep investors on the edge of their seats. Finally on Friday, we will get China's CPI and PPI data, as well as Canada's employment figures, all for May.
USD/JPY
Support: 110.30 (S1), 109.70 (S2), 109.35 (S3)
Resistance: 111.25 (R1), 111.70 (R2), 112.15 (R3)
AUD/USD
Support: 0.7420 (S1), 0.7395 (S2), 0.7375 (S3)
Resistance: 0.7475 (R1), 0.7515 (R2), 0.7550 (R3)