Sample Category Title
British Construction Activity Rises At Strongest Pace Since 2015 In May
'A sustained rebound in residential building provides an encouraging sign that the recent soft patch for property values has not deterred new housing supply.' — Tim Moore, IHS Markit
Construction activity rose at the fastest pace since the end of 2015 last month, a private survey showed on Friday. Markit/CIPS reported that its Purchasing Managers' Index for the UK construction sector came in at 56.0 in May, following the preceding month's 53.1. Meanwhile, market analysts anticipated a decline to 52.7 points during the reported month. The construction sector accounts only for about 6% of the UK economy. Nevertheless, May's construction and manufacturing PMI survey suggested that the economy gained positive momentum in the second quarter. Friday's data showed that housebuilding climbed at its fastest pace since December 2015, with commercial construction rising at the strongest rate since March 2016. Markit also highlighted that British builders employed more people and ordered more raw materials to cope with surges in order inflows. Despite the stronger-than-expected PMI for both construction and manufacturing sector, Monday's release of the PMI for the services sector will provide a clearer picture of the British economy, as services activity accounts for about 70% of the economy.
Sterling Slides ahead of Close Election
- Sterling slides ahead of close election
- USD strengthened by safe haven flows
- Heavy data week awaits us
After deranged murderers went on a rampage in central London and were thankfully put down by the police before further carnage, there is a growing acceptance that tolerance of these extremist views cannot be excused any more. Hate and violence is no less acceptable when shrouded with pseudo-faith overtones than it is when the perpetrator is any other kind of lunatic. It is impossible for any sane person not to feel so very sad for those who perished or were injured and so very sorry for their families and friends, but also for anyone who saw such unthinkable acts of violence. All have had their world changed by just a few seconds of madness. I really hope Theresa May meant it when she said 'Enough is enough'. Actions are now needed to fulfil the Government's primary objective – to keep the people safe. It will be too late for the victims in Manchester and London, but there are 65 million or more who need that certainty.
On Friday, the US employment report was a disappointment and the US Dollar weakened as a result. It did bounce back after the UK attacks, as investors reacted by buying safe haven US treasuries. That is a common reaction and the unwinding of that knee-jerk reaction is also fairly standard fayre.
Aside from the weekend's horrific events, and rather cruelly it seems, the rest of the world carries on. For the UK financial markets, the major event happens this week. If the pollsters have got their sums right (no certainty of that, of course) Thursday's UK general election is a much tighter affair than anyone would have predicted a month ago. Each new poll tugs the Pound around, but it is inevitable that Sterling will remain weak as we approach Thursday and the result in the early hours of Friday will have a significant impact.
The general rule of thumb suggests that a result of no overall majority will knock Sterling down like a straight right from Anthony Joshua. The resolution of that situation into a coalition or a minority government wouldn't really help the Pound much. A small majority for the Tories would allow the Pound to bounce back a little; and the removal of the uncertainty an election brings would do that in any event. A significant majority for the Conservatives would, it would seem from the reactions to various polls, considerably boost Sterling. I cannot find any pollsters who predict a Labour victory, but they got the Brexit result wrong, the Scottish Independence result wrong, and the last election wrong, so who knows? The current odds being offered by Coral's are 'twelve to one on' for a Tory win and thirteen to two for a Labour one. Have you ever seen a broke bookie?
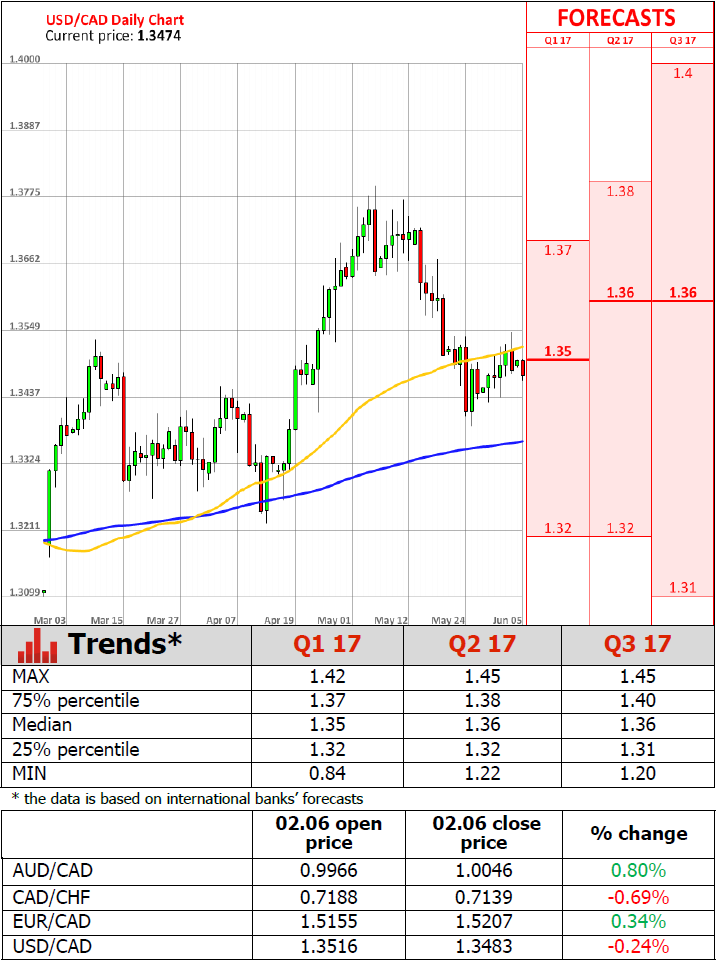
For fear of being a parochial one-story reporter, I must mention the other news of the week. We will get a shower of Service Sector Sentiment Indices in the early part of the week. These come from the EU, UK and US; and a number of other countries besides. Later in the week we get the National Institute of Economic and Social Research (NIESR) estimate for UK Gross Domestic Product (GDP) growth in May (a slight improvement is forecast) and we'll get Chinese Inflation data, Canada's Employment report, which is forecast to be a little more positive. CAD buyers; like most GBP sellers, may wish to act before the election to avoid the risk of a weaker Pound anyway.
As well as the UK election, Thursday brings the European Central Bank (ECB) interest rate decision. The decision will be to leave everything on hold, so little change is forecast from that.
There is a lot more besides and I will cover that throughout the week, but for now I will leave you with some of the more bizarre news headlines ever seen. These include the comprehensive 'Son of Westboro Baptist Church Leader attacked on live TV by naked 500lb man who burst out of the bathroom, sat on him and shouted "Who's your daddy now?"' No further text is required for that one. The other one that makes you read it twice is ' Woman in sumo wrestler suit assaulted her ex-girlfriend in gay pub after she waved at a man dressed as a Snickers bar.' And this is not funny but the headline reads, 'One-armed man applauds the kindness of strangers'. Finally, 'Psychics predict the world didn't end yesterday.'
Thank you
A thank you to all the men and women in and out of uniforms who run toward danger so that we can run away. Thank you to all the health workers who arrive at a scene of devastation and deal with each individual as though they were the only thing that matters. And a thank you to their loved ones for supporting them in what they do. It is only at times like these that we see the true value of their valour and expertise.
US Private Companies Create Less New Jobs Than Expected In May
'Taken with the downward revisions, [report] suggests a continuation of the combination of slow GDP growth and weak productivity growth, emphasising the need for structural reforms in tax, regulatory, and entitlement policies.' — Douglas Holtz-Eakin, American Action Forum
US companies created less new positions than expected last month, whereas the jobless rate dropped unexpectedly. The US Department of Labour reported on Friday that the US private sector added 138K new jobs to the economy in May, following the preceding month's downwardly revised reading of 174K and falling behind expectations for a 181K gain, while the ADP Report showed Thursday that private payrolls rose 253K in May. Meanwhile, the unemployment rate dropped unexpectedly to 4.3% during the same month, while analysts expected the rate to remain unchanged at 4.4% last month. The jobless rate fall was mainly driven by the nation's drop in the labour force participation rate to 62.7%, the lowest since May 2001. Apart from that, average hourly earnings climbed 0.2% in May, in line with analysts' forecasts. In the meantime, April's increase of 0.3% was revised down to a 0.2% gain. Despite Friday's weak figures, the odds for a rate hike in June remained high at 93.5%. However, some analysts suggested that if inflation growth remains unstable it would be hard for the Federal Reserve to continue raising rates.
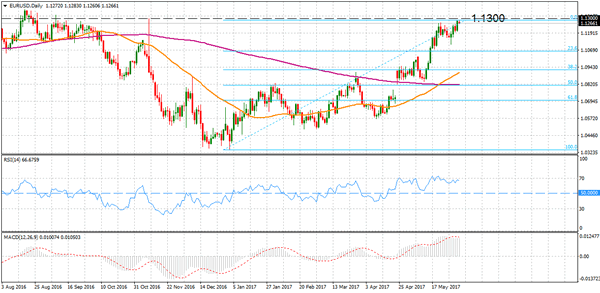
EURUSD Bias on the Upside; Key Resistance at 1.1300
EURUSD maintains a bullish market structure. The market is consolidating in the near-term after a strong rally from the 1.0840 area that started in early May. Prices hit a fresh six-month high of 1.1284 last Friday but the rally stalled here as the market is close to overbought levels. This is indicated by the RSI being near 70.
The bias remains on the upside, with focus on key resistance at 1.1300. A decisive break of this level would strengthen the bullish bias and target the June 2016 high of 1.1427. From here, there is scope to target the 1.1600 handle.
A move lower would target support at 1.1075 (May 18 low). This level is close to the 23.6% Fibonacci retracement level of the rise from 1.0340 (January 3 low) to the June 2 high of 1.1284. Below this, next support comes into view at 1.0810. This support is defined by the 50% Fibonacci as well as the 200-day moving average.
Looking at the bigger picture, the bullish medium-term market structure continues to build, as the market is carving out higher highs and higher lows since January. MACD is rising, while the bullish crossover of the 50-day MA with the 200-day MA on May 22 also highlights the bullish bias.
Canadian Trade Deficit Narrows To C$0.4B In April
'The Bank of Canada has been looking for that for the length of 2016 but has been largely disappointed, but maybe it is starting to materialise as we move into 2017.' - Paul Ferley, Royal Bank of Canada
The Canadian trade deficit narrowed in April but less than expected, as imports growth offset exports growth. Statistics Canada reported on Friday that country's trade gap narrowed to C$0.4B in April, following the previous month's deficit of C$0.9B. Meanwhile, analysts anticipated a shortfall of just C$70M. Canadian exports advanced 1.8% in April to C$47.7B, compared to March's gain of 3.2%. Shipments of motor vehicles and parts climbed 4.4%, whereas exports of energy rose 2.5%. Canadian imports rose for the fifth consecutive month in April, posting a 0.6% gain to C$48.1B amid higher shipments of consumer goods, electronic and electrical equipment and parts. Exports to the country's southern neighbour, the United States, which accounted for 75.7% of all exports in April, surged 5.4%, whereas imports rose just 1.1%. Thus, the Canadian trade surplus with the US rose to C$5.0B, the biggest since May 2014, from March's C$3.4B. Separately, Statistics Canada reported that the labour productivity of businesses increased 1.4% in the March quarter.
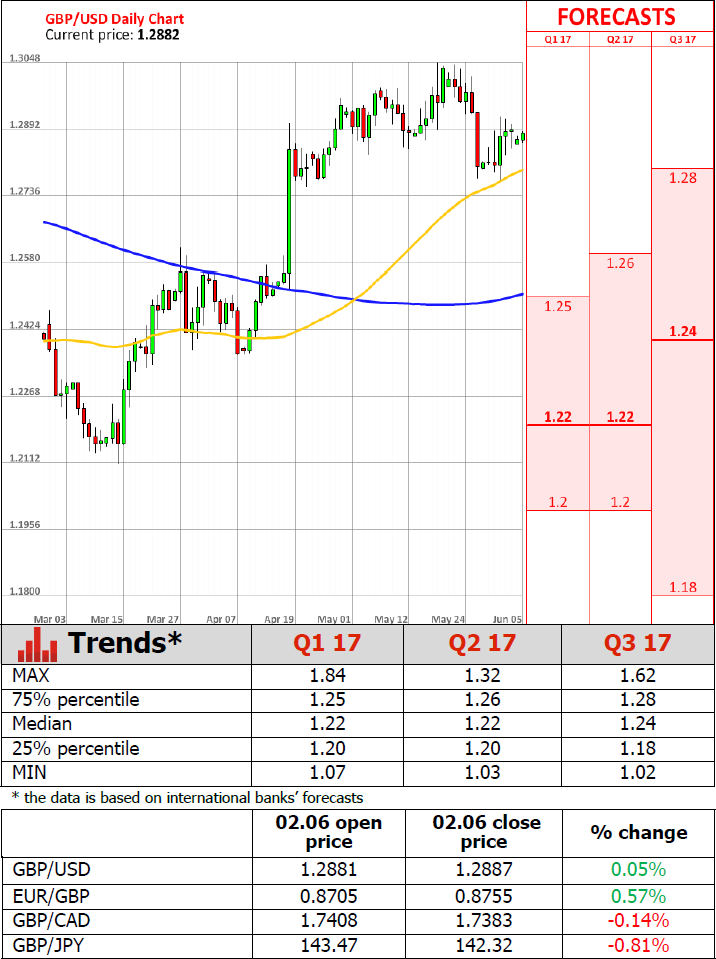
Sterling Slips after London Attacks; Oil Surges on Tensions in the Gulf
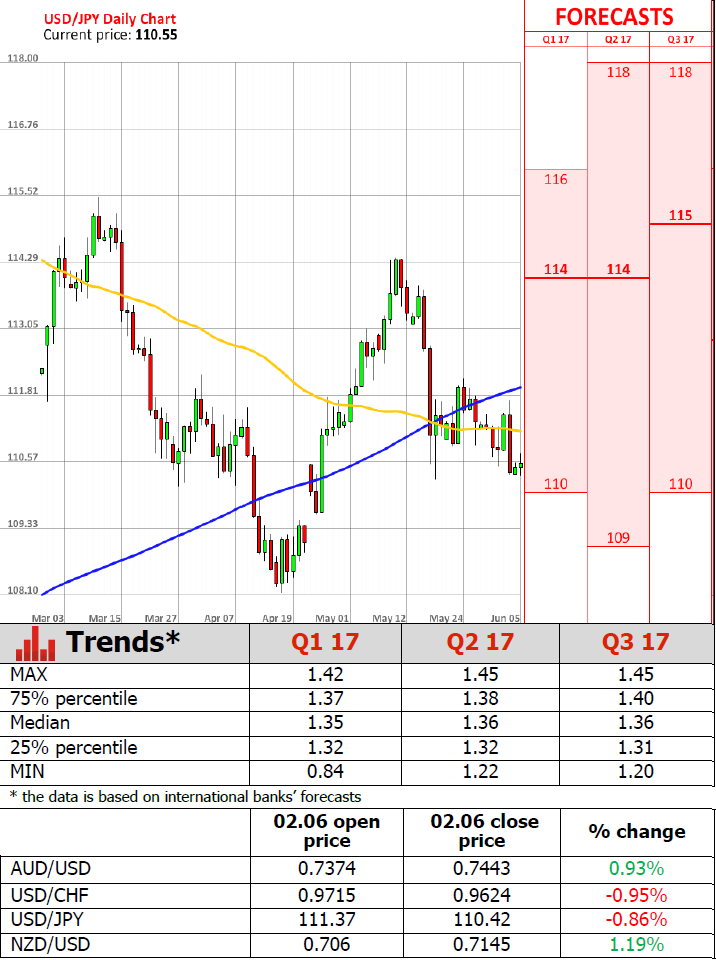
The dollar hovered near seven-month lows against the yen following Friday's disappointing US jobs report, while sterling weakened after the news of the attacks in London over the weekend. Gold hit its highest in over six week and oil was lifted due to tensions in the Middle East.
The greenback held onto losses made on Friday after the release of the non-farm payrolls report which showed fewer jobs were added to the US economy in May, while the previous two months' figures were revised lower. Despite the unemployment rate falling to a 16-year low of 4.3%, payrolls rose by only 138,000 jobs last month versus the 185,000 forecasted.
The dollar reacted negatively to the data and tumbled to a new seven-month low against the yen in Asian trading today. The pair fell to 110.30 yen before rebounding later in the session. The dollar index dropped to its lowest level since November after the report on Friday and remained below 97 points in Asia, as the softer jobs data diminished prospects of a total of three rate hikes this year by the Federal Reserve, as was originally expected by the markets.
Political uncertainty weighed on the pound after the attacks in London over the weekend that killed seven people resulted in the temporary suspension of campaigning, just days before the June 8 national elections. Sterling fell as much as 0.3% against the dollar in Asia from Friday's close, trading down to $1.2855. British Prime Minister Theresa May is expected to resume campaigning today. The vote is expected to be much tighter than previously predicted.
The Australian dollar rebounded after a stronger-than-expected Caixin Chinese services PMI provided a boost, as China is a major trading partner for Australia. The index rose to 52.8 in May compared to 51.5 in April. The aussie jumped to $0.7456 after the data from a low of $0.7421.
Gold prices benefitted from a broadly weaker dollar and hit its strongest since April 21 at $1,281.86 an ounce early in the session.
Oil prices rose on news out of the Gulf overnight. Four Arab countries cut diplomatic ties with Qatar, escalating a crisis that started over its relationship with Iran. WTI crude oil fell in early Monday trading to reach $47.64 a barrel before rising back to the $48 handle. Tensions in the Middle East trumped data out late on Friday that showed a rise in the latest US oil rig count.
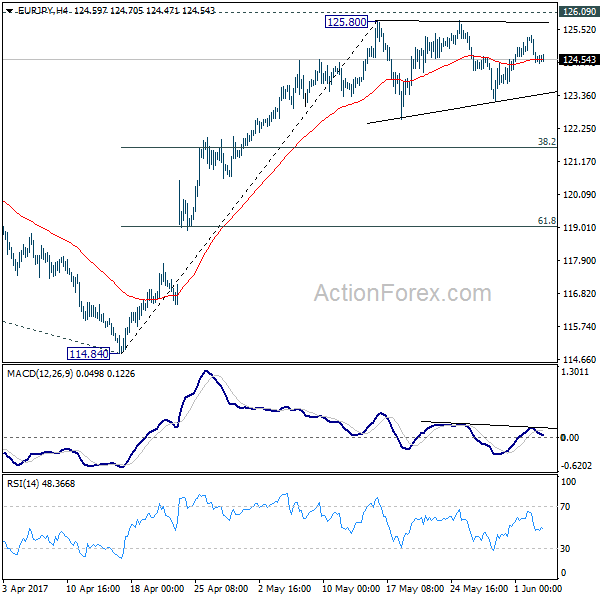
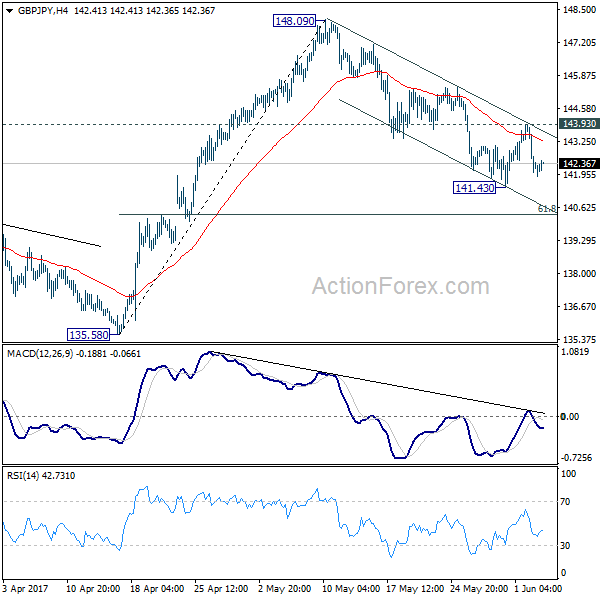
GBP/JPY Daily Outlook
Daily Pivots: (S1) 141.55; (P) 142.75; (R1) 143.49; More....
Intraday bias in GBP/JPY remains neutral for the moment. On the downside, break of 141.43 will extend the decline from 148.09. In such case, intraday bias is turned to the downside for 61.8% retracement of 135.58 to 148.09 at 140.35. At this point, we'd still expect rebound from 122.36 to resume later. Hence, we'd look for strong support below 140.35 to contain downside and bring rebound. On the upside, break of 143.93 will turn bias back to the upside for 148.09 resistance.
In the bigger picture, rise from 122.36 medium term bottom is still expected to extend to of 195.86 to 122.36 at 150.42. And decisive break there could pave the way to 61.8% retracement at 167.78. However, as the cross is starting to lose upside momentum, rejection below 150.42 and break of 135.58 support will indicate reversal and bring deeper fall back to retest 122.36 instead.
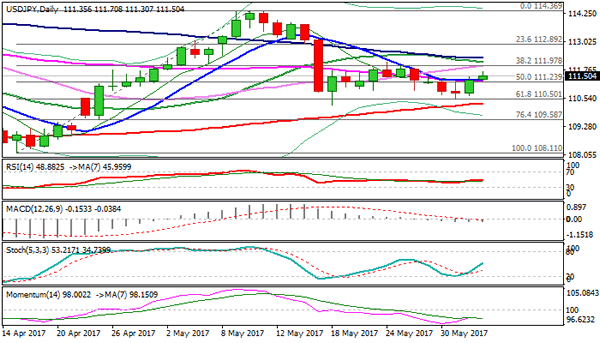
Technical Outlook: USDJPY – Bears Dented 200SMA, Eye Daily Cloud Base
The USDJPY pair posted marginally lower low at 110.28 on Monday, cracking 200SMA support and maintaining pressure on other key supports at 110.23/15 (18 May spike low / daily cloud base).
Recovery attempts were capped at 110.73 in early Europe, with Friday’s long bearish daily candle weighing on near-term action.
Hesitation at 200SMA and ahead of other key supports may keep the pair in extended consolidation, with extended upticks expected to hold below 111.15 (Fibo 61.8% of Fri/Mon fall). Barrier is reinforced by 10/55SMA bear-cross and daily Tenkan-sen, which maintain bearish pressure.
Only sustained break above here would sideline near-term bears and re-focus key barriers at 110.70/80 (Friday’s upside rejection / daily cloud top).
Res: 110.73, 111.15, 111.37, 111.70
Sup: 110.28, 110.15, 109.58, 109.60
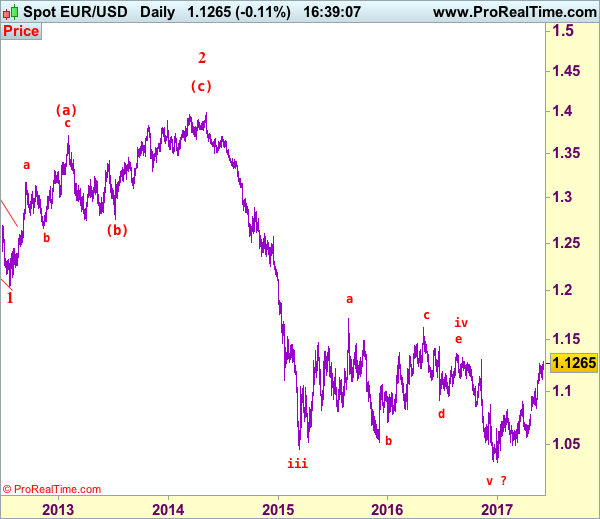
EUR/USD Elliott Wave Analysis
EUR/USD – 1.1268
EUR/USD: Wave (c) of 2 ended at 1.3993 and wave 3 of III has commenced for weakness to 1.0411 (1.236 of wave 1), then 1.0000.
The single currency found renewed buying interest at 1.1109 last week and has risen again, adding credence to our view that recent erratic rise from 1.0340 low has resumed and bullishness remains for this move to extend further gain to previous resistance at 1.1300, however, only a daily close above there would retain bullishness and signal medium term downtrend has ended and headway to another previous resistance at 1.1366 would follow but near term overbought condition should prevent sharp move beyond 1.1430-35 and price should falter below 1.1500, bring retreat later.
Our preferred count on the daily chart remains that a wave (II) from 1.2329 ended at 1.5145 with A-leg ended at 1.4720, followed by wave B at 1.2457, the wave C from there was also a 3 legged move and is labeled as (a): 1.3739, (b): 1.2885, the wave iii of the 5-waver (c) from 1.2885 has ended at 1.4339 and wave iv is a triangle ended at 1.3878 and wave v formed a top at 1.5145. The decline from there is a 5-waver (C) with minor wave (i) of I of (C) ended at 1.4218 with wave (ii) ended at 1.4580, wave (iii) ended at 1.3267 and wave (iv) ended at 1.3692 and wave (v) ended at 1.1876, this is also the low of wave I of (C) and wave II ended at 1.4940, hence wave III is now in progress with a diagonal wave 1 ended at 1.2042, the breach of previous support at 1.1876 (wave I trough) adds credence to our view that the wave 2 has ended at 1.3993, wave 3 has commenced for further weakness to 1.0411, then towards 1.0000.
On the downside, although initial pullback to 1.1205-10 cannot be ruled out, reckon 1.1160-65 would hold and bring another rise later. Below said support at 1.1109 would abort and suggest a temporary top is possibly formed, bring test of previous resistance at 1.1025 but a daily close below there is needed to provide confirmation, bring retracement of recent rise to 1.0975-80 but downside should be limited to 1.0900 and support at 1.0839 should remain intact, bring rebound later.
Recommendation: Buy at 1.1210 for 1.1410 with stop below 1.1110.
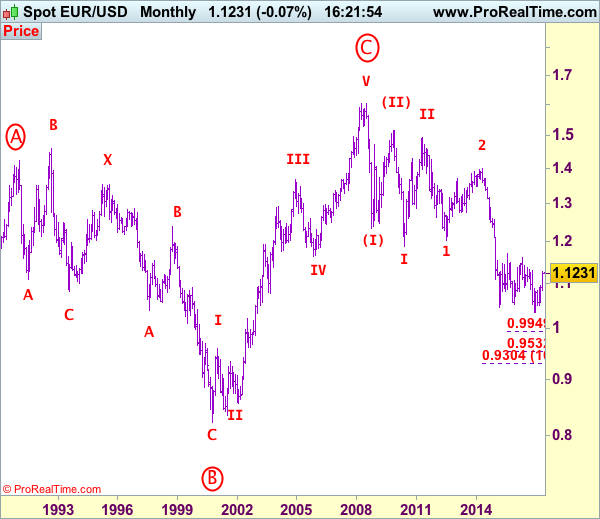
Euro's long-term uptrend started from 0.8228 (26 Oct 2000) with an impulsive structure. The rise from 0.8228 to 0.9593 (5 Jan 2001) is labeled as wave I, the retreat to 0.8352 (6 Jul 2001) is wave II and the rally to 1.3670 (31 Dec 2004) is wave III. Wave IV from there ended at 1.1640 (15 Nov 2005), the subsequent upmove to 1.6040 (July 15, 2008) is treated as wave V, the major selloff from the record high of 1.6040 to 1.2329 (October 27, 2008) signals a reversal has taken place with (I) leg ended at 1.2329 and once (II) ended at 1.5145, wave (III) itself is an extended move with I: 1.1876 and complex wave II ended at 1.4902, wave III has commenced with wave 1 and 2 ended at 1.2042 and 1.3993 respectively, wave 3 of III is now unfolding for weakness towards parity.
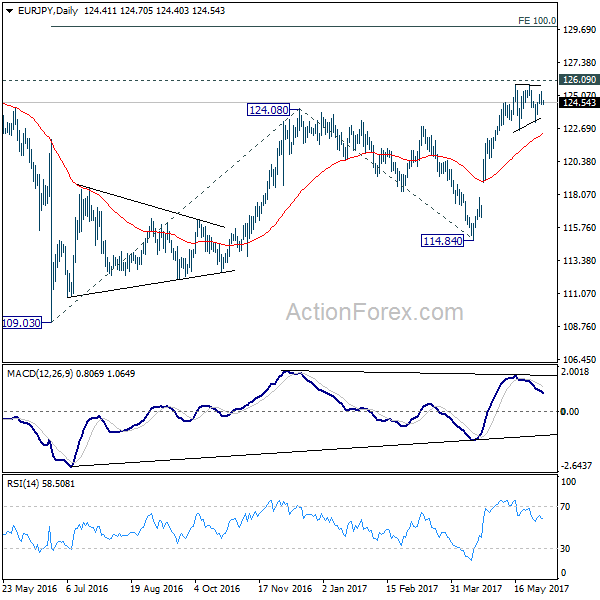
EUR/JPY Daily Outlook
Daily Pivots: (S1) 124.21; (P) 124.76; (R1) 125.10; More...
Intraday bias in EUR?JPY remains neutral for the moment as consolidation from 125.80 is still in progress. In case of another fall, downside should be contained by 38.2% retracement of 114.84 to 125.80 at 121.61 to bring rise resumption. We're staying mildly bullish in the cross. And, break of 126.09 key resistance will extend the whole rebound from 109.03 to 100% projection of 109.03 to 124.08 from 114.84 at 129.89. Nonetheless, firm break of 121.61 will dampen our bullish view and bring deeper fall to 61.8% retracement at 119.02.
In the bigger picture, focus is staying on 126.09 support turned resistance. Decisive break there will confirm completion of the down trend from 149.76. And in such case, rise from 109.20 is at the same degree and should target 141.04 resistance and above. Meanwhile, rejection from 126.09 and break of 114.84 will extend the fall from 149.76 through 109.20 low.