Sample Category Title
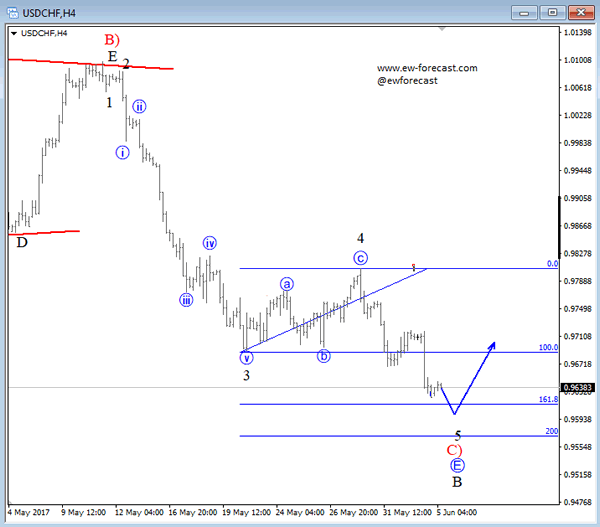
Elliott Wave Analysis: USDCHF Trading In Final Stages Of A Downtrend
On the updated chart of USDCHF we can see that market recently made a three-wave recovery into wave 4 as part of a downtrend, that found resistance at the 0.9807 level. As we can see a new drop happened last week, which we labeled as final wave 5 of C). That said current drop can see limited downside around the Fibonacci ratio of 161.8 or 200% and later ideally make a new reversal higher in impulsive fashion.
Trade Idea: AUD/USD – Buy at 0.7420
AUD/USD – 0.7469
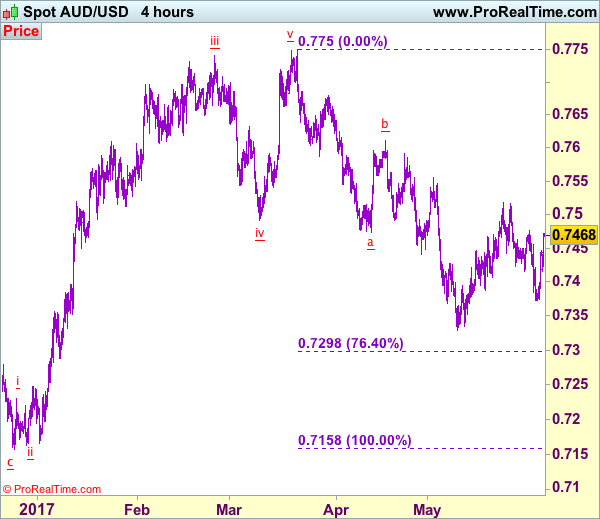
Recent wave: Wave 5 ended at 1.1081 and major correction has commenced for fall to 0.7000 and then towards 0.6500-10
Trend: Near term down
New strategy :
Buy at 0.7420, Target: 0.7570, Stop: 0.7360
Position: -
Target: -
Stop:-
Although aussie fell to as low as 0.7372 late last week, decent demand emerged there and the pair has staged a strong rebound from there, suggesting the retreat from 0.7518 has possibly ended there, above 0.7475-80 would add credence to this view and extend gain to said resistance at 0.7518, break there would signal another leg of rise from 0.7329 low is underway and extend headway towards 0.7592 but resistance at 0.7611 should hold from here due to near term overbought condition.
In view of this, we are looking to buy aussie on dips as 0.7415-20 should limit downside and bring another rise. Below said support at 0.7372 would abort and revive our bearish view that the rebound from 0.7329 has ended at 0.7518 last month, bring further fall towards this level. Only a drop below there would confirm recent decline has resumed and extend weakness to 0.7295-00 (76.4% retracement of 0.7158-0.7750).
On the 4-hour chart, the move from 0.8066 is the wave 5 with i: 0.8860, ii: 0.8315, wave iii is an extended move ended at 1.0183, iv: 0.9706 and wave v has ended at 1.1081 (also the top of entire wave 5). The subsequent selloff is the major correction which is unfolding as ABC-X-ABC and 2nd A leg has ended at 0.8848, followed by a-b-c wave B which ended at 0.9758, hence, 2nd C wave is now in progress and indicated downside target at 0.7000 and 0.6950 had been met, so further fall to 0.6710-20 cannot be ruled out.
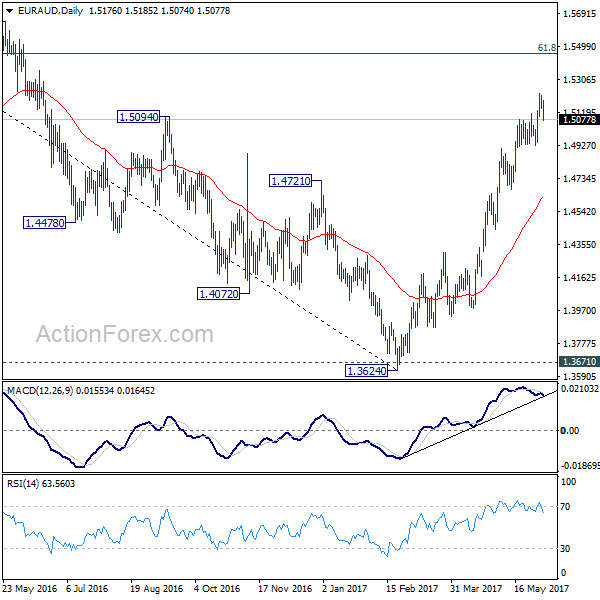
EUR/AUD Daily Outlook
Daily Pivots: (S1) 1.5123; (P) 1.5171; (R1) 1.5198; More...
EUR/AUD dips sharply today and intraday bias is turned neutral with a temporary top formed at 1.5226. Further rally is expected as long as 1.4927 support holds. Above 1.5226 will extend the rally from 1.3624 to next medium term fibonacci level at 1.5455. However, break of 1.4927 will indicate short term topping and bring deeper pull back.
In the bigger picture, price actions from 1.6587 medium term top are viewed as a corrective pattern. Such correction should be completed at 1.3624 after defending 1.3671 key support. Rise from 1.3642 is now expected to target 61.8% retracement of 1.6587 to 1.3624 at 1.5455. Sustained break there will pave the way to retest 1.6587. In any case, outlook will now stay cautiously bullish as long as 1.4669 support holds.

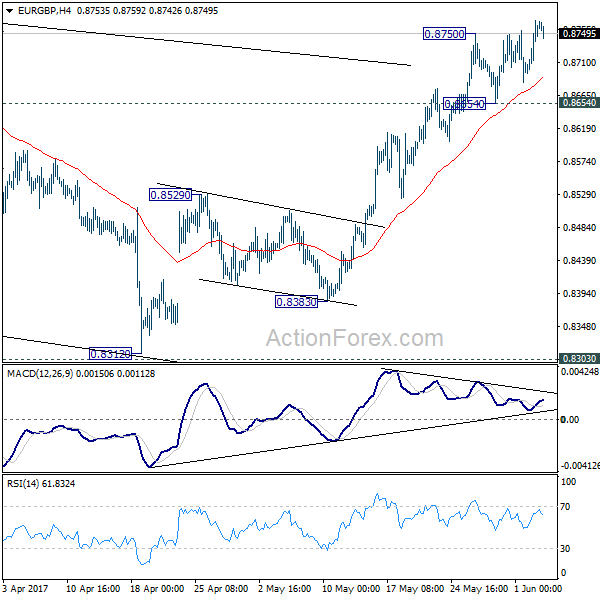
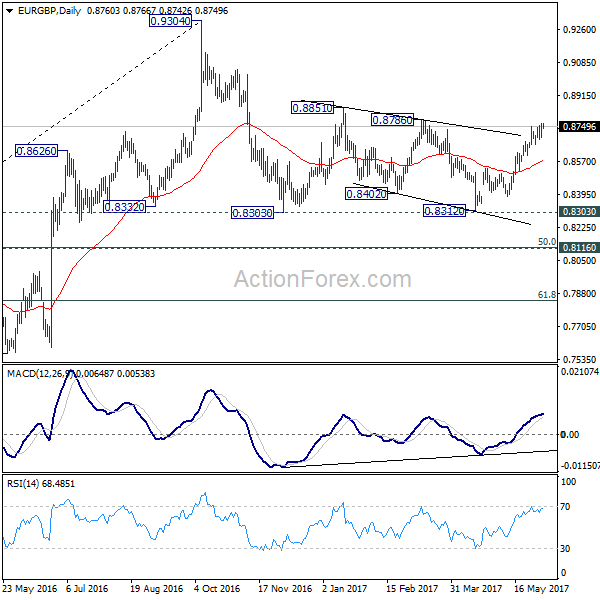
EUR/GBP Daily Outlook
Daily Pivots: (S1) 0.8706; (P) 0.8736; (R1) 0.8779; More...
Intraday bias in EUR/GBP remains on the upside for the moment. Current rise would target 0.8786 resistance and then 0.8851. Decisive break of 0.8851 will pave the way to retest 0.9304 high. On the downside, break of 0.8654 support is needed to indicate short term topping. Otherwise, outlook will say mildly bullish in case of retreat.
In the bigger picture, price actions from 0.9304 are viewed as a medium term corrective pattern. The leg from 0.9304 should have completed after testing 0.8332 structural support. But it's too early to say that larger rise from 0.6935 is resuming. Rejection from 0.9304 will extend the consolidation with another falling leg. Meanwhile, firm break of 0.9304 will target 0.9799 (2008 high). In case of another decline, we'd expect strong support from 0.8116 cluster support (50% retracement of 0.6935 to 0.9304 at 0.8120) to contain downside and bring rebound.
Weak Payrolls Hits The U.S. Dollar
Friday's soft payrolls report sent the U.S. dollar weaker as the U.S. economy was seen adding 138k jobs in May compared to forecasts of 184k. The weak headline print overshadowed the fact that the U.S. unemployment rate fell to a 16-year low at 4.3%.
EURUSD rallied to a fresh 7-month high as a result. Looking ahead, the markets today will focus on the services PMI across the EU, UK and the U.S. In the U.S. the ISM non-manufacturing PMI is expected to slip a little to 57.1 compared to April's 57.5, while in the UK, the services PMI is expected to fall to 55.1 from 55.8 last month.
The weekend terror attacks in London, alongside Trump's withdrawal from the Paris climate accord has also kept the markets on the edge.
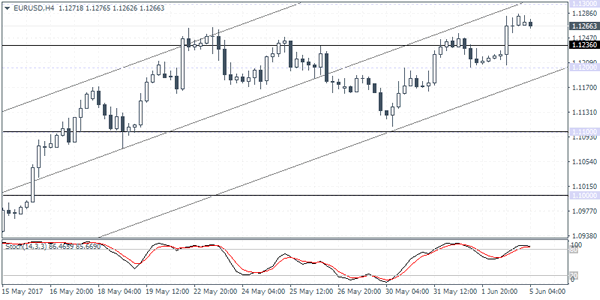
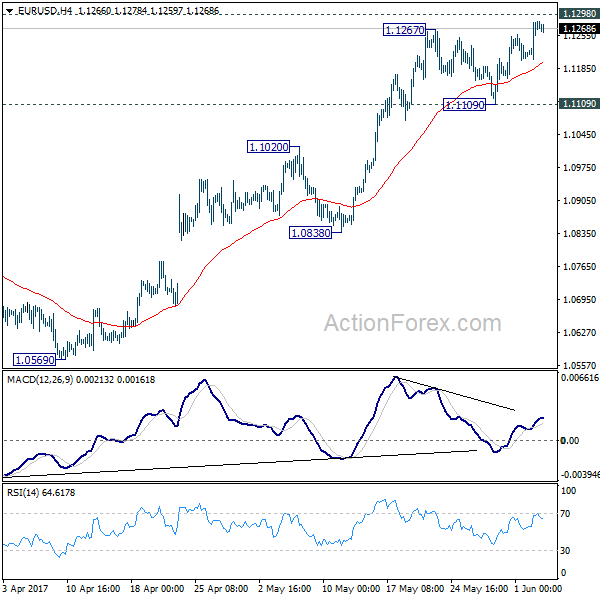
EURUSD intraday analysis
EURUSD (1.1266): The EURUSD is seen currently pulling back lower from Friday's highs but the price action remains biased to the upside. Technical support is seen at 1.1236 which could be tested in the near term but following a decline to this level, the euro could once again push higher. However, with the ECB meeting due this Thursday the EURUSD could remain range bound. A decline below 1.1236 will keep EURUSD moving sideways with the next support seen at 1.1200. Only a strong decline below 1.1200 will signal a move to the downside with 1.1100 and 1.1000 coming into question.
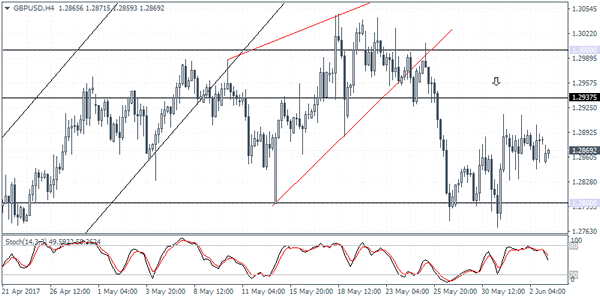
GBPUSD intraday analysis
GBPUSD (1.2869): The British pound opened lower today following the doji close on Friday and Thursday. Price action is likely to stay flat with the UK general elections due this Thursday. Support is seen at 1.2800 which could be tested in the near term. A breakdown below 1.2800 will signal the head and shoulders pattern seen on the daily chart. This will trigger the downside towards 1.2600. On the 4-hour chart, price action is rather volatile although any upside could see the current gap being filled.
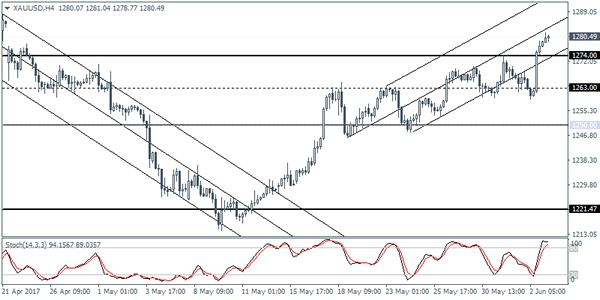
XAUUSD intraday analysis
XAUUSD (1280.49): Gold prices are seen pushing higher from Friday's close. With the current sentiment in the markets, the landscape is broadly favorable for gold prices. With the resistance level at 1274.00 being breached, gold prices are likely to see further upside. However, watch for a potential dip back to 1274.00 where support could now be established. To the upside, 1288, which marks the highs from April 21 will be the next upside target.
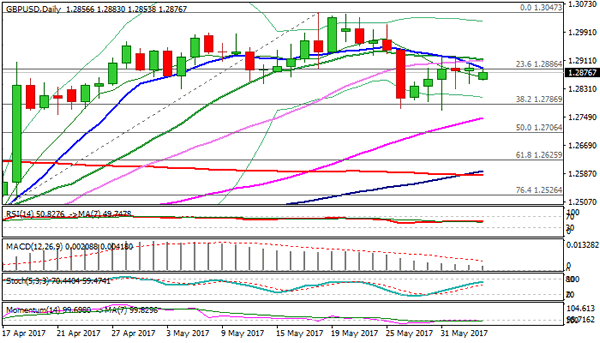
Technical Outlook: GBPUSD – Multiple Bear-Crosses Rising Downside Pressure
Cable is holding steady in early Europe, trading around 1.2870 after hitting session low at 1.2853 after opening of Asia on Monday, underpinned by latest polls that show Conservative Party lead up.
However, Monday's action was so far capped by top of thick hourly cloud, with strong bearish signals emerging on daily chart and seeing risk of deeper pullback.
Recovery rally from 1.2770 base stalled at 1.2900 zone, with double long-legged Dojis on Thu/Fri, signaling that near-term bulls may be running out of steam.
Plethora of strong resistances at 1.2900 zone, provided by daily MA's (10/20/30) and Tenkan-sen/Kijun-sen lines, limited upside attempts and signal rising downside pressure on bear crosses that were formed.
Break below session low (1.2853) and extension through last Thursday's low at 1.2829 (also Fibo 61.8% of 1.2768/1.2920 recovery rally) would further weaken near-term tone and risk return to 1.2770 higher base and breakpoint.
Falling 10SMA so far caps and maintains descend from double upside rejection at 1.2915/20.
Only sustained break above these barriers would neutralize bearish threats and shift near-term bias higher for renewed attacks at psychological 1.3000 barrier.
Res: 1.2883, 1.2903, 1.2920, 1.2946
Sup: 1.2853, 1.2829, 1.2800, 1.2768
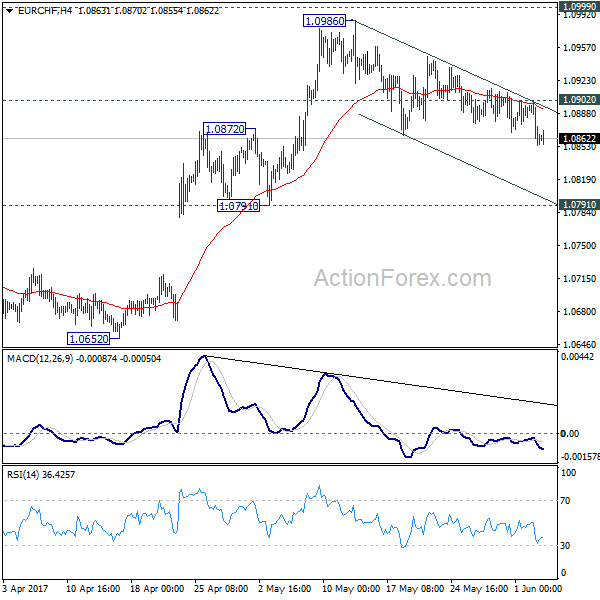
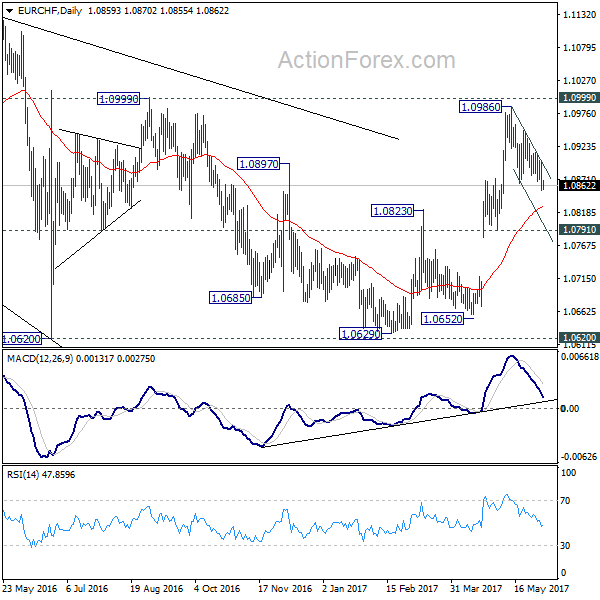
EUR/CHF Daily Outlook
Daily Pivots: (S1) 1.0841; (P) 1.0871; (R1) 1.0885; More...
Intraday bias in EUR/CHF remains neutral as correction from 1.0986 continues. While deeper decline could be seen this week, downside should be contained by 1.0791/0872 support zone, probably around 55 day EMA (now at 1.0828). Rise from 1.0629 is expected to resume later. Above 1.0902 minor resistance will turn bias back to the upside for 1.0986/0999.
In the bigger picture, the price actions from 1.1198 are seen as a corrective move. Such correction could have completed after defending 38.2% retracement of 0.9771 to 1.1198 at 1.0653. Decisive break of 1.0999 resistance will target a test on 1.1198 high. For now, this will be the preferred case as long as 1.0791 support holds.
EUR/USD Candlesticks and Ichimoku Analysis
Weekly
• Last Candlesticks pattern: Shooting star
• Time of formation: 03 May 2016
• Trend bias: Down
Daily
• Last Candlesticks pattern: Shooting star
• Time of formation: 3 May 2016
• Trend bias: Sideways
EUR/USD – 1.1272
The single currency has resumed recent upmove after finding renewed buying interest at 1.1109, retaining our bullishness for recent upmove from 1.0340 low to extend further gain to previous resistance at 1.1300, then 1.1327, however, near term overbought condition should limit upside to previous chart resistance at 1.1366 and reckon 1.1440-50 would hold from here, risk from there is seen for a retreat later.
On the downside, whilst initial pullback towards Friday’s low at 1.1205 cannot be ruled out, reckon the Tenkan-Sen (now at 1.1197) would limit downside and bring another rise later to aforesaid upside targets. Only a drop below said support at 1.1109 would defer and risk test of the Kijun-Sen (now at 1.1062) but a daily close below there is needed to suggest a temporary top is possibly formed instead, risk correction to 1.1025 (previous resistance now support), break there would add credence to this view, then correction to 1.0950-60 would follow, having said that, support at 1.0839 should remain intact.
Recommendation: Hold long entered at 1.1120 for 1.1320 with stop below 1.1105.
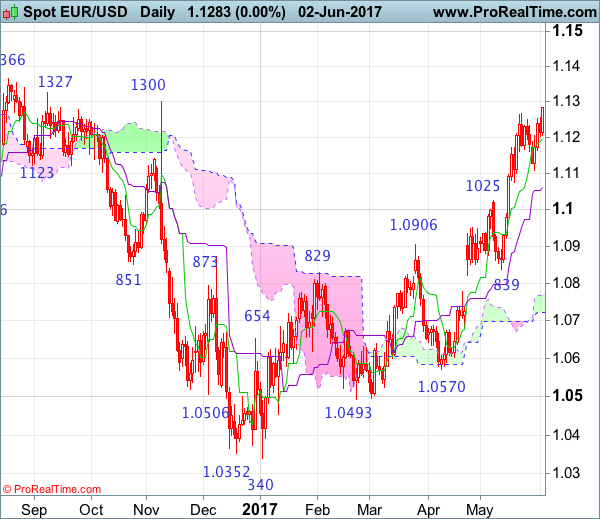
On the weekly chart, last week’s rally from 1.1109 together with the breach of previous resistance at 1.1268 add credence to our view that the rise from 1.0340 low is still in progress and bullishness remains for this erratic upmove to bring a test of previous resistance at 1.1300, however, a break of another previous resistance at 1.1366 is needed to signal early downtrend has ended at 1.0340, bring further subsequent rise to 1.1428 but reckon 1.1500 would hold and price should falter well below another previous chart resistance at 1.1616.
On the downside, expect pullback to be limited to 1.1202-05 support and bring another rise later to aforesaid upside targets. Below said support at 1.1109 would defer and risk weakness to the upper Kumo (now at 1.1061), then test of 1.1025 (previous resistance now support) but break there is needed to signal top is formed instead, bring further fall to 1.0965-70 but 1.0922-28 (previous support and current level of the Tenkan-Sen) should remain intact, price should stay well above another previous support at 1.0839, bring another rise later.
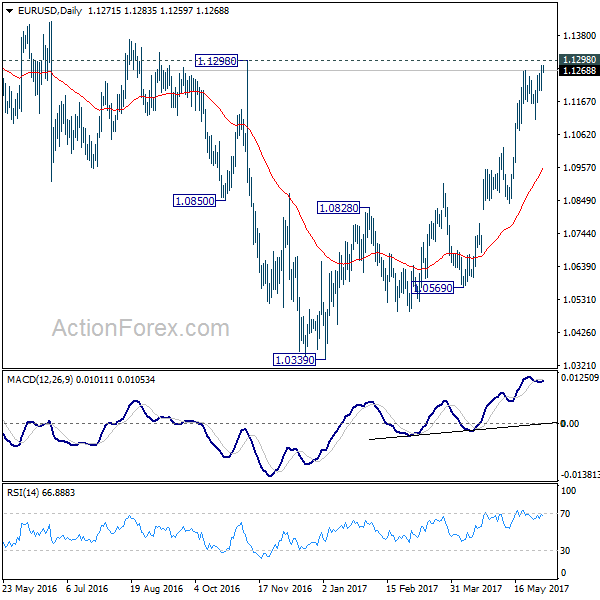
EUR/USD Daily Outlook
Daily Pivots: (S1) 1.1229; (P) 1.1256 (R1) 1.1308; More....
Intraday bias in EUR/USD remains on the upside for 1.1298 resistance. Decisive break there will carry larger bullish implication and target 1.1615 resistance next. Near term outlook will now remain bullish as long as 1.1109 support holds. Nonetheless, we'd stay cautious on rejection from 1.1245/98 (138.2% projection of 1.0339 to 1.0828 from 1.0569 at 1.1245) resistance zone. Break of 1.1109 will indicate short term topping and turn bias back to the downside.
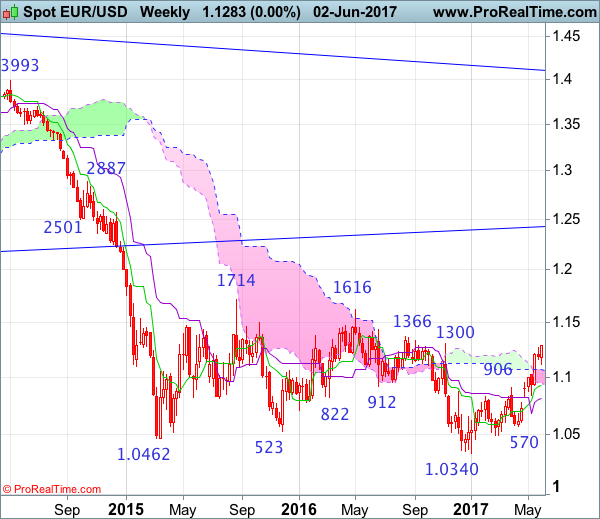
In the bigger picture, the case for medium term reversal continues to build up with EUR/USD staying far above 55 week EMA (now at 1.0888). Also, bullish convergence condition is seen in weekly MACD. Focus will now be on 1.1298 key resistance. Rejection from there will maintain medium term bearishness and would extend the whole down trend from 1.6039 (2008 high). However, firm break of 1.1298 will indicate reversal. In such case, further rally would be seen back to 1.2042 support turned resistance next.
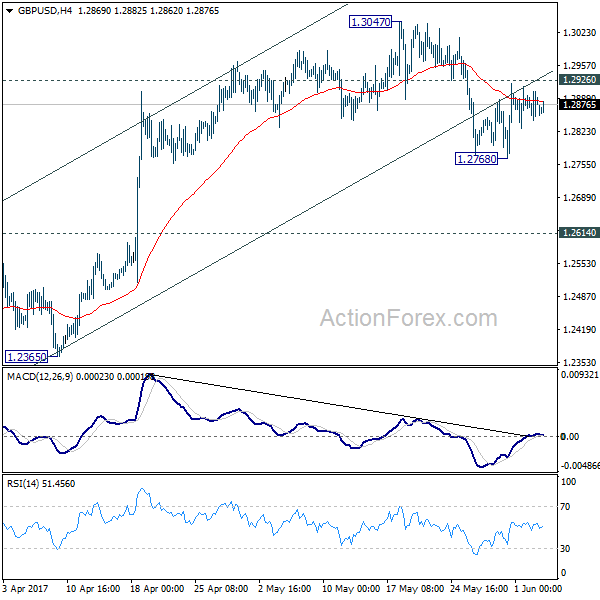
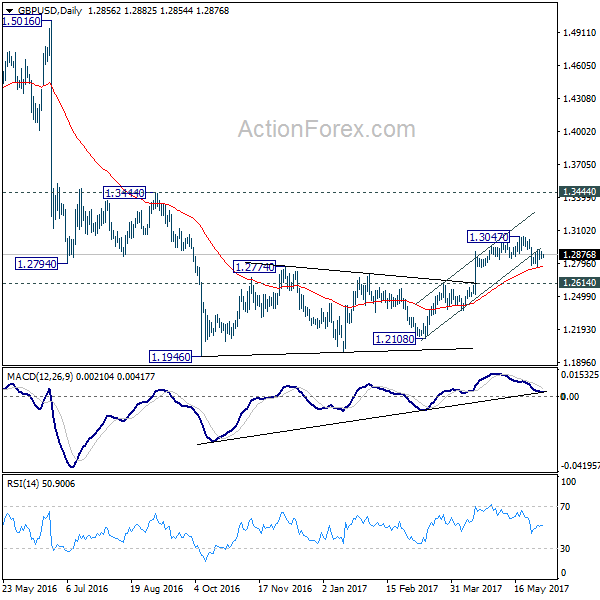
GBP/USD Daily Outlook
Daily Pivots: (S1) 1.2854; (P) 1.2879; (R1) 1.2913; More...
Intraday bias in GBP/USD remains neutral for the moment. With 1.2926 minor resistance intact, near term outlook stays cautiously bearish. below 1.2768 will turn bias to the downside for 1.2614 resistance turned support first. Break there should also indicate completion of whole consolidation pattern from 1.1946 and target a retest on this low. However, break of 1.2926 will turn focus back to 1.3047 instead.
In the bigger picture, fall from 1.7190 is seen as part of the down trend from 2.1161. The rejection from 55 week EMA is maintaining bearishness in the pair. Also, at this point, as long as 1.3444 resistance holds, fall from 1.7190 is still expected to continue. Break of above mentioned 1.2614 support will affirm this bearish case.