
Sample Category Title
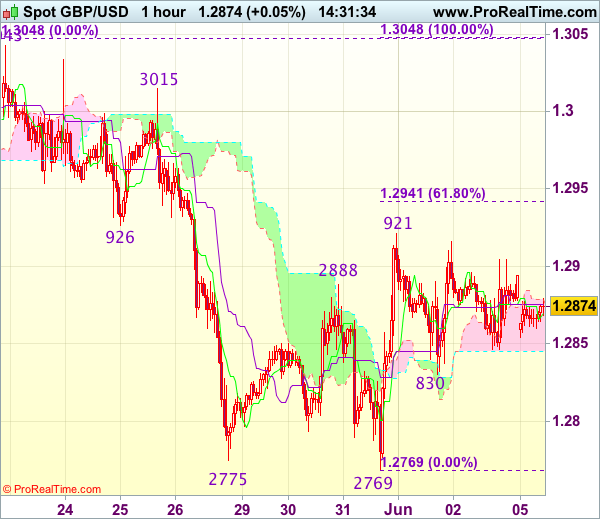
Trade Idea : GBP/USD – Stand aside
GBP/USD - 1.2871
Most recent candlesticks pattern : N/A
Trend : Near term down
Tenkan-Sen level : 1.2870
Kijun-Sen level : 1.2875
Ichimoku cloud top : 1.2875
Ichimoku cloud bottom : 1.2845
New strategy :
Stand aside
Position : -
Target : -
Stop : -
As sterling has remained confined within recent established range, retaining our view that further consolidation below indicated resistance at 1.2921 would be seen and weakness to 1.2845-46 (current level of the lower Kumo and Friday’s low) cannot be ruled out, however, break of 1.2830 support is needed to signal the rebound from 1.2769 has ended, bring further fall to 1.2800 but said support at 1.2769 should remain intact.
On the upside, above 1.2905 would bring another test of 1.2921-26 (resistance and previous support), however, break there is needed to signal low has been formed at 1.2769, bring further gain to 1.2940-45 (61.8% Fibonacci retracement of 1.3048-1.2769) and later towards 1.2970 but overbought condition should cap upside below 1.3000. As near term outlook is mixed, would be prudent to stand aside for now.
Trade Idea : EUR/USD – Hold long entered at 1.1205
EUR/USD - 1.1263
Most recent candlesticks pattern : N/A
Trend : Up
Tenkan-Sen level : 1.1273
Kijun-Sen level : 1.1245
Ichimoku cloud top : 1.1221
Ichimoku cloud bottom : 1.1211
Original strategy :
Bought at 1.1205, Target: 1.1305, Stop: 1.1225
Position : - Long at 1.1205
Target : - 1.1305
Stop : - 1.1225
New strategy :
Hold long entered at 1.1205, Target: 1.1305, Stop: 1.1235
Position : - Long at 1.1205
Target : - 1.1305
Stop : - 1.1235
As euro has eased after marginal rise to 1.1285, suggesting minor consolidation below this level would be seen, however, reckon the Kijun-Sen (now at 1.1245) would hold and bring another rise later, above said resistance at 1.1285 would extend recent upmove to another previous chart resistance at 1.1300, break there would encourage for headway to 1.1340-45 but overbought condition should limit upside to chart point at 1.1366.
In view of this, we are holding on to our long position entered at 1.1205. Only below support at 1.1202 would abort and signal top is formed instead, risk weakness towards indicated support at 1.1164, once this level is penetrated, this would signal recent upmove has ended, bring further fall to 1.1130-40 first.

Trade Idea : USD/JPY – Sell at 111.00
USD/JPY - 110.58
Most recent candlesticks pattern : N/A
Trend : Down
Tenkan-Sen level : 110.52
Kijun-Sen level : 110.99
Ichimoku cloud top : 111.41
Ichimoku cloud bottom : 111.10
New strategy :
Sell at 111.00, Target: 110.00, Stop: 111.35
Position : -
Target : -
Stop : -
As the greenback has recovered after marginal fall to 110.31, suggesting consolidation above this level would be seen and corrective bounce to 110.80 cannot be ruled out, however, reckon the Kijun-Sen (now at 110.99) would limit upside and bring another decline later, below said support at 110.31 would extend recent decline to previous support at 110.24 but break there is needed to provide confirmation that early selloff from 114.37 top has resumed for weakness to 109.90-00 first.
In view of this, would not chase this fall here and would be prudent to sell dollar on recovery as 111.00 should limit upside. Only above the upper Kumo (now at 111.41) would abort and signal low is formed, bring another bounce towards Friday’s high of 111.71.

UK General Election And James Comey Due To Testify To The Senate
Market movers today
We face an important week in terms of the economic data calendar. Not least, Thursday will bring a key session with the ECB meeting, the UK general election and James Comey due to testify to the senate.
In the US, the final figures for PMI services for May and core capital goods orders for April are due out today. Services PMI increased to 54.0 in May, according to the preliminary numbers, whereas core capital goods orders were flat in April. This matches our view that progress is still being made in the services sector, but the manufacturing sector may be taking a breather for now. Today also brings ISM non-manufacturing for May, which has reached very high levels recently and may have run a bit ahead of itself.
In the UK, the PMI services index for May are due out today, which we estimate fell to 54.3 from 55.8. Focus will otherwise be on the polls as we approach Election Day on Thursday.
There are no significant market movers in Scandinavia today. The Danish and Norwegian markets are closed for Whit Monday today and that the Swedish market has half a day ahead of National day tomorrow.
Selected market news
In the US, Friday's nonfarm payrolls report did not live up to market expectations or even our own below-consensus estimates. With a disappointing headline print of 138,000 and negative revisions, it sent 3M average job growth to just 121,000 – the lowest level since 2012. The unemployment rate did drop 0.1pp but it was driven by a shrinking labour force. Irrespectively, at 2.5% y/y, wage growth seems to have lost momentum in recent months despite the lower unemployment rate.
For the Fed, subdued wage growth, low inflation and falling inflation expectations should be a concern amid weaker real data recently. However, while most of the latest FOMC speeches acknowledges this, they still indicate a forthcoming summer hike, which is probably why markets are still pricing in close to a 100% probability of a hike in June or July despite the disappointing non-farm payrolls report. Meanwhile, on release the USD index (i.e. DXY) fell to the lowest level since before the US presidential election. We think it is too early to position for a sustainable move higher in EUR/USD.
In the Middle East, Saudia Arabia, Bahrain, the UAE and Egypt have formed an alliance to block ties with Qatar. The alliance blames Qatar for supporting ‘terrorist groups aimed to destabilize the region'. The oil price has risen somewhat on the increased tension.
Danmarks Nationalbank (DN) FX reserve and central bank balance sheet numbers for May were broadly unchanged to those from April. Hence, DN did not need to intervene ahead of the second round of the French election as EUR/DKK traded close to 7.44 for most of the month. The next focus for the DKK market will be this week's meeting of the ECB, where the market will look for changes to the ECB's forward guidance (not our main scenario, see Fixed Income Markets on page 2). We forecast EUR/DKK at 7.4400 in 3-12M and for DN to keep its key policy rate unchanged at -0.65% on 12M.
Australia’s Services Sector Growth Slowed In May
For the 24 hours to 23:00 GMT, the AUD rose 0.81% against the USD and closed at 0.7441 on Friday.
LME Copper prices declined 1.37% or $77.0/MT to $5559.5/MT. Aluminium prices declined 0.70% or $13.5/MT to $1916.5/MT.
In the Asian session, at GMT0300, the pair is trading at 0.7454, with the AUD trading 0.17% higher from Friday's close.
Overnight data showed that the AiG performance of services index fell to 51.5 in May in Australia, from a level of 53.0 reported in the last month.
Elsewhere, in China, Australia's largest trading partner, the Caixin services PMI rose to a level of 52.8 in May from 51.5 recorded in the previous month, its fastest pace of expansion in four months, amid an increase in new orders.
The pair is expected to find support at 0.7400, and a fall through could take it to the next support level of 0.7345. The pair is expected to find its first resistance at 0.7483, and a rise through could take it to the next resistance level of 0.7511.
Moving forward, investors will closely await the outcome of the Reserve Bank of Australia's monetary policy meeting, scheduled to take place tomorrow.
The currency pair is trading above its 20 Hr and 50 Hr moving averages.

Euro-Zone’s PPI Remained Unchanged In April
For the 24 hours to 23:00 GMT, the EUR rose 0.59% against the USD and closed at 1.1283 on Friday.
On Friday, macroeconomic data showed that the producer price index (PPI) in the Euro-zone remained flat on a monthly basis In April, less than market expectations for a rise of 0.2%. In the prior month, the PPI had registered a drop of 0.3%. On the other hand, producer prices gained 4.3% year-over-year in April across the region, faster than the 3.9% rise in March. Analysts had expected a 4.5% increase for the month.
Meanwhile, Greece's economy expanded by 0.4% in the first quarter of 2017 compared with the fourth quarter of last year, revising upwards a previous preliminary estimate provided in May that showed a 0.1% fall. Following the release of positive GDP growth data, the Greek government urged for a clear solution regarding the debt load issue at the upcoming EuroGroup meeting on 15 June.
The greenback traded lower against its counterparts following the release of the weaker than expected US jobs report. Non-farm payrolls in the nation rose less than expected by 138.0k in May, after climbing by a downwardly revised 174.0k jobs in the previous month, thus raising concerns about the health of the US economic growth and the pace of the Federal Reserve's (Fed) plans to raise interest rates this year. Markets had anticipated an increase of 182.0k jobs. However, the nation's unemployment rate dropped to 4.3%, its lowest level since 2001. Meanwhile, the US average earnings rose 2.5% in May from the previous year, which was below market expectations of 2.6% gain but matched the 2.5% rate in April.
Further, the US trade deficit widened more than expected to $47.6 billion in April, compared to a revised trade deficit of $45.3 billion in the previous month. Market anticipation was for the nation to post a trade deficit of $46.1 billion.
Moreover, Philadelphia Fed Bank President Patrick Harker reiterated his support for two more interest rate hikes this year, stating that the US inflation remains on track to meet the Fed's 2.0% target. However, he commented that the biggest risk to the US economy is the uncertainty over Donald Trump's economic policies.
In the Asian session, at GMT0300, the pair is trading at 1.1273, with the EUR trading 0.09% lower from Friday's close.
The pair is expected to find support at 1.1224, and a fall through could take it to the next support level of 1.1174. The pair is expected to find its first resistance at 1.1304, and a rise through could take it to the next resistance level of 1.1334.
Going ahead, investors will focus on the Euro-zone's final services and composite PMIs, both for May, scheduled to release later in the day. Moreover, the US ISM non-manufacturing PMI and Markit services PMI data, both for the month of May, along with durable goods orders and US factory orders data for April, will be closely watched by traders.
The currency pair is trading above its 20 Hr and 50 Hr moving averages.

UK’s Construction Sector Activity Unexpectedly Rose To A 17-Month High Level In May
For the 24 hours to 23:00 GMT, the GBP marginally declined against the USD and closed at 1.2881 on Friday.
On Friday, data showed that the UK construction PMI unexpectedly climbed to a level of 56.0 in in May, expanding at its fastest rate in 17 months, as low interest rate and strong labour markets underpinned residential building activity. Market had expected the index to fall to 52.6, after it registered a level of 53.1 in the previous month.
In the Asian session, at GMT0300, the pair is trading at 1.2864, with the GBP trading 0.13% lower from Friday's close.
The pair is expected to find support at 1.2839, and a fall through could take it to the next support level of 1.2813. The pair is expected to find its first resistance at 1.2897, and a rise through could take it to the next resistance level of 1.2929.
Ahead in the day, Britain's services sector activity data for May, would be closely assessed by market participants for further direction in the local currency.
The currency pair is trading below its 20 Hr and 50 Hr moving averages.

Japan’s Services Sector Expanded At Its Fastest Pace In Almost 2 Years In May
For the 24 hours to 23:00 GMT, the USD declined 0.89% against the JPY and closed at 110.40 on Friday.
On Friday, data showed that Japan's consumer confidence index rose to 43.6 in May, compared to a reading of 43.2 reported in the previous month.
In the Asian session, at GMT0300, the pair is trading at 110.55, with the USD trading 0.14% higher from Friday's close.
Overnight data indicated that Japan's services PMI rose to a level of 53.0 in May from a reading of 52.2 recorded in the prior month, boosted by a sharp increase in new work, thereby providing further evidence that demand in the world's third-largest economy is picking up.
The pair is expected to find support at 110, and a fall through could take it to the next support level of 109.46. The pair is expected to find its first resistance at 111.40, and a rise through could take it to the next resistance level of 112.26.
With no additional economic data in Japan today, investors will now assess global macroeconomic events.
The currency pair is trading below its 20 Hr and 50 Hr moving averages.

Swiss Franc Trading Lower In The Asian Session
For the 24 hours to 23:00 GMT, the USD declined 0.89% against the CHF and closed at 0.9624 on Friday.
In the Asian session, at GMT0300, the pair is trading at 0.9636, with the USD trading 0.12% higher from Friday’s close.
The pair is expected to find support at 0.9600, and a fall through could take it to the next support level of 0.9563. The pair is expected to find its first resistance at 0.9696, and a rise through could take it to the next resistance level of 0.9755.
The currency pair is trading below its 20 Hr and 50 Hr moving averages.

Canadian International Merchandise Trade Deficit Slid In April
For the 24 hours to 23:00 GMT, the USD declined 0.13% against the CAD and closed at 1.3493 on Friday.
On Friday, data revealed that Canada's international merchandise trade deficit fell to C$0.37 billion in April, compared to a revised international merchandise trade deficit of C$0.94 billion in the previous month. Markets were expecting the nation to post a trade deficit of C$0.02 billion.
Additionally, the nation's labour productivity registered a rise of 1.4% on a quarterly basis in 1Q 2017, higher than market expectations for an advance of 1.2%. In the previous quarter, labour productivity had climbed 0.4%.
In the Asian session, at GMT0300, the pair is trading at 1.3489, with the USD trading a tad lower from Friday's close.
The pair is expected to find support at 1.3464, and a fall through could take it to the next support level of 1.344. The pair is expected to find its first resistance at 1.353, and a rise through could take it to the next resistance level of 1.3572.
Amid a lack of economic data in Canada today, market participants will look forward to global economic releases for further direction in the currency pair.
The currency pair is trading below its 20 Hr and 50 Hr moving averages.
