
Sample Category Title
USD/CAD Daily Outlook
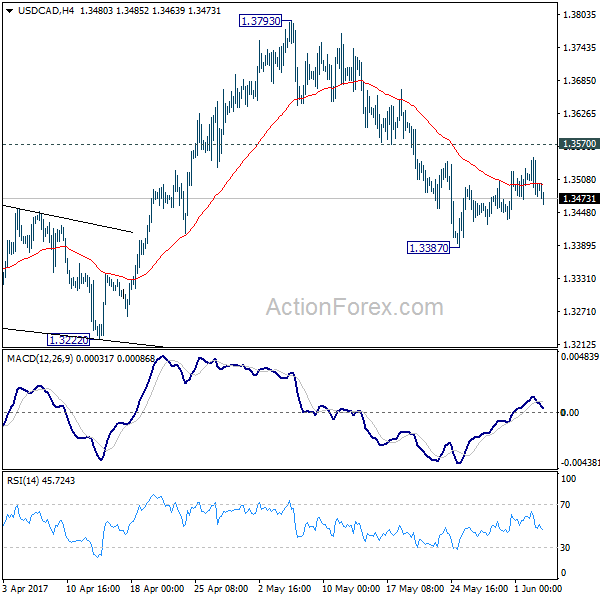
Daily Pivots: (S1) 1.3457; (P) 1.3501; (R1) 1.3524; More....
Intraday bias in USD/CAD remains neutral for the moment as consolidation from 1.3387 continues. In case of another recovery, upside should be limited by 1.3570 resistance and bring fall resumption. We're holding on to the view that rise from 1.2968 has completed. And the larger rise from 1.2460 could have finished too. Below 1.3387 will target 1.3222 support first. Break of 1.3222 will affirm our bearish view and target 1.2968 key support level for confirmation. However, break of 1.3570 will turn focus back to 1.3793 high instead.
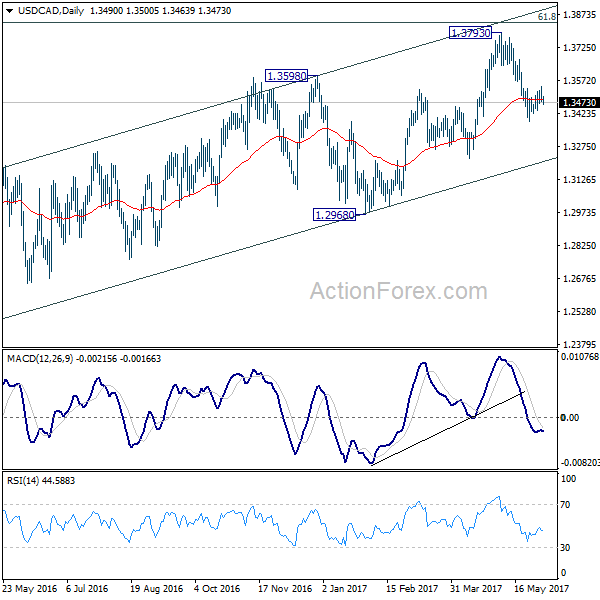
In the bigger picture, price actions from 1.4689 medium term top are seen as a correction pattern. The first leg has completed at 1.2460. Rise from 1.2460 is seen as the second leg and could have completed at 1.3793, ahead of 61.8% retracement of 1.4689 to 1.2460 at 1.3838. Break of 1.3222 should indicate the start of the third leg while further break of 1.2968 should confirm. Nonetheless, sustained trading above 1.3838 would pave the way to retest 1.4689 high.
USD/JPY Candlesticks and Ichimoku Analysis
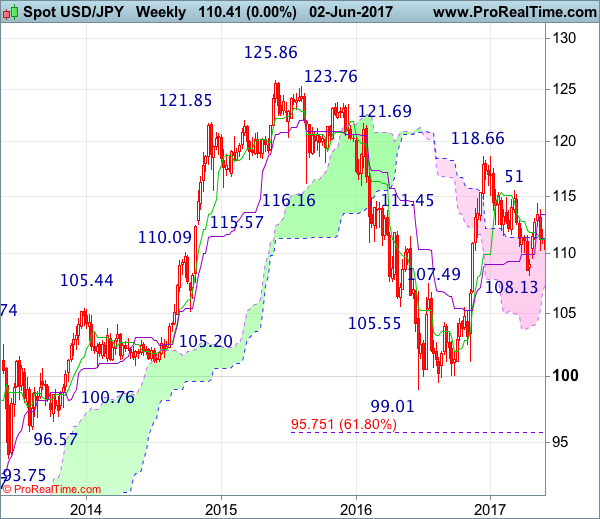
Weekly
• Last Candlesticks pattern: Marubozu
• Time of formation: 14 Nov 2016
• Trend bias: Down
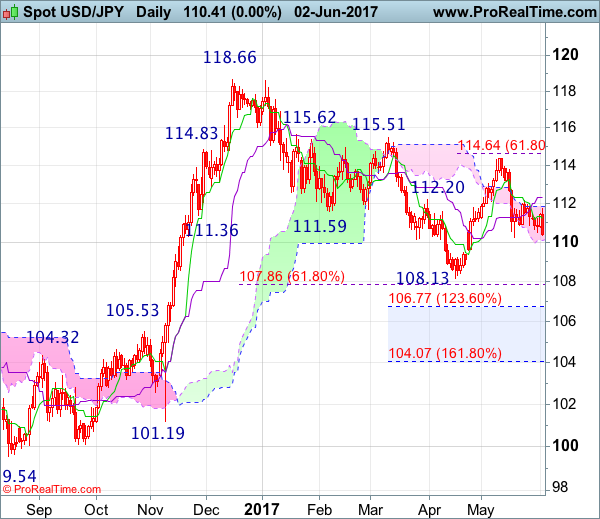
Daily
• Last Candlesticks pattern: Shooting star
• Time of formation: 15 Feb 2017
• Trend bias: Down
USD/JPY – 110.47
Although dollar rebounded initially last week, renewed selling interest emerged at 111.71 and the greenback has dropped sharply on Friday after NFP data, suggesting the fall from 1114.37 is still in progress and retest of previous support at 110.24 is likely, however, a break below there is needed to retain bearishness and extend this fall to 110.00, then towards 109.59 support, having said that, loss of downward momentum should prevent sharp fall below minor support at 108.88 and price should stay well above recent low at 108.13, bring another rebound later.
On the upside, whilst recovery back to 110.90-00 cannot be ruled out, reckon the Tenkan-Sen (now at 111.22) would limit upside and bring another decline later. Only above said resistance at 111.71 (Friday’s high) would abort and prolong consolidation, bring test of resistance at 111.95, then 112.13 resistance, break there would bring a stronger rebound to 112.45-50 (61.8% Fibonacci retracement of 113.85-110.24) and possibly towards 113.10-15 but upside should be limited to 113.85 and price should falter well below indicated resistance at 114.37.
Recommendation : Sell at 111.00 for 109.00 with stop above 112.00.
On the weekly chart, dollar ran into heavy offers at 111.71 and has slipped again, suggesting the retreat from 114.37 is still in progress and break of previous support at 110.24 would bring further decline to 109.59 support, however, a weekly close below there is needed to add credence to our view that the rebound from 108.13 has ended, bring subsequent weakness to 108.85-90 but said support at 108.13 should remain intact. In the event dollar drops below said support at 108.13, this would signal the fall from 118.66 top has resumed and extend weakness towards previous resistance at 107.49.
On the upside, expect recovery to be limited to 111.00 and resistance at 111.71 should hold, bring another decliner. Above said resistance at 111.71 would bring test of previous resistance at 112.13 but only break there would defer and risk a stronger rebound to 112.45-50, then 112.70-75, break there would suggest the retreat from 114.37 has ended instead, bring test of 113.10-15, then towards the Kijun-Sen (now at 113.40) but break of 113.85 is needed to signal another leg of rebound from 110.24 is underway for a retest of 114.37 later. Looking ahead, only break of said resistance at 114.37 would extend the rise from 108.13 to 114.60-65 (61.8% Fibonacci retracement of 118.66-108.13), then towards resistance at 115.51 which is likely to hold from here.
Forex Technical Analysis: EUR/USD, USD/JPY, GBP/USD
EUR/USD
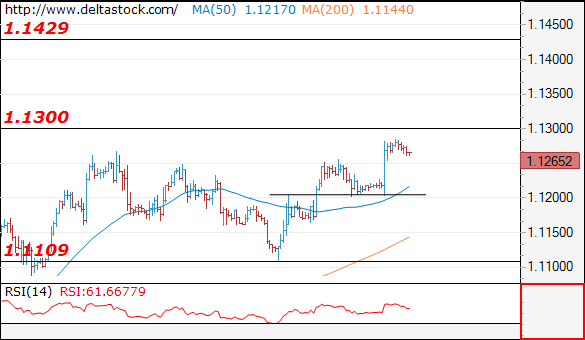
Current level - 1.1265
The outlook remains positive, for a violation of 1.1300 area, towards 1.1430 hurdle. Crucial on the downside is 1.1205 low.
| Resistance | Support | ||
| intraday | intraweek | intraday | intraweek |
| 1.1300 | 1.1360 | 1.1205 | 1.1022 |
| 1.1430 | 1.1610 | 1.1165 | 1.0838 |
USD/JPY
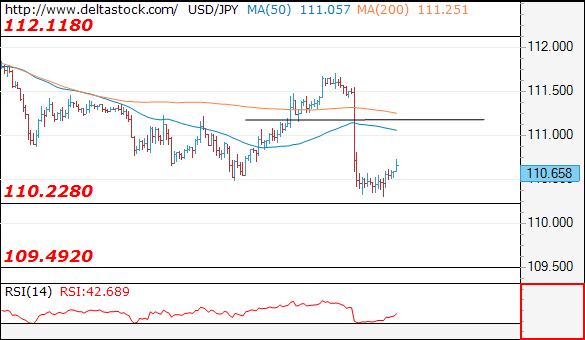
Current level - 110.65
The recent slide through 111.15 shows a negative outlook, for a break through 110.20, towards 109.50 area.
| Resistance | Support | ||
| intraday | intraweek | intraday | intraweek |
| 111.15 | 114.30 | 110.20 | 109.40 |
| 112.10 | 115.60 | 109.50 | 108.12 |
GBP/USD
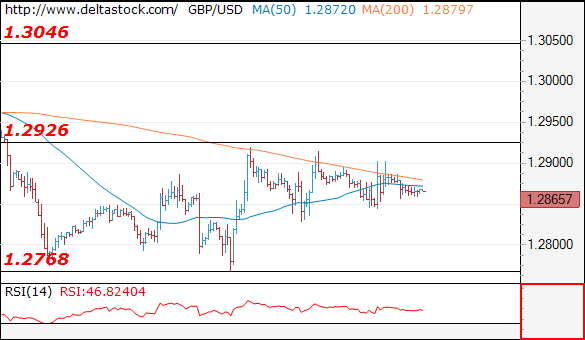
Current level - 1.2865
The intraday bias is neutral and only a break through 1.2930 will signal, that an uptrend unfolds, toward 1.3050.
| Resistance | Support | ||
| intraday | intraweek | intraday | intraweek |
| 1.2930 | 1.3120 | 1.2770 | 1.2770 |
| 1.3050 | 1.3500 | 1.2705 | 1.2610 |
Technical Outlook: EURUSD Remains Biased Higher, Extended Consolidation Seen Likely Ahead Of ECB
The Euro is consolidating under Friday's fresh high at 1.1285 which was touched again in early Asian session on Monday. Overall structure is bullish and underpinned by Friday's long green candle and eventual break and close above previous high at 1.1268, posted on 23 May, after the Euro rallied on Friday, boosted by downbeat US jobs numbers.
Limited correction is seen preceding fresh upside action which eyes targets at 1.1300 (round-figure / length of current fifth wave of five-wave cycle from 1.0820) and 1.1313 (Fibo 76.4% of 1.1614/1.0340 descend).
Solid supports lay at 1.1254 and 1.1236 (Fibo 38.2% and 61.8% of Friday's post US NFP rally respectively) with extended dips expected to find ground at 1.1213/1.1197 support zone, formed by 10SMA / Daily Tenkan-sen.
The pair is likely to extend consolidative phase until ECB policy meeting (08 June). Hawkish ECB (last week's speculation of reducing QE, forward guidance change and possible early rate hike) would spark stronger rise and expose targets at 1.1366/1.1428.
Conversely, loss of 1.1200 handle would soften near-term structure.
Res: 1.1285, 1.1313, 1.1366, 1.1400
Sup: 1.1254, 1.1236, 1.1213, 1.1197
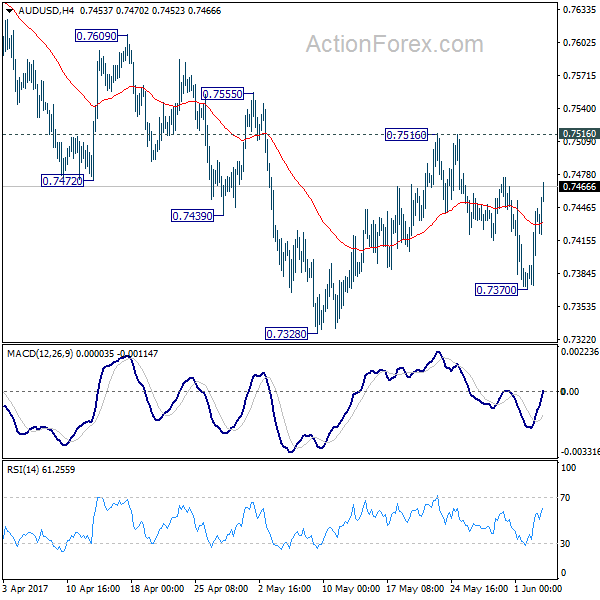
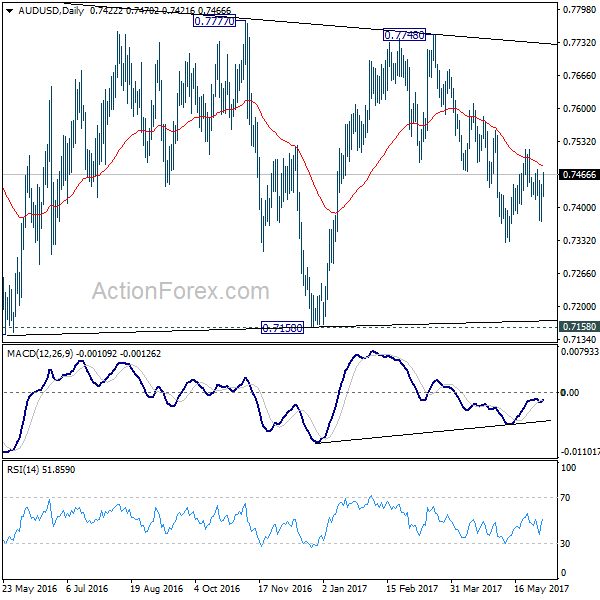
AUD/USD Daily Outlook
Daily Pivots: (S1) 0.7393; (P) 0.7419; (R1) 0.7467; More...
AUD/USD's recovery's from 0.7370 extends higher today but it's staying in range of 0.7370/7516. Intraday bias remains neutral for the moment. As long as 0.7516 resistance holds, deeper fall is expected. Below 0.7328 will resume the decline from 0.7748 to 0.7144/7158 support zone. On the upside, break of 0.7516 resistance will indicate near term reversal and turn bias back to the upside.
In the bigger picture, we're still treating price actions from 0.6826 low as a corrective pattern. And, as long as 38.2% retracement of 0.9504 to 0.6826 at 0.7849 holds, long term down trend from 1.1079 is expected to resume sooner or later. Break of 0.6826 low will target 0.6008 key support level. However, firm break of 0.7849 will indicate that rise from 0.6826 is developing into a medium term rebound, rather than a sideway pattern. In such case, stronger rise should be seen to 55 month EMA (now at 0.8091) and above.
Forex Trading Subdued in Holiday Markets, AUD Lifted by Chinese Data
The forex markets are generally quite quiet today with many European countries on holiday. Nonetheless, Aussie is trading broadly higher as boosted by Chinese services data. Canadian Dollar also strengthens as oil price is lifted mildly by geopolitical news in Middle East. The greenback tried to recovery against Europeans and Yen but lost momentum in early European session. Meanwhile, Sterling showed little reaction to the terrorist attack in London as markets are holding their breath ahead of UK election. Services data are the main focus for today but markets will look through them to key events on Thursday.
UK election race tightens up
The race continued to tighten up ahead of UK General Election on Thursday. According to a poll by Survation for The Mail on Sunday, support for Conservative dropped further to 40%, while that for Labour rose to 39%. That is, the Tories are only have a 1-point lead over Labour. On other hand other, a ComRes poll showed that support for Conservatives rose one to 47% and that for Labour also rose one 35%. In that case, Tories still maintained a 12-point lead. In the middle, Opinium poll for the Observer found that support for Conservatives was down 2 points to 43%, and that for Labour was up 2 to 37%. That was a 6-point lead.
While the Conservatives are still leading, the trend is certainly worrying for them. But one should also take into consideration that the support for Labour leader Jeremy Corbyn is still far off Prime Minister Theresa May. And that could be the determining factor for the election. Nonetheless, a hung parliament is a realistic possibility and a Labour win can certainly not be ruled out. And without a landslide Conservative win, it would be a disgrace to PM May as her rationale to call for the snap election in the first place was to consolidate support for the Conservative Party, and more importantly for herself, in the Brexit negoation with the EU.
Meanwhile, despite suggestions to delay the election, senior Cabinet minister David Davis indicated that there is no way to legally suspend or delay the general election following Saturday's terrorist attack at London Bridge. Prime Minister May affirmed on Sunday morning that the election "will go ahead as planned".
Euro firm ahead of ECB
Euro stays firm as markets await ECB rate decision later in the week. Recent strong confidence data and hard data have raised speculations that the ECB would change to a less dovish tone in the upcoming meeting on June 8. Hopes are rising that the policymakers would take a more benign view of the economy. They might even drop some of the commitments to increase stimulus, if needed. Tapering announcement is unlikely in June. However, a more upbeat ECB might pave the way for a tapering announcement at the September 7 meeting.
Saudi Arabia, Egypt, Bahrain, and the UAE cut ties with Qatar
Saudi Arabia, Egypt, Bahrain, and the United Arab Emirates cut the diplomatic ties with Qatar, for the latter on its tie to terrorism. In particular, Saudi Arabia's state news agency accused Qatar of embracing "multiple terrorist and sectarian groups aimed at disturbing stability in the region, including the Muslim Brotherhood, ISIS (Islamic State) and al-Qaeda". The Emirates news agency staid that Qatar "support, funding and embrace of terrorist, extremist and sectarian organizations." WTI crude oil trades mildly up today as markets are starting to reprice-in some geopolitical risks. But it's struggling to gain any momentum back to 50 handle.
On the data front...
Australia TD securities inflation rose 0.0% mom in May. China Caixin PMI services rose to 52.8 in May. UK PMI services will be the main feature in European session. Eurozone will also release PMI services final. US will release ISM non-manufacturing, factory orders, labor market conditions index and non-farm productivity.
AUD/USD Daily Outlook
Daily Pivots: (S1) 0.7393; (P) 0.7419; (R1) 0.7467; More...
AUD/USD's recovery's from 0.7370 extends higher today but it's staying in range of 0.7370/7516. Intraday bias remains neutral for the moment. As long as 0.7516 resistance holds, deeper fall is expected. Below 0.7328 will resume the decline from 0.7748 to 0.7144/7158 support zone. On the upside, break of 0.7516 resistance will indicate near term reversal and turn bias back to the upside.
In the bigger picture, we're still treating price actions from 0.6826 low as a corrective pattern. And, as long as 38.2% retracement of 0.9504 to 0.6826 at 0.7849 holds, long term down trend from 1.1079 is expected to resume sooner or later. Break of 0.6826 low will target 0.6008 key support level. However, firm break of 0.7849 will indicate that rise from 0.6826 is developing into a medium term rebound, rather than a sideway pattern. In such case, stronger rise should be seen to 55 month EMA (now at 0.8091) and above.
Economic Indicators Update
| GMT | Ccy | Events | Actual | Forecast | Previous | Revised |
|---|---|---|---|---|---|---|
| 1:00 | AUD | TD Securities Inflation M/M May | 0.00% | 0.50% | ||
| 1:00 | AUD | TD Securities Inflation Y/Y May | 2.80% | 2.60% | ||
| 1:45 | CNY | Caixin PMI Services May | 52.8 | 51.4 | 51.5 | |
| 7:45 | EUR | Italy Services PMI May | 55.3 | 56.2 | ||
| 7:50 | EUR | France Services PMI May F | 58 | 58 | ||
| 7:55 | EUR | Germany Services PMI May F | 55.2 | 55.2 | ||
| 8:00 | EUR | Eurozone Services PMI May F | 56.2 | 56.2 | ||
| 8:30 | GBP | Services PMI May | 55 | 55.8 | ||
| 12:30 | USD | Non-Farm Productivity Q1 F | -0.20% | -0.60% | ||
| 12:30 | USD | Unit Labor Costs Q1 F | 2.40% | 3.00% | ||
| 14:00 | USD | ISM Non-Manufacturing Composite May | 57.1 | 57.5 | ||
| 14:00 | USD | Labor Market Conditions Index Change May | 3 | 3.5 | ||
| 14:00 | USD | Factory Orders Apr | -0.20% | 0.20% |
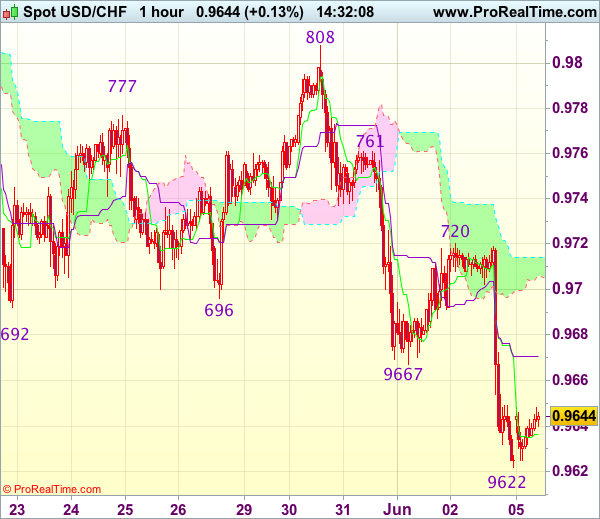
Trade Idea : USD/CHF – Sell at 0.9685
USD/CHF - 0.9636
Most recent candlesticks pattern : N/A
Trend : Near term down
Tenkan-Sen level : 0.9637
Kijun-Sen level : 0.9671
Ichimoku cloud top : 0.9714
Ichimoku cloud bottom : 0.9706
Original strategy :
Sell at 0.9685, Target: 0.9585, Stop: 0.9720
Position : -
Target : -
Stop : -
New strategy :
Sell at 0.9685, Target: 0.9585, Stop: 0.9720
Position : -
Target : -
Stop : -
Dollar’s recovery after marginal fall to 0.9622 suggests minor consolidation would be seen and corrective bounce to the Kijun-Sen (now at 0.9671) cannot be ruled out, however, reckon upside would be limited to 0.9685-90 and bring another decline later, below said support at 0.9622 would extend recent decline to 0.9600-05 (50% projection of 1.0100-0.9692 measuring from 0.9808) but oversold condition should limit downside to 0.9570 and price should stay well above support at 0.9550, bring rebound later.
In view of this, we are looking to sell dollar on recovery as 0.9685-90 should limit upside. Only break of resistance at 0.9720 would abort and signal a temporary low is formed instead, bring a stronger rebound to 0.9750 and then 0.9770 but price should falter below resistance at 0.9808.
Market Update – Asian Session: China Services PMI Soothes Soft Manufacturing Data
Asia Mid-Session Market Update: China Services PMI soothes soft manufacturing data; World Bank maintains global outlook; Oil rallies on Saudi Arabia-Qatar row
Friday US Session Highlights
(US) MAY UNEMPLOYMENT RATE: 4.3% V 4.4%E (lowest since May 2001)
(US) MAY CHANGE IN NONFARM PAYROLLS: +138K V +182KE; (birth/death adjustment +230)
(US) MAY AVERAGE HOURLY EARNINGS M/M: 0.2% V 0.2%E; Y/Y: 2.5% V 2.6%E; AVERAGE WEEKLY HOURS: 34.4 V 34.4E
(US) White House econ adviser Cohn: not worried about slowing job growth; we must create a better US jobs market
(US) Atlanta Fed cuts Q2 GDP to 3.4% from 4.0% on 6/1
Weekend corporate activity
HLF: Cuts Q2 guidance $0.75-0.95 v $1.00e (prior $0.88-1.08); Volume -8% to -4% y/y (prior -5% to -1%); Cuts FY17 $4.10-4.50 v $4.50e (prior $4.25-4.65); Volume -1% to +2% y/y (prior 2-5%)
P: Verizon may be interested in making a $100M investment in Pandora if it fails to reach sale to SiriusXM this week - NY Post
Politics
(RU) Russia President Putin denies knowledge of any attempts to set up back-channel discussions with Trump administration officials - US press
(US) White House not planning to give Congress a detailed tax reform draft until the August recess - Politico
(JP) Survey from Japan national broadcaster TBS saw PM Abe's cabinet approval rating fall 8.9 to 54.4%; lowest in over a year - press
(MX) MXN rallies from 18.82 to 18.72 on projections of a narrow win for ruling party in Mexico's key governor race - press
(UK) Survation/Mail poll on Parliamentary elections: Support for UK Conservatives at 40% (-6 ppt); Labour at 39% (+5 ppt)
Key economic data:
(CN) CHINA MAY CAIXIN PMI SERVICES: 52.8 V 51.5 PRIOR (4 month high); COMPOSITE: 51.5 V 51.2 PRIOR
(HK) HONG KONG MAY COMPOSITE PMI: 50.5 V 51.1 PRIOR (2nd straight expansion)
(AU) AUSTRALIA Q1 COMPANY OPERATING PROFIT Q/Q: 6.0% (4th straight quarter of increase) V 5.0%E; INVENTORIES Q/Q: 1.2% V 0.5%E
(AU) AUSTRALIA MAY ANZ JOB ADVERTISEMENTS M/M: 0.4% V 1.5% PRIOR (3rd straight increase)
(AU) AUSTRALIA MAY MELBOURNE INSTITUTE INFLATION M/M: 0.0% (3-month low) V 0.5% PRIOR; Y/Y: 2.8% V 2.6% PRIOR
(AU) AUSTRALIA MAY AIG PERF OF SERVICES INDEX: 51.5 V 53.0 PRIOR (3rd consecutive expansion. 3-month low
(SG) SINGAPORE MAY PMI COMPOSITE: 51.4 V 52.6 PRIOR
Asia Session Notable Observations
Asian indices slide despite the gains on Wall St as investors digest mixed US employment data on Friday. Outlook for June hike remains above 90%, though the case for 3 hikes total in 2017 stands more damaged by slow wage growth.
GBP down slightly in the wake of another terror attack in London that left 7 people dead; UK polls ahead of June 8th elections also continue to tighten.
China May Caixin Services PMI hits a 4-month high and Composite rises slightly. Among Services components, expansion in new orders was the most marked in the year-to-date, employment continued to increase but at slower pace, and input price inflation picked up from 6-month lows.
China Shenhua (China's largest coal miner) speculated to merge with GD Power Development; Both halted on A-shares.
World Bank maintained 2017 global GDP growth forecast at 2.7% and 2018 at 2.9%; WB also cut US by 0.1pt, Affirmed China at 6.5%, and raised EU and Japan by 0.2pts and 0.6pts respectively, citing recovery in industrial and a pick-up in global trade.
Oil rises nearly 1.5% on Saudi-Qatar spat. Saudi Arabia, Bahrain, and Egypt reportedly cut diplomatic relations after leaked tape where Qatari Emir Tamim bin Hamad al-Thani criticized Gulf rhetoric against Iran. Qatar also alleged to have provided assistance to terrorist organizations.
Speakers and Press
China
(CN) China Securities Regulatory Commission (CSRC) rejected IPO application from 9 out of 64 companies in May - Chinese press
(CN) China Securities Regulatory Commission (CSRC) announced new rules to curb disorderly stock sales
(CN) China Securities Regulatory Commission (CSRC) announced new rules to curb disorderly stock sales
(CN) China to accelerate approvals for green car subsidies, approving ~300 more green energy vehicle models to receive subsidies - Chinese press
(CN) China plans to continue its restructuring of SOEs in the coal power and steel sectors – Chinese Press
Japan
(JP) BoJ approx doubles ETF holdings in 1 year to ¥15.9T v ¥8.83T y/y - Nikkei
Australia/New Zealand
(AU) Australia's Queensland has commissioned an energy security taskforce to ensure state’s power system is secure during peak demand over 2017-18 and 2018-19 summers
Asian Equity Indices/Futures (00:30ET)
Nikkei flat, Hang Seng -0.3%, Shanghai -0.5%, ASX200 -0.7%, Kospi +0.1%
Equity Futures: S&P500 -0.1%; Nasdaq -0.1%, Dax closed, FTSE100 -0.2%
FX ranges/Commodities/Fixed Income (00:30ET)
EUR 1.1265-1.1285; JPY 110.30-110.65; AUD 0.7420-0.7460; NZD 0.7115-0.7145; GBP 1.2855-1.2875
June Gold +0.3% at 1,284/oz; July Crude Oil +1.3% at $48.26/brl; July Copper -0.5% at $2.56/lb
SPDR Gold Trust ETF daily holdings rise 3.5 tonnes to at 851 tonnes; first rise since May 22nd
iShares Silver Trust ETF daily holdings fall to 10,601 tonnes from 10,605 tonnes prior; 3rd straight decline
(SA) Saudi Arabia, Bahrain, and Egypt said to have cut diplomatic relations with Qatar after leaked tape where Qatari Emir Tamim bin Hamad al-Thani criticized Gulf rhetoric against Iran; July WTI crude oil rises 1.5% above $48.35/brl
(US) Weekly Baker Hughes US Rig Count: 916 v 908 w/w (+0.9%) (20th straight weekly rise)
(CN) PBOC SETS YUAN MID POINT AT 6.7935 V 6.8070 PRIOR; 4th straight firmer Yuan fix; Strongest Yuan fix since Nov 10th
(CN) PBOC to inject combined CNY70B v CNY50B prior
(AU) Australia Finance Ministry (AOFM) sells A$400M in 3.25% 2029 bonds; avg yield 2.5171%; bid-to-cover 4.16x
(KR) South Korea sells 3-yr Govt bonds; avg yield 1.65%
Asia equities/Notables / movers
Australia
Fortescue (FMG) +0.3%; CEO: China steel demand remains strong
Tatts (TTS) -0.7%; ACCC not satisfied Tabcorp/Tatts merger is in best interest of public - AFR
Sirtex (SRX) -2.3%; Presents Phase 3 data from SIRVENIB study
Hong Kong
China Gas Holdings (384) +2.4%; Guides FY17
Guangzhou R&F Properties (2777) +0.5%; May sales
China Vanke (2202) -0.7%; May sales
IPE Group Limited (929) -1.5%; Guides Jan-Apr
Japan
Eisai (4523) +1.9%; Further Study of Combination of Eisai's Lenvatinib and Merck's Pembrolizumab in Previously Treated Patients with Metastatic Endometrial Cancer Supported by Interim Analysis of Ongoing Phase1b/2 Trial
ANA (9202) +0.3%; ANA and JAL to cut international route fuel surcharges by 50% in Aug - Japanese Press
Toshiba (6502) -0.6%; Foxconn Chairman: We have backing from Apple and Amazon in bid for Toshiba's memory chip unit - Nikkei
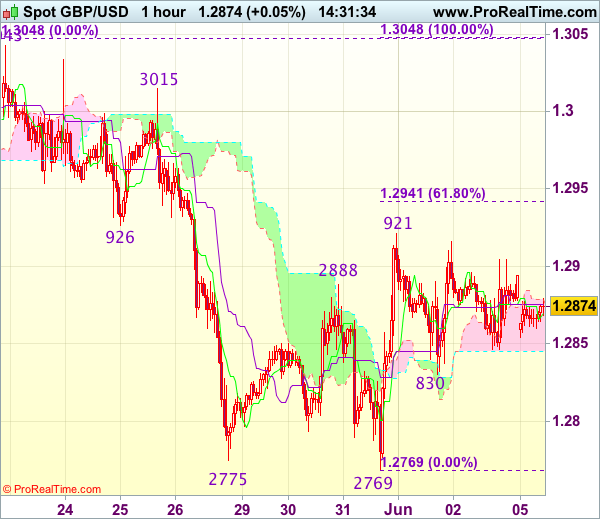
Trade Idea : GBP/USD – Stand aside
GBP/USD - 1.2871
Most recent candlesticks pattern : N/A
Trend : Near term down
Tenkan-Sen level : 1.2870
Kijun-Sen level : 1.2875
Ichimoku cloud top : 1.2875
Ichimoku cloud bottom : 1.2845
New strategy :
Stand aside
Position : -
Target : -
Stop : -
As sterling has remained confined within recent established range, retaining our view that further consolidation below indicated resistance at 1.2921 would be seen and weakness to 1.2845-46 (current level of the lower Kumo and Friday’s low) cannot be ruled out, however, break of 1.2830 support is needed to signal the rebound from 1.2769 has ended, bring further fall to 1.2800 but said support at 1.2769 should remain intact.
On the upside, above 1.2905 would bring another test of 1.2921-26 (resistance and previous support), however, break there is needed to signal low has been formed at 1.2769, bring further gain to 1.2940-45 (61.8% Fibonacci retracement of 1.3048-1.2769) and later towards 1.2970 but overbought condition should cap upside below 1.3000. As near term outlook is mixed, would be prudent to stand aside for now.
Trade Idea : EUR/USD – Hold long entered at 1.1205
EUR/USD - 1.1263
Most recent candlesticks pattern : N/A
Trend : Up
Tenkan-Sen level : 1.1273
Kijun-Sen level : 1.1245
Ichimoku cloud top : 1.1221
Ichimoku cloud bottom : 1.1211
Original strategy :
Bought at 1.1205, Target: 1.1305, Stop: 1.1225
Position : - Long at 1.1205
Target : - 1.1305
Stop : - 1.1225
New strategy :
Hold long entered at 1.1205, Target: 1.1305, Stop: 1.1235
Position : - Long at 1.1205
Target : - 1.1305
Stop : - 1.1235
As euro has eased after marginal rise to 1.1285, suggesting minor consolidation below this level would be seen, however, reckon the Kijun-Sen (now at 1.1245) would hold and bring another rise later, above said resistance at 1.1285 would extend recent upmove to another previous chart resistance at 1.1300, break there would encourage for headway to 1.1340-45 but overbought condition should limit upside to chart point at 1.1366.
In view of this, we are holding on to our long position entered at 1.1205. Only below support at 1.1202 would abort and signal top is formed instead, risk weakness towards indicated support at 1.1164, once this level is penetrated, this would signal recent upmove has ended, bring further fall to 1.1130-40 first.
