Sample Category Title
EUR/JPY Daily Outlook
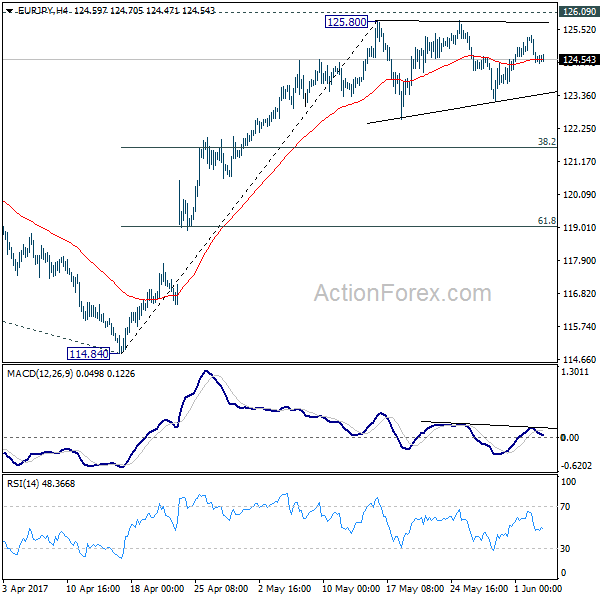
Daily Pivots: (S1) 124.21; (P) 124.76; (R1) 125.10; More...
Intraday bias in EUR?JPY remains neutral for the moment as consolidation from 125.80 is still in progress. In case of another fall, downside should be contained by 38.2% retracement of 114.84 to 125.80 at 121.61 to bring rise resumption. We're staying mildly bullish in the cross. And, break of 126.09 key resistance will extend the whole rebound from 109.03 to 100% projection of 109.03 to 124.08 from 114.84 at 129.89. Nonetheless, firm break of 121.61 will dampen our bullish view and bring deeper fall to 61.8% retracement at 119.02.
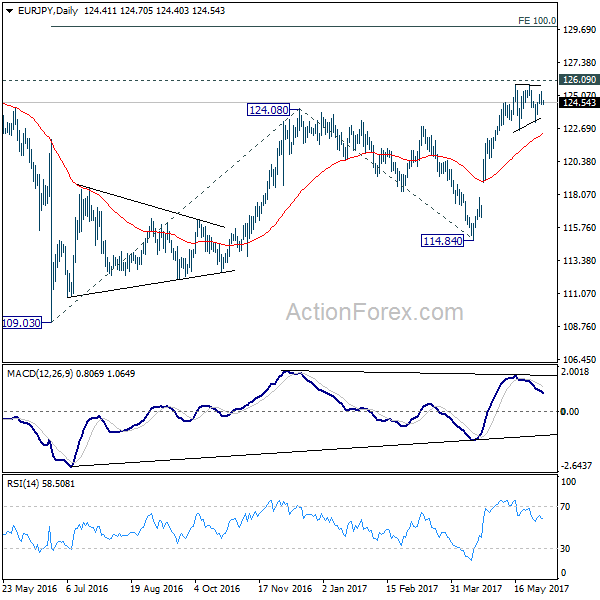
In the bigger picture, focus is staying on 126.09 support turned resistance. Decisive break there will confirm completion of the down trend from 149.76. And in such case, rise from 109.20 is at the same degree and should target 141.04 resistance and above. Meanwhile, rejection from 126.09 and break of 114.84 will extend the fall from 149.76 through 109.20 low.
USD/JPY Elliott Wave Analysis
USD/JPY - 110.54
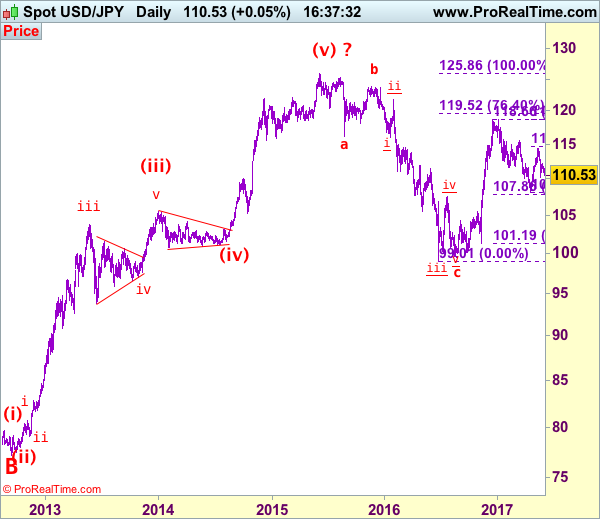
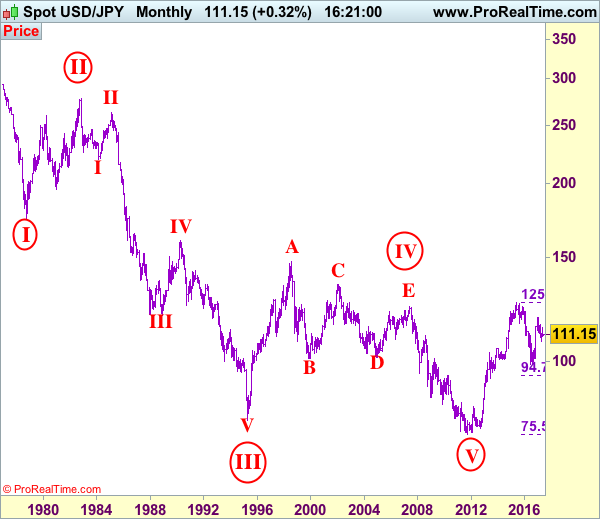
USD/JPY – Wave V of larger degree circle V has possibly ended at 75.31 and major correction has commenced and already met indicated target at 125.00.
The greenback recovered initially last week but renewed selling interest emerged at 111.71 on Friday and price has dropped again from there since, retaining our bearishness for the fall from 114.37 top to extend further weakness to 110.00, then towards previous support at 109.59, however, as broad outlook remains consolidative, reckon downside would be limited and bring recovery later. In the event dollar closes below 109.00 on a daily basis, this would provide confirmation that the rebound from 108.13 is over and bring retest of 108.13 eventually.
Our preferred count is that, triangle wave IV (with circle) ended at 101.45 and the circle wave V brought dollar down to the record low of 75.31 in 2011 and the subsequent rebound signal major correction has commenced with A leg ended at 84.19, followed by wave B at 77.14 and impulsive wave C is now unfolding (indicated upside target at 125.00 had been met) for gain towards 127.00 level. In the event dollar drops below support at 99.01, this would confirm medium term decline from 125.86 top (2015 high) has resumed for subsequent weakness to 98.00 and possibly 97.00.
Under this count, this wave C is unfolding as impulsive waves with (1) (2), 1 2 ended at 80.67, 79.07, 82.84 and 81.69 respectively, hence the extended wave 3 has ended at 103.74 and wave 4 correction of recent upmove should bring weakness to 92.57, then towards 90.88 but psychological support at 90.00 should limit downside and bring another rally later in wave 5, indicated target at 125.00 had been met and gain to 127.00 cannot be ruled out but reckon price would falter below 130.00.
On the upside, whilst initial recovery to 111.00-10 cannot be ruled out, reckon said resistance at 111.71 would limit upside and price should falter below said resistance at 112.13, bring another decline later. A daily close above 112.13 would prolong consolidation and bring another bounce to 112.70-80, however, previous support at 113.12 should limit upside and price should falter below 113.85, bring retreat later. Only break of 113.85 would suggest the retreat from 114.37 has ended and bring another rise to this level, a break of this resistance at 114.37 would extend the rise from 108.13 low to 114.60-65 (61.8% Fibonacci retracement of 118.66-108.13). Having said that, a daily close above there is needed to retain bullishness and suggest the entire fall from 118.66 has ended at 108.13, then further gain to 115.00 and later test of key resistance at 115.51 would follow.
Recommendation: Stand aside for this week.
On the monthly chart, we have changed our preferred count that an impulsive wave is unfolding with major wave III with circle ended at 79.75, then followed by wave IV with circle and is labeled as a triangle with A: 147.64 (11 August, 1998), B: 101.25, C: 135.20, D: 101.67 and E leg ended at 124.14 to end the wave IV with circle. Hence, wave V with circle commenced from there and hit a record low of 75.31, however, the subsequent strong rebound signals this circle wave V has possibly ended there, hence gain to (indicated upside target at 122.00 and 125.00 had been met), the retreat from 125.86 suggests wave A of major correction has ended there and wave B correction back to 99.00, then 95.00 would be seen, however, reckon downside would be limited to 90.00, bring another rebound in wave C next year.
GBP Holds After London Terror Attack And Conservatives 1% Lead
The London terror attack happened on Saturday, June 3rd, which was the third terror attack in the UK this year following the Westminster terror attack in March and the Manchester terror attack in May. The timing of the London terror attack especially sensitive being just a few days prior to the general election.
The polls conducted by Survation, released on Jun 3rd, are indicating that the Conservative Party's lead has now narrowed to just 1%. The approval rating of the Tory and Labour Parties are 40% and 39% respectively. Despite the London terror attack and recent polls, the early European session on June 5th has GBP/USD still holding above the support line at 1.2850, trading around 1.2875. EUR/GBP hit a high of 0.8766. last seen on March 14th. Be aware that the election uncertainty will still likely pose downward pressure to GBP crosses before and after the election.
Saudi Arabia, Egypt, UAE and Bahrain today announced a break of diplomatic relations with Qatar due to terrorism and extremism. Saudi Arabia alleged that Qatar has funded some terrorism organisations, such as the Muslim Brotherhood and ISIS, attempting to cause regional chaos.
Those countries ordered Qatari diplomats to leave their countries within 48 hours. Saudi Arabia announced that the border with Qatar is to be closed and cut all land, air and sea contacts with Qatar, urging all “brotherly countries and companies to do the same”.
We can expect that the actions taken will cause a significant impact on the Qatar economy. Qatar is an OPEC member state and the diplomatic ties cut will likely pose uncertainty to the output cut agreement extension and oil prices. The diplomatic ties cut will likely affect oil supply which will result in higher oil prices. However, it will also likely undermine the execution of the output cut agreement, which will pose downward pressure to oil prices. The oil market prospect after the diplomatic ties cut is still vague.
On Monday June 5th, in early European session WTI spot and Brent crude spot saw a 1.4% and 1.48% rebound respectively. Spot gold rallied, being a safe haven in times of uncertainty, because of the London terror attack and the Qatar diplomatic issue, hitting a 6-week high of $1281.89.
Trade Idea: EUR/JPY – Buy at 123.75
EUR/JPY - 124.54
Recent wave: wave v of (C) ended at 94.12 and major correction in wave A has ended at 149.79
Trend: Near term up
Original strategy:
Buy at 124.20, Target: 126.20, Stop: 123.60
Position: -
Target: -
Stop: -
New strategy :
Buy at 123.75, Target: 125.75, Stop: 123.15
Position: -
Target: -
Stop:-
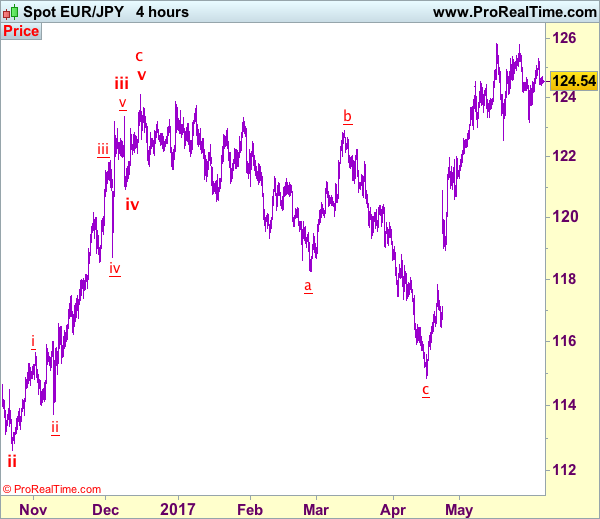
As the single currency has retreated after rising to 125.31 on Friday, suggesting further consolidation within recent established range would be seen and pullback to 124.00 is likely, however, reckon downside would be limited to 123.65-70 and bring another rise later, above 125.31 would extend gain towards strong resistance at 125.82 but break there is needed to confirm recent upmove has resumed and extend headway to 126.20-30 and possibly 126.60-70 but reckon reckon 127.00-10 would hold from here.
In view of this, we are looking to buy euro on pullback as 123.65-70 should limit downside and bring another rise later. Below support at 123.16 would abort and shift risk back to downside for test of previous support at 122.56 which is likely to hold from here due to broad consolidative outlook.
Our latest preferred count is that wave (ii) is ABC-X-ABC which ended at 123.33 and wave (iii) is unfolding with wave iii ended at 100.77, followed by wave iv at 111.57 and wave v as well as the wave (iii) has ended at 97.04, followed by wave (iv) at 111.43 and wave (v) has ended at 94.12 which is also the end of the larger degree v, this also implied the major wave (C) has also ended there, hence major correction has commenced from there with (A) leg unfolding in its lower degree wave c which has possibly ended at 145.69. Under this count, A-B-C wave (B) has commenced with A leg ended at 136.23, wave B at 143.79 and wave C has possibly ended at 149.79.
Our larger degree count is that the decline from 139.26 is wave (C) and is sub-divided into a diagonal triangle i-ii-iii-iv-v with wave i - 105.44, wave ii- 123.33, wave iii - 97.03, wave iv - 111.43, followed by the final wave v as well as the end of wave (C) at 94.12, this also mark the bottom of larger degree wave B. Under this count, major rise in wave C has commenced as an impulsive wave with minor wave III ended at 145.69, wave V is still in progress for further gain to 150.00. Having said that, this so-called wave V could well be the first leg of larger degree 5-waver wave C and this wave C should bring at least a retest of wave A top at 169.97 (July 2008).
Elliott Wave Analysis: USDCHF Trading In Final Stages Of A Downtrend
On the updated chart of USDCHF we can see that market recently made a three-wave recovery into wave 4 as part of a downtrend, that found resistance at the 0.9807 level. As we can see a new drop happened last week, which we labeled as final wave 5 of C). That said current drop can see limited downside around the Fibonacci ratio of 161.8 or 200% and later ideally make a new reversal higher in impulsive fashion.
Trade Idea: AUD/USD – Buy at 0.7420
AUD/USD – 0.7469
Recent wave: Wave 5 ended at 1.1081 and major correction has commenced for fall to 0.7000 and then towards 0.6500-10
Trend: Near term down
New strategy :
Buy at 0.7420, Target: 0.7570, Stop: 0.7360
Position: -
Target: -
Stop:-
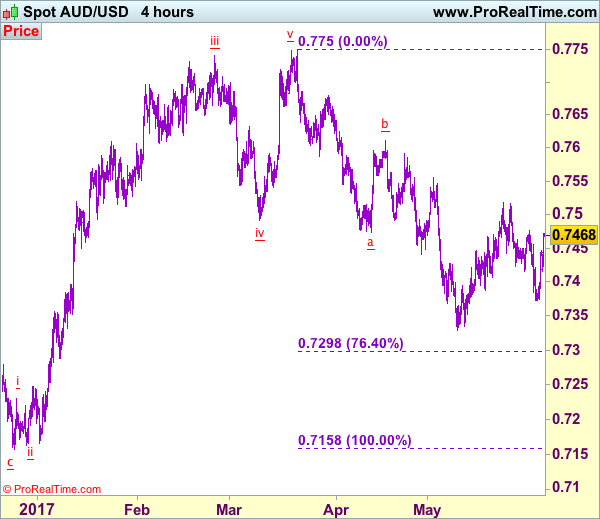
Although aussie fell to as low as 0.7372 late last week, decent demand emerged there and the pair has staged a strong rebound from there, suggesting the retreat from 0.7518 has possibly ended there, above 0.7475-80 would add credence to this view and extend gain to said resistance at 0.7518, break there would signal another leg of rise from 0.7329 low is underway and extend headway towards 0.7592 but resistance at 0.7611 should hold from here due to near term overbought condition.
In view of this, we are looking to buy aussie on dips as 0.7415-20 should limit downside and bring another rise. Below said support at 0.7372 would abort and revive our bearish view that the rebound from 0.7329 has ended at 0.7518 last month, bring further fall towards this level. Only a drop below there would confirm recent decline has resumed and extend weakness to 0.7295-00 (76.4% retracement of 0.7158-0.7750).
On the 4-hour chart, the move from 0.8066 is the wave 5 with i: 0.8860, ii: 0.8315, wave iii is an extended move ended at 1.0183, iv: 0.9706 and wave v has ended at 1.1081 (also the top of entire wave 5). The subsequent selloff is the major correction which is unfolding as ABC-X-ABC and 2nd A leg has ended at 0.8848, followed by a-b-c wave B which ended at 0.9758, hence, 2nd C wave is now in progress and indicated downside target at 0.7000 and 0.6950 had been met, so further fall to 0.6710-20 cannot be ruled out.
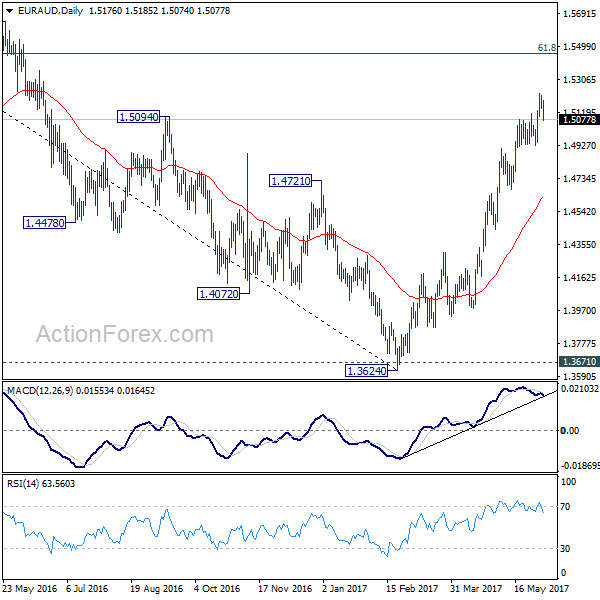
EUR/AUD Daily Outlook
Daily Pivots: (S1) 1.5123; (P) 1.5171; (R1) 1.5198; More...
EUR/AUD dips sharply today and intraday bias is turned neutral with a temporary top formed at 1.5226. Further rally is expected as long as 1.4927 support holds. Above 1.5226 will extend the rally from 1.3624 to next medium term fibonacci level at 1.5455. However, break of 1.4927 will indicate short term topping and bring deeper pull back.
In the bigger picture, price actions from 1.6587 medium term top are viewed as a corrective pattern. Such correction should be completed at 1.3624 after defending 1.3671 key support. Rise from 1.3642 is now expected to target 61.8% retracement of 1.6587 to 1.3624 at 1.5455. Sustained break there will pave the way to retest 1.6587. In any case, outlook will now stay cautiously bullish as long as 1.4669 support holds.

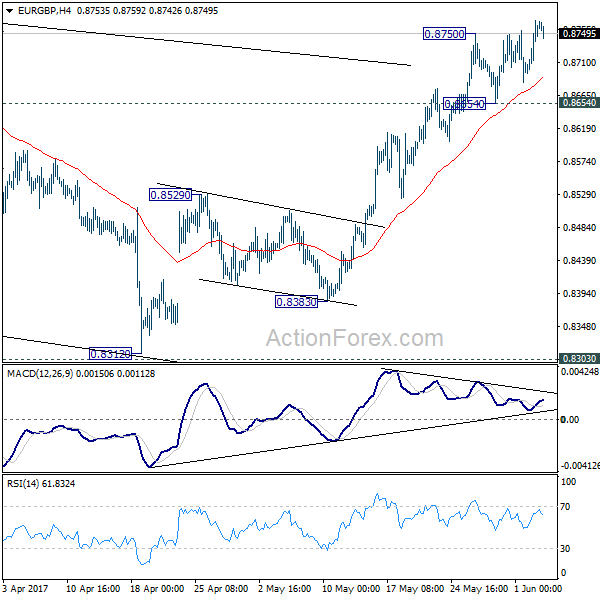
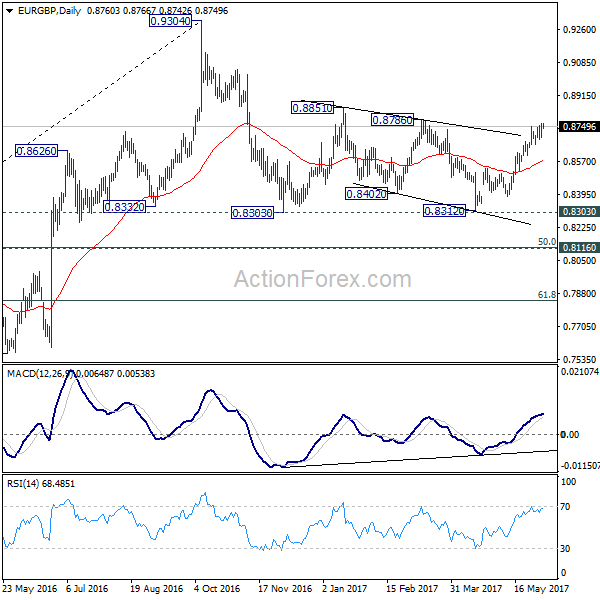
EUR/GBP Daily Outlook
Daily Pivots: (S1) 0.8706; (P) 0.8736; (R1) 0.8779; More...
Intraday bias in EUR/GBP remains on the upside for the moment. Current rise would target 0.8786 resistance and then 0.8851. Decisive break of 0.8851 will pave the way to retest 0.9304 high. On the downside, break of 0.8654 support is needed to indicate short term topping. Otherwise, outlook will say mildly bullish in case of retreat.
In the bigger picture, price actions from 0.9304 are viewed as a medium term corrective pattern. The leg from 0.9304 should have completed after testing 0.8332 structural support. But it's too early to say that larger rise from 0.6935 is resuming. Rejection from 0.9304 will extend the consolidation with another falling leg. Meanwhile, firm break of 0.9304 will target 0.9799 (2008 high). In case of another decline, we'd expect strong support from 0.8116 cluster support (50% retracement of 0.6935 to 0.9304 at 0.8120) to contain downside and bring rebound.
Weak Payrolls Hits The U.S. Dollar
Friday's soft payrolls report sent the U.S. dollar weaker as the U.S. economy was seen adding 138k jobs in May compared to forecasts of 184k. The weak headline print overshadowed the fact that the U.S. unemployment rate fell to a 16-year low at 4.3%.
EURUSD rallied to a fresh 7-month high as a result. Looking ahead, the markets today will focus on the services PMI across the EU, UK and the U.S. In the U.S. the ISM non-manufacturing PMI is expected to slip a little to 57.1 compared to April's 57.5, while in the UK, the services PMI is expected to fall to 55.1 from 55.8 last month.
The weekend terror attacks in London, alongside Trump's withdrawal from the Paris climate accord has also kept the markets on the edge.
EURUSD intraday analysis
EURUSD (1.1266): The EURUSD is seen currently pulling back lower from Friday's highs but the price action remains biased to the upside. Technical support is seen at 1.1236 which could be tested in the near term but following a decline to this level, the euro could once again push higher. However, with the ECB meeting due this Thursday the EURUSD could remain range bound. A decline below 1.1236 will keep EURUSD moving sideways with the next support seen at 1.1200. Only a strong decline below 1.1200 will signal a move to the downside with 1.1100 and 1.1000 coming into question.
GBPUSD intraday analysis
GBPUSD (1.2869): The British pound opened lower today following the doji close on Friday and Thursday. Price action is likely to stay flat with the UK general elections due this Thursday. Support is seen at 1.2800 which could be tested in the near term. A breakdown below 1.2800 will signal the head and shoulders pattern seen on the daily chart. This will trigger the downside towards 1.2600. On the 4-hour chart, price action is rather volatile although any upside could see the current gap being filled.
XAUUSD intraday analysis
XAUUSD (1280.49): Gold prices are seen pushing higher from Friday's close. With the current sentiment in the markets, the landscape is broadly favorable for gold prices. With the resistance level at 1274.00 being breached, gold prices are likely to see further upside. However, watch for a potential dip back to 1274.00 where support could now be established. To the upside, 1288, which marks the highs from April 21 will be the next upside target.
Technical Outlook: GBPUSD – Multiple Bear-Crosses Rising Downside Pressure
Cable is holding steady in early Europe, trading around 1.2870 after hitting session low at 1.2853 after opening of Asia on Monday, underpinned by latest polls that show Conservative Party lead up.
However, Monday's action was so far capped by top of thick hourly cloud, with strong bearish signals emerging on daily chart and seeing risk of deeper pullback.
Recovery rally from 1.2770 base stalled at 1.2900 zone, with double long-legged Dojis on Thu/Fri, signaling that near-term bulls may be running out of steam.
Plethora of strong resistances at 1.2900 zone, provided by daily MA's (10/20/30) and Tenkan-sen/Kijun-sen lines, limited upside attempts and signal rising downside pressure on bear crosses that were formed.
Break below session low (1.2853) and extension through last Thursday's low at 1.2829 (also Fibo 61.8% of 1.2768/1.2920 recovery rally) would further weaken near-term tone and risk return to 1.2770 higher base and breakpoint.
Falling 10SMA so far caps and maintains descend from double upside rejection at 1.2915/20.
Only sustained break above these barriers would neutralize bearish threats and shift near-term bias higher for renewed attacks at psychological 1.3000 barrier.
Res: 1.2883, 1.2903, 1.2920, 1.2946
Sup: 1.2853, 1.2829, 1.2800, 1.2768