Sample Category Title
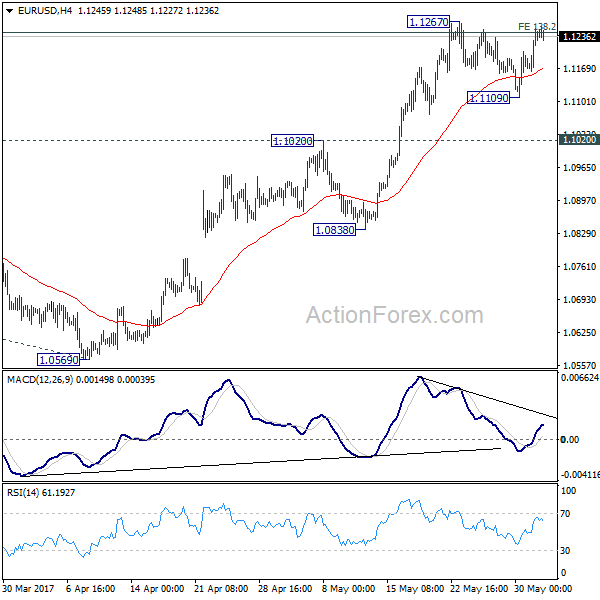
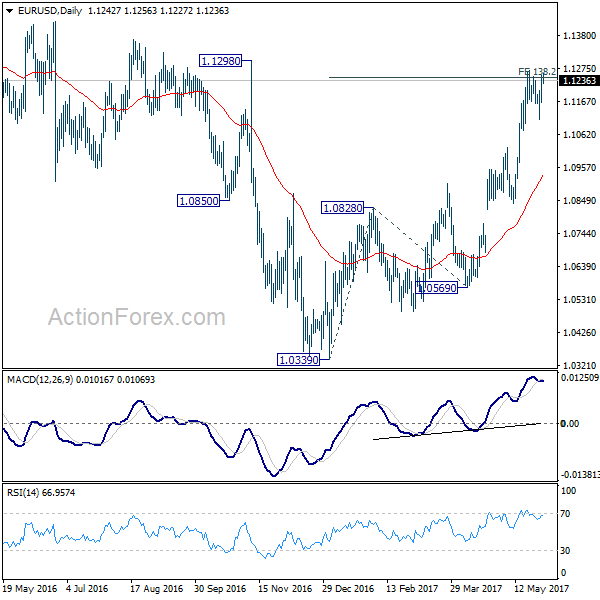
EUR/USD Daily Outlook
Daily Pivots: (S1) 1.1187; (P) 1.1219 (R1) 1.1275; More....
Intraday bias in EUR/USD remains neutral for the moment. On the upside, break of 1.1267 will resume recent rise. Decisive break of 1.1245/98 (138.2% projection of 1.0339 to 1.0828 from 1.0569 at 1.1245) resistance zone will carry larger bullish implication and target 1.1615 resistance next. In case consolidation from 1.1267 extends with another fall, further rise will remain in favor as long as 1.1020 support holds. But, break of 1.1020 will indicate rejection from 1.1245/98 and turn bias to the downside for 1.0838 support.
In the bigger picture, the case for medium term reversal continues to build up with EUR/USD staying far above 55 week EMA (now at 1.0888). Also, bullish convergence condition is seen in weekly MACD. Focus will now be on 1.1298 key resistance. Rejection from there will maintain medium term bearishness and would extend the whole down trend from 1.6039 (2008 high). However, firm break of 1.1298 will indicate reversal. In such case, further rally would be seen back to 1.2042 support turned resistance next.
GBP/USD Daily Outlook
Daily Pivots: (S1) 1.2799; (P) 1.2859; (R1) 1.2951; More...
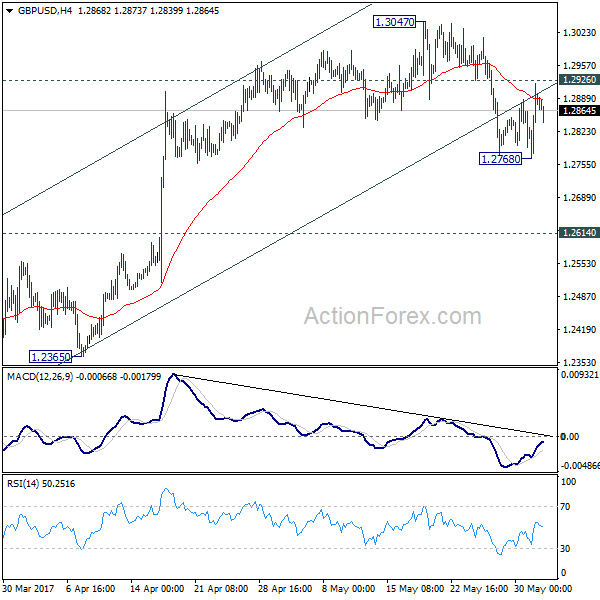
Intraday bias in GBP/USD remains neutral first. With 1.2926 minor resistance intact, deeper fall is still in favor. We're holding on to view that rise from 1.2108 is completed. Below 1.2768 will target 1.2614 resistance turned support next. Break there should also indicate completion of whole consolidation pattern from 1.1946 and target a retest on this low. Meanwhile, above 1.2926 minor resistance will turn focus back to 1.3047 high instead.
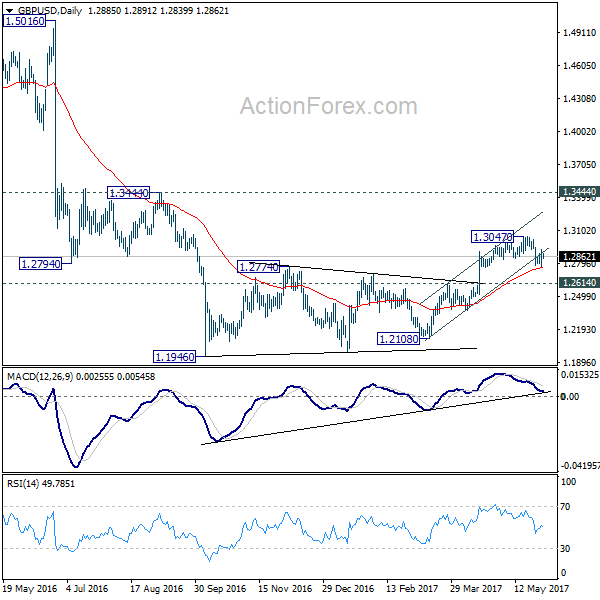
In the bigger picture, fall from 1.7190 is seen as part of the down trend from 2.1161. The rejection from 55 week EMA is maintaining bearishness in the pair. Also, at this point, as long as 1.3444 resistance holds, fall from 1.7190 is still expected to continue. Break of above mentioned 1.2614 support will affirm this bearish case.
Market Update – Asian Session: China Caixin Manufacturing PMI Falls Into Contraction
Asia Mid-Session Market Update: Shanghai Composite, AUD fall as China Caixin Manufacturing PMI falls into Contraction
US Session Highlights
(US) President Trump said to have decided to withdraw the US from Paris Climate accord - financial press
(US) Fed's Kaplan (moderate, voter): Inflation is slow and uneven but trend not deteriorating
(LY) Libya National Oil Corp Chairman: oil production rises to 827Kbpd after technical problem fixed - financial press
(US) APR PENDING HOME SALES M/M: -1.3% V 0.5%E; Y/Y: -5.4% V 0.5% PRIOR
(US) Conference Board May Total online job ads 4.81M v 4.61M m/m v 5.31M y/y; New ads 2.35M v 2.0M m/m v 2.02M y/y
(US) May Chicago Purchasing Manager corrected to 59.4 from erroneously reported 55.2 (v 57.0e)
Stocks closed the month on a subdued note, with major indices printing small numbers in the red. The month brought a new all-time monthly high for the S&P, which gained close to 1%. Best performing sectors in the S&P for May were Technology and Utilities, up 4.1% and 3.6% respectively. The worst performing sector was Energy, down 3.1%. Continued evidence the reflation trade is on hold for now as 10-year Treasury note yields continued to fall today, closing down 1bps, its lowest close since April 18th.
US markets on close: Dow -0.1%, S&P500 -0.1%, Nasdaq -0.1%
Best Sector in S&P500: Utilities
Worst Sector in S&P500: Financials
Biggest gainers: PRGO +7.3%; VRTX +2.7%; REGN +2.3%
Biggest losers: KORS -8.5%; SWN -4.6%; CF -3.6%
At the close: VIX 10.4 (flat); Treasuries: 2-yr 1.29% (-1bp), 10-yr 2.20% (-2bps), 30-yr 2.86% (-3bps)
US movers afterhours
PANW Reports Q3 $0.61 v $0.55e, R$431.8M v $413Me; Guides Q4 $0.78-0.80 v $0.74e, R$481-491M v $485Me; +12.5% afterhours
BOX Reports Q1 -$0.13 v -$0.14e, R$117.2M v $115Me; Guides Q2 -$0.13 to -$0.12 v -$0.12e, R$121-122M v $121Me; +2.9% afterhours
HPE Reports Q2 $0.35 v $0.35e, R$9.9B v $9.87Be; Guides Q3 $0.24-0.28 v $0.31e; Affirms FY17 $1.46-1.56 v $1.48e ; -1.1% afterhours
SMTC Reports Q1 $0.44 v $0.41e, R$149.1M v $146Me; Guides Q2 $0.43-0.49 v $0.45e, R$150-160M v $154Me, gross margin 60.5-61.5%; -3.8% afterhours
Politics
(UK) Times/YouGov general election weekly poll: Conservatives 42% (-1pts), Labour 39% (+3pts)
(US) Pres Trump: I will be announcing my decision on Paris Accord, Thursday at 3:00 P.M
(US) House of Reps said to investigate another meeting between AG Sessions and Russian ambassador Kislyak - US press
(US) Commerce Sec Ross: wants to have full discussions with Congress over NAFTA renegotiations by July before heading into talks in Aug - press
Key economic data
(CN) CHINA MAY CAIXIN PMI MANUFACTURING: 49.6 V 50.1E (1st contraction in 11 months)
(JP) JAPAN MAY FINAL PMI MANUFACTURING: 53.1 V 52.0 PRELIM (3-month high)
(JP) JAPAN Q1 CAPITAL SPENDING Y/Y: 4.5% (2nd straight quarter of growth) V %4.0E; EX-SOFTWARE Y/Y: 5.2% V 4.1%E
(AU) AUSTRALIA MAY AIG MANUFACTURING INDEX: 54.8 V 59.2 PRIOR (8TH CONSECUTIVE MONTH OF EXPANSION; 4-month low)
(AU) AUSTRALIA MAY CORELOGIC HOUSE PRICES M/M: -1.1% V 0.1% PRIOR
(AU) AUSTRALIA APR RETAIL SALES M/M: +1.0% V +0.3%E (31-month high)
(AU) AUSTRALIA Q1 PRIVATE CAPITAL EXPENDITURE (CAPEX) Q/Q: 0.3% V 0.5%E
(KR) SOUTH KOREA MAY PMI MANUFACTURING: 49.2 V 49.4 PRIOR (10th consecutive contraction)
(KR) SOUTH KOREA MAY TRADE BALANCE: $6.0B V $6.8BE
(KR) SOUTH KOREA MAY CPI M/M: 0.1% V +0.2%E; Y/Y: 2.0% V 2.0%E; CPI CORE Y/Y: 1.4% V 1.4%E
Asia Session Notable Observations, Speakers and Press
Asian indices are mixed again, tracking a lackluster US session where investors are biding their time before Friday's non-farm payrolls. Oil was in focus with a steep decline in US hours on reports of expanded Libya production, though some of the selloff was reversed on a large API inventory draw. US 2-10 Treasury yield curve continues to narrow, while PIMCO estimates a 70% chance of a US recession over the next 5 years. Fed's Williams speaking in Asia also voiced possibility of a total of 4 rate hikes this year if US economic growth strengthens, though he still sees 3 as the baseline scenario.
China is leading regional indices to the downside after a much weaker than expected Caixin Manuf PMI sank into contraction for the first time in 11 months. Some of the key components saw first fall in input costs since last June, growth in new orders the slowest seen since the current upturn began in July 2016, and employment decline at the quickest pace seen since last September. Input costs also fell for the first time in nearly a year in evidence of disinflationary pressure. The Caixin PMI is focused more on smaller firms as opposed to the official PMI which earlier this week showed some support from last month's 6-month lows.
Nikkei225 is faring better with a modest lift despite the lower US yields and stable USD/JPY rate ranging around ¥111, as Japan's Corporate Spending rose for the 2nd straight quarter and corporate profits grew double-digits despite stronger JPY in Q1. In other FX majors, AUD/USD initially rallied on the release of better than expected Retail Sales and an upgrade in Australia CAPEX projections for the current and next FY's, but then reversed all of those gains to fall 60pips from the highs below 0.7390 on soft China PMI. GBP came under pressure again with another UK election poll portending a hung Parliament in next week's vote.
Volatility around China currency continued as PBoC fix was the strongest since Nov 10th. Traders attribute the preference for stronger Yuan as a preemptive move ahead of the anticipated Fed hike that is expected to strengthen the greenback, as Chinese central bank worries about accelerated outflows amid the increasingly apparent economic slowdown.
China
(CN) ANZ: Sees China Q2 GDP at 6.6%; Latest expansion in Services sector may not be sustained amid regulatory tightening in financial sector - Chinese press
Japan
(JP) BoJ Harada: BoJ's measures have produced excellent results; no chance BOJ will incur losses in long term perspective
(JP) Japan to add Debt-to-GDP ratio as a fiscal target – Japanese Press
Korea
(KR) BOK Gov Lee: Not sure if global recovery can by sustained
Asian Equity Indices/Futures (00:00ET)
Nikkei +1.1%, Hang Seng +0.4%, Shanghai Composite -0.5%, ASX200 +0.1%, Kospi -0.1%
Equity Futures: S&P500 flat; Nasdaq +0.2%, Dax -0.1%, FTSE100 +0.1%
FX ranges/Commodities/Fixed Income (00:00ET)
EUR 1.1230-1.1255; JPY 110.70-111.10; AUD 0.7385-0.7455; NZD 0.7060-0.7090
June Gold -0.3% at 1,268/oz; July Crude Oil +0.9% at $48.75/brl; July Copper -0.5% at $2.57/lb
(US) Weekly API Oil Inventories: Crude: -8.7M v -1.5M prior (biggest draw since Sept 2016)
(CN) PBOC SETS YUAN MID POINT AT 6.8090 V 6.8633 PRIOR; Biggest margin of increase since Jan 6th; Strongest Yuan fix since Nov 10th
(CN) PBOC to inject combined CNY100B v CNY210B prior
(JP) Japan MoF sells ¥2.08T v ¥2.3T offered in 10-year 0.1% JGBs; Avg yield: 0.051% v 0.030% prior; bid to cover: 3.64x v 3.76x prior
Asia equities notable movers
Australia
ANZ -0.5%; New mortgage capital model approved by APRA; adoption to impact Level 2 CET1 ratio negatively by 26bps
Boral (BLD) -1.0%; Cut at JPMorgan
WesFarmers (WES) -3.9%; Cut at Morgan Stanley
Japan
Canon (7751) +3.2%; stock buyback
JGC (1963) +2.3%; awarded LNG contract
Sumitomo Mitsui (8316) +1.0%; CEO: Guides FY20
Toshiba (6502) -1.6%; transferring its stake in its chip joint venture back into the core company - Nikkei
Hong Kong
Top SPring (3688) +1.5%; Reports Q1
Lee's Pharma (950) -1.0%; Reports Q1
USD/CHF Daily Outlook
Daily Pivots: (S1) 0.9644; (P) 0.9702; (R1) 0.9735; More.....
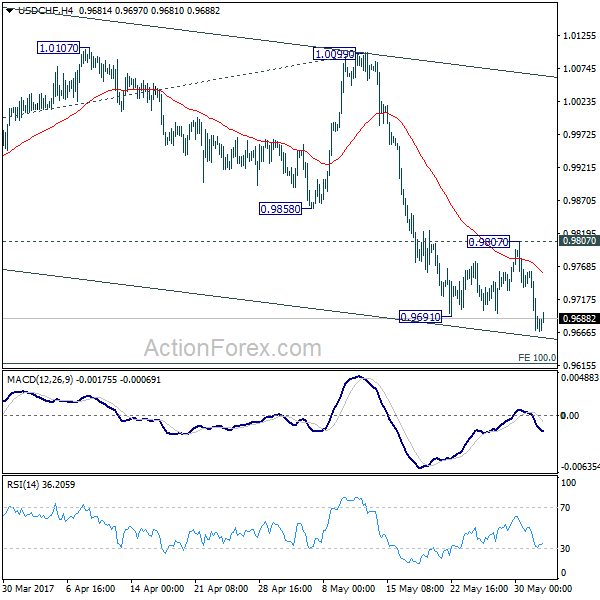
Break of 0.9691 indicates resumption of recent decline in USD/CHF. Intraday bias is turned back to the downside. Current fall from 1.0342 will target 100% projection of 1.0342 to 0.9860 from 1.0099 at 0.9617. We'll start to look for reversal signal below there. But in any case, break of 0.9807 resistance is needed to indicate short term bottoming. Otherwise, near term outlook will remain bearish in case of recovery.
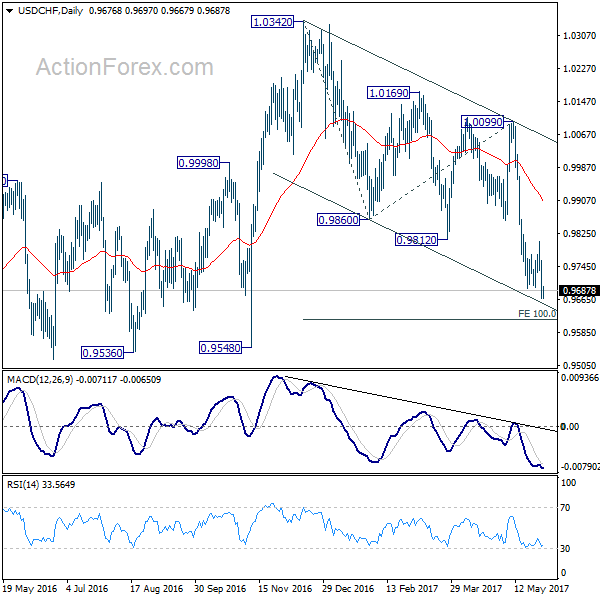
In the bigger picture, USD/CHF is bounded in medium term range of 0.9443/1.0342 for the moment. Consolidative trading would likely continue and medium term outlook remains neutral. Break of 1.0342 key resistance is needed to confirm underlying bullish momentum in the pair. Meanwhile, downside attempts should be contained by 0.9443 key support level.
USD/JPY Daily Outlook
Daily Pivots: (S1) 110.41; (P) 110.82; (R1) 111.16; More...
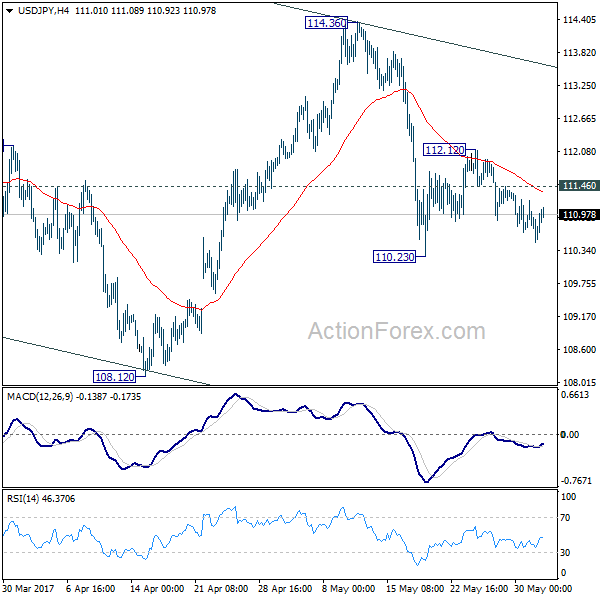
With 111.46 minor resistance intact, intraday bias in USD/JPY remains mildly on the downside for 110.23 support. Break will resume the fall from 114.36 to 108.12 and below. Note again that decline from 118.65 is seen as a correction. In that bearish case, we'll look for bottoming signal again at 61.8% retracement of 98.97 to 118.65 at 106.48. On the upside, above 111.46 minor resistance will turn intraday bias neutral again first.
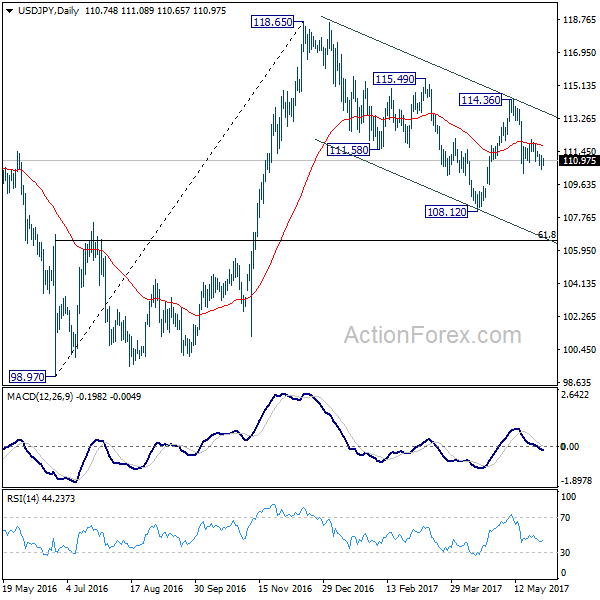
In the bigger picture, price actions from 125.85 high are seen as a corrective pattern. It's uncertain whether it's completed yet. But in case of another fall, downside should be contained by 61.8% retracement of 75.56 to 125.85 at 94.77 to bring rebound. Overall, rise from 75.56 is still expected to resume later after the correction from 125.85 completes.
GBP/JPY Daily Outlook
Daily Pivots: (S1) 141.86; (P) 142.38; (R1) 143.30; More....
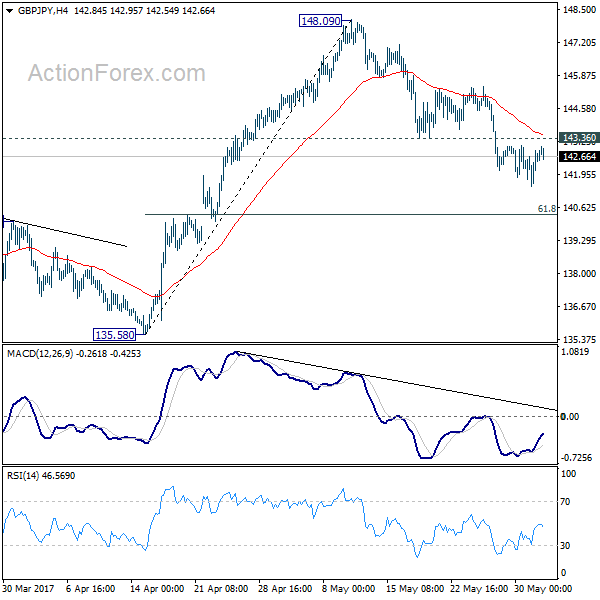
With 143.36 minor resistance intact, deeper decline could still be seen in GBP/JPY, for 61.8% retracement of 135.58 to 148.09 at 140.35. At this point, we'd still expect rebound from 122.36 to resume later. Hence, we'd look for strong support below 140.35 to contain downside and bring rebound. On the upside, above 143.36 minor resistance will turn bias back to the upside. However, sustained trading below 140.35 will dampen our bullish view and turn focus back to 135.58 key near term support instead.
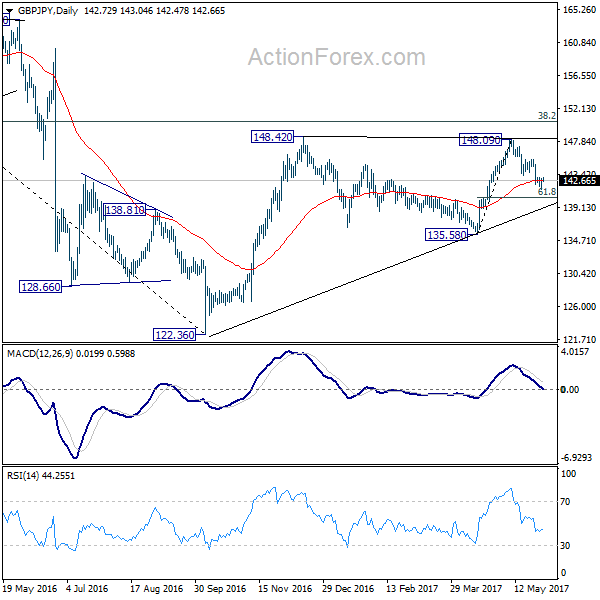
In the bigger picture, rise from 122.36 medium term bottom is still expected to extend to of 195.86 to 122.36 at 150.42. And decisive break there could pave the way to 61.8% retracement at 167.78. However, as the cross is starting to lose upside momentum, rejection below 150.42 and break of 135.58 support will indicate reversal and bring deeper fall back to retest 122.36 instead.
Trade Idea: AUD/USD – Exit long entered at 0.7405
AUD/USD – 0.7406
Recent wave: Wave 5 ended at 1.1081 and major correction has commenced for fall to 0.7000 and then towards 0.6500-10
Trend: Near term down
Original strategy :
Bought at 0.7405, Target: 0.7570, Stop: 0.7345
Position: - Long at 0.7405
Target: - 0.7570
Stop: - 0.7345
New strategy :
Exit long entered at 0.7405
Position: - Long at 0.7405
Target: -
Stop:-
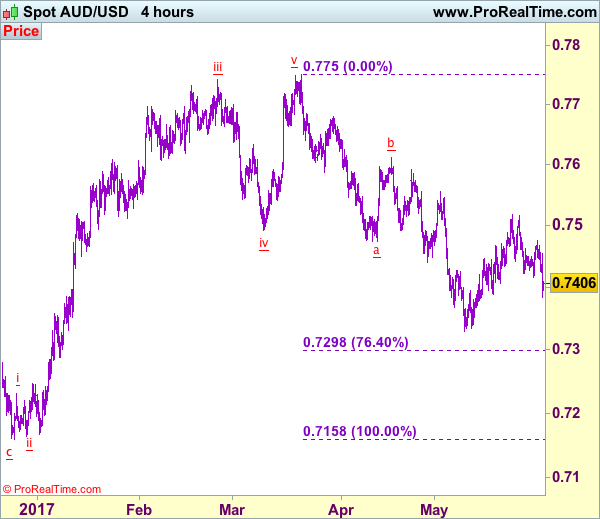
Aussie ran into selling interest at 0.7455 earlier today and has dropped in European morning, dampening our bullishness and near term downside risk is seen for weakness to 0.7380-85, break there would suggest the rebound from 0.7329 has ended at 0.7518 last month, bring further fall to 0.7350, then retest of this level later. Only a drop below this support at 0.7329 would confirm recent decline has resumed and extend weakness to 0.7295-00 (76.4% retracement of 0.7158-0.7750).
In view of this, would be prudent to exit our long position entered at 0.7405 and stand aside for now. above said intra-day resistance at 0.7455 would bring test of 0.7476 but break there is needed to revive bullishness and signal the retreat from 0.7518 has ended, bring another test of this level first, break there would extend the rise from 0.7329 low to resistance at 0.7556.
On the 4-hour chart, the move from 0.8066 is the wave 5 with i: 0.8860, ii: 0.8315, wave iii is an extended move ended at 1.0183, iv: 0.9706 and wave v has ended at 1.1081 (also the top of entire wave 5). The subsequent selloff is the major correction which is unfolding as ABC-X-ABC and 2nd A leg has ended at 0.8848, followed by a-b-c wave B which ended at 0.9758, hence, 2nd C wave is now in progress and indicated downside target at 0.7000 and 0.6950 had been met, so further fall to 0.6710-20 cannot be ruled out.
EUR/JPY Daily Outlook
Daily Pivots: (S1) 123.99; (P) 124.25; (R1) 124.79; More...
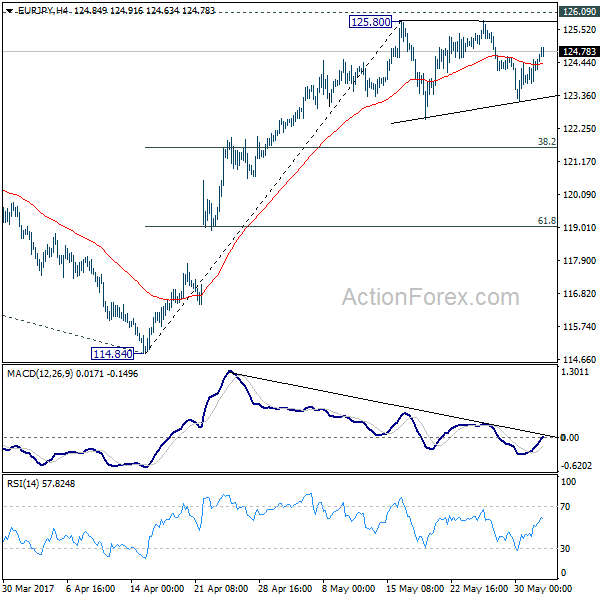
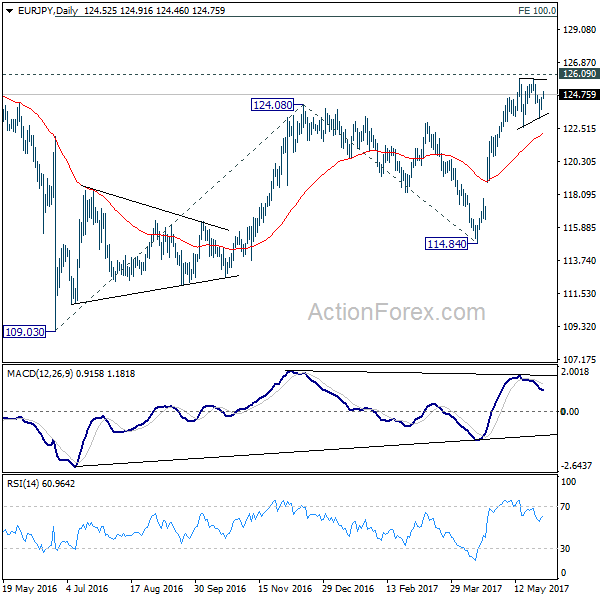
Intraday bias in EUR/JPY remains neutral as the consolidation from 125.80 continues. Deeper fall cannot be ruled out down we'd expect downside to be contained by by 38.2% retracement of 114.84 to 125.80 at 121.61 to bring rise resumption. We're staying mildly bullish in the cross. And, break of 126.09 key resistance will extend the whole rebound from 109.03 to 100% projection of 109.03 to 124.08 from 114.84 at 129.89. Nonetheless, firm break of 121.61 will dampen our bullish view and bring deeper fall to 61.8% retracement at 119.02.
In the bigger picture, focus is back on 126.09 support turned resistance. Decisive break there will confirm completion of the down trend from 149.76. And in such case, rise from 109.20 is at the same degree and should target 141.04 resistance and above. Meanwhile, rejection from 126.09 and break of 114.84 will extend the fall from 149.76 through 109.20 low.
EUR/CHF Daily Outlook
Daily Pivots: (S1) 1.0862; (P) 1.0886; (R1) 1.0903; More...
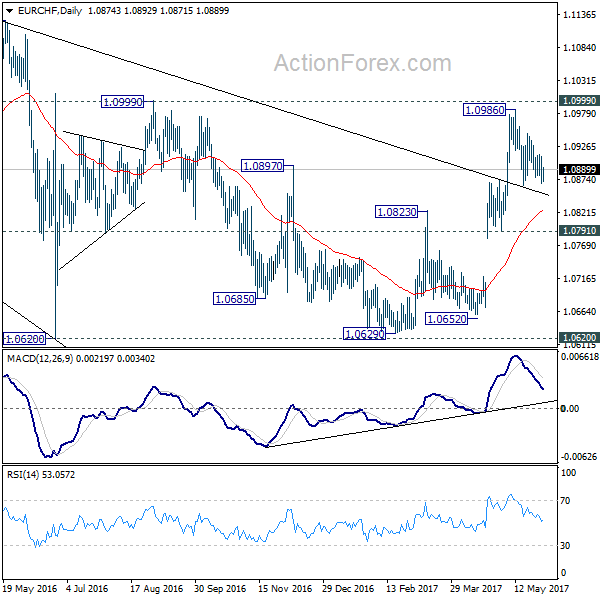
No change in EUR/CHF's outlook as consolidation from 1.0986 continues. Intraday bias stays neutral for the moment. Deeper fall cannot be ruled out. But downside should be contained by 1.0791/0872 support zone to bring rise resumption. As noted before, the consolidative pattern from 1.1198 should be completed. Firm break of 1.0999 resistance will pave the way for a retest on 1.1198 high.
In the bigger picture, the price actions from 1.1198 are seen as a corrective move. Current strong rebound is raising the chance that it's completed after defending 38.2% retracement of 0.9771 to 1.1198 at 1.0653. Decisive break of 1.0999 resistance will target a test on 1.1198 high. For now, this will be the preferred case as long as 1.0791 support holds.

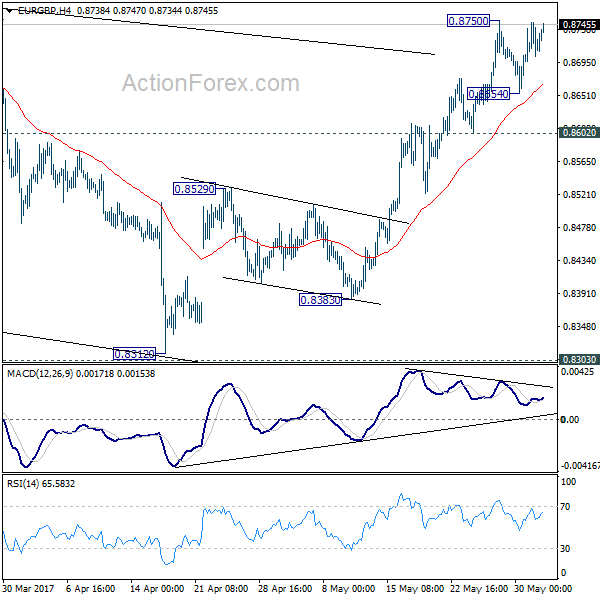
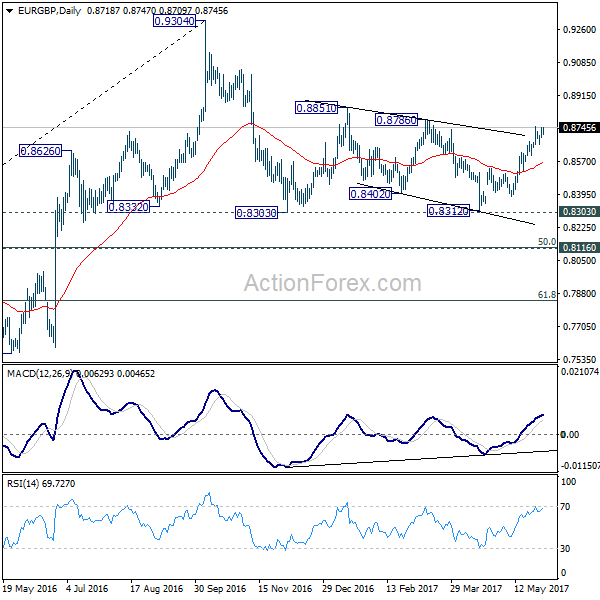
EUR/GBP Daily Outlook
Daily Pivots: (S1) 0.8694; (P) 0.8721; (R1) 0.8747; More...
EUR/GBP is still bounded in range below 0.8750 and intraday bias stays neutral first. Consolidation from 0.8750 could extend but near term outlook will remain mildly bullish as long as 0.8602 support holds and further rally is expected. Above 0.8750 will target 0.8786 resistance first. Break of 0.8786 would pave the wave for retesting 0.9304 high. Break of 0.8602, however, will argue that the rebound from 0.9312 has completed and turn bias back to the downside for 0.8529 first.
In the bigger picture, price actions from 0.9304 are viewed as a medium term corrective pattern. The leg from 0.9304 should have completed after taking 0.8332 structural support. But it's too early to say that larger rise from 0.6935 is resuming. Rejection from 0.9304 will extend the consolidation with another falling leg. Meanwhile, firm break of 0.9304 will target 0.9799 (2008 high). In case of another decline, we'd expect strong support from 0.8116 cluster support (50% retracement of 0.6935 to 0.9304 at 0.8120) to contain downside and bring rebound.