Sample Category Title
EUR/USD Analysis: Trades Below Weekly R1
'The EUR/USD pair came under selling pressure in Asia, as risk-on trades gathered steam amid higher oil and Asian equities, which undermines the sentiment around the funding currency Euro.' – Dhwani Mehta (based on FX Street)
Pair's Outlook
EUR/USD was trading in a small range below the weekly R1 at 1.12480 since mid-Wednesday. Being at an eight-month high, traders may be cautious in terms of further appreciation, thus pushing the rate lower. As a result, the morning session can be characterised by weak volatility. It might be expected that the pair fails to trade above 1.1248, changing the situation in favour of the Euro bears. The closest support at 1.1204 is a rather distant target for today; thus, the price may halt somewhere in between the 1.1248/04 territory. Moreover, traders should be aware of fundamentals scheduled for today that may alter the pair's direction.
Traders' Sentiment
SWFX traders are bearish, as 60% of open positions are short. Meanwhile, pending orders remain neutral today.
GBP/USD Analysis: Flirts With 1.29
'The narrowing in the polls has clearly dented sterling's performance and continues to weigh on the currency, and is probably likely to do so in the near term.' – Barclays (based on Business Recorder)
Pair's Outlook
For the third consecutive day yesterday the British currency was able to avoid losses and outperform the US Dollar, continuously retesting the wedge's support line. The Pound, however, is now expected to allow the Greenback to take the upper hand, which arises the risk of the wedge's lower boundary getting pierced today. Technical studies are still unable to confirm this possibility, meaning that the wedge's support could still succeed in limiting the losses; if not, the cluster around 1.2730 is likely to fulfil that task. We should also not rule out the possibility of another leg up, with the 1.2950 handle expected to be the intraday high.
Traders' Sentiment
There are 51% of traders holding long positions (previously 52%), but 57% of all pending orders are to buy the Sterling, up from 51%.
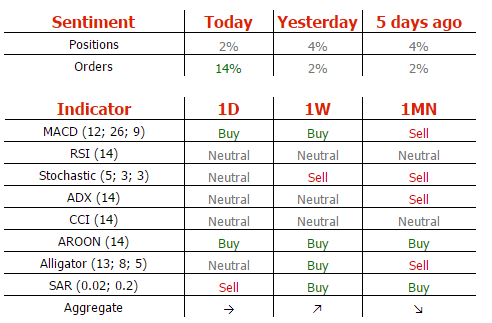
USD/JPY Analysis: No Significant Changes Expected
'The near-term balance of risk appears to favor JPY strength.' – Scotiabank (based on FXStreet)
Pair's Outlook
The USD/JPY pair's behavior fell in line with expectations yesterday, as the exchange rate remained relatively unchanged and no level of significance was pierced. Technically, the Greenback should rebound today, with the weekly S1 providing the required bullish momentum, but with the immediate resistance, namely thee 55-day SMA and the weekly PP, still remaining intact. On the other hand, technical indicators suggest the given pair is to decline today, which would make it the fifth consecutive drop. Poor ADP figures today could be the catalyst for a possible loss, however, it should not exceed 50 pips.
Traders' Sentiment
There are 53% of traders holding short positions today, compared to 57% on Wednesday. At the same time, the share of sell orders edged significantly higher, namely from 45 to 70%.
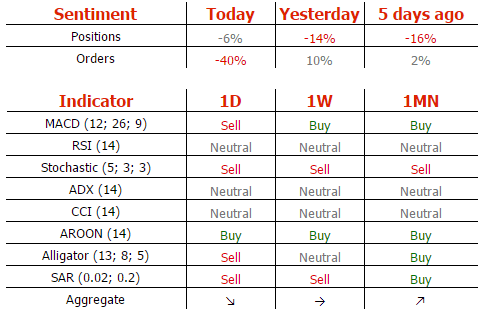
Gold Analysis: Appreciation Might Be Expected
'Investors around the world are seeking safe havens ahead of tomorrow's Non-Farm payrolls and into next week's U.K. elections which have gone from a one horse race to an emotionally close one if you believe the polls.' – Market Pulse (based on Investing.com)
Pair's Outlook
The yellow metal has started this trading session with slight losses against the US Dollar. The pair is kept between the weekly R1 and the weekly PP at 1,275.49 and 1,261.80, respectively, leaving enough potential to trade either way. Contrary to the bearish momentum in the morning, the base scenario favours the pair trading higher, aiming fort the 1,275.49 mark. This assumption is likewise confirmed by bullish technical indicators. Nevertheless, it is not expected that the rate manages to push above this the weekly PP.
Traders' Sentiment
SWFX traders have increased their bullish sentiment, as 52% of open positions are long. In addition, 58% of set up orders are to buy the metal—a slight decrease from 59% on Wednesday.
Aussie Slips After Soft Chinese Data
The Australian dollar had a relatively volatile session overnight. AUD/USD gained initially on Australia's strong retail sales for April, but gave back all of its gains to trade even lower in the next minutes, following the release of China's Caixin manufacturing PMI for May. The Chinese index fell unexpectedly into contractionary territory for the first time in almost a year, generating renewed concerns about a slowdown of the Chinese economy. Bearing in mind Australia's heavy trade exposure to China, should market participants begin to focus increasingly more on the prospect of such a slowdown, the Aussie could remain on the back foot for a while. Especially considering the continued decline in iron ore prices over the past couple of months.
AUD/USD traded lower after the disappointing Caixin PMI, falling below the support (now-turned-into-resistance) hurdle of 0.7420 (R1), before finding fresh buy orders near the 0.7385 (S1) zone and subsequently rebounding somewhat. In case market focus shifts back to a potential Chinese slowdown, or if iron ore prices continue to slide, we would expect the bears to retake control and aim for another test of the 0.7385 (S1) territory. A clear break of that area could initially aim for the 0.7365 (S2) zone.
Today's highlights:
During the European day, we get the final manufacturing PMIs for May from several European nations and the Eurozone as a whole. Given that the final figures are expected to confirm the preliminary estimates, the reaction in the euro could remain relatively limited, unless we have notable revisions.
In the UK, the manufacturing PMI for May will be in focus and the forecast is for a decline. Even though this could hurt sterling somewhat, we think investors may prefer to wait for the services index that will be released on Monday before assessing how the UK economy performed in May. The service sector accounts for the vast majority of UK GDP. What's more, we think that over the next week ahead of the General Election, UK political developments will probably overshadow economics and thus, incoming opinion polls could remain the key driver of sterling. New polls showing that the Conservative - Labour gap continues to narrow could weigh on the pound, and vice-versa. Indeed, yesterday the British pound recovered notably after several polls showed the Conservatives being safely ahead, casting doubts on the recent YouGov poll that showed Theresa May and the Conservative Party failing to secure an absolute majority in Parliament.
From the US, we get the ADP employment report for May. The forecast is for the private sector to have added 185k jobs, more than April's print of 177k. Such a solid figure could raise speculation for the nonfarm payrolls print to also meet its forecast of 183k and thereby, support the dollar. We also get the ISM manufacturing PMI for the same month. Expectations are for the figure to have declined marginally, but still to remain safely above the critical 50 mark. In case of a solid ADP print but a modest slip in the ISM index, we think investors may focus more on the ADP figure, as tomorrow's employment report will probably add the finishing touch to market expectations regarding a June rate hike.
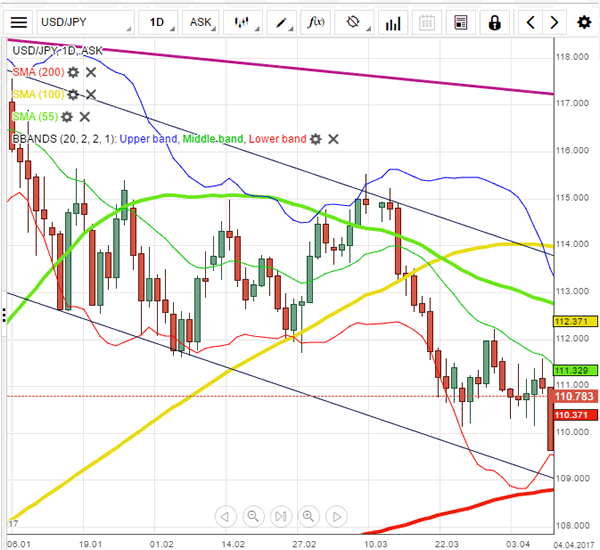
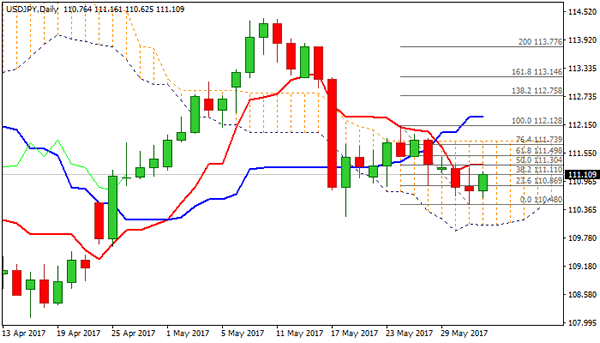
USD/JPY rebounded yesterday after it hit support near the 110.50 (S1) territory. If the ADP print is solid today, we could see the latest rebound continue and perhaps challenge the 111.50 (R1) territory. A decisive break of that level could set the stage for further upside extensions, towards the 112.10 (R2) zone.
We have two speakers on the agenda: Fed Board Governor Jerome Powell and ECB Executive Board member Sabine Lautenschlager. It would be particularly interesting to hear from Powell, considering that he will be addressing the Economic Club of New York and that he is a permanent FOMC voting member that has not expressed his views on policy recently.
AUD/USD
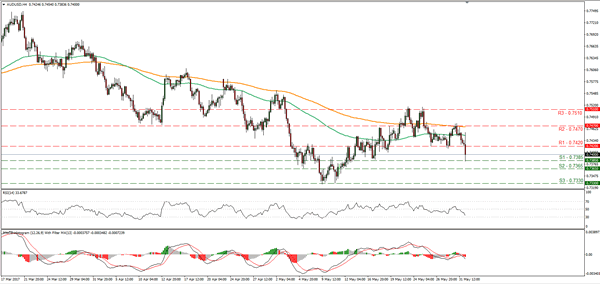
Support: 0.7385 (S1), 0.7365 (S2), 0.7330 (S3)
Resistance: 0.7420 (R1), 0.7470 (R2), 0.7510 (R3)
USD/JPY
Support: 110.50 (S1), 110.20 (S2), 109.70 (S3)
Resistance: 111.50 (R1), 112.10 (R2), 113.10 (R3)
Technical Outlook: USDJPY – Correction Likely To Precede Fresh Downside, Daily Tenkan-Sen Expected To Ideally Cap
The pair bounced above 111.00 barrier on Thursday, on fresh dollar's strength ahead of key US data today and Friday.
Two-day bearish acceleration was contained by strong support at 110.50 (Fibo 61.8% of 108.11/114.36 rally), with Wednesday's action ending in long-legged Doji and signaling indecision.
However, current rally is so far seen as correction ahead of fresh attempts lower, as overall structure remains bearish and keeps the downside at risk.
Close below 110.50 pivot is needed to confirm bearish stance for attack at key supports at 110.26/23 (200SMA / 18 May low) and 110.00 (daily cloud top).
Strong barrier at 111.30 (daily Tenkan-sen) is expected to ideally cap correction and keep Tenkan-sen and Kijun-sen lines in bearish setup for fresh attempts lower.
Extended upticks would face another barrier at 111.50 (Fibo 61.8% of 112.12/110.48) break of which would signal reversal and expose next pivot at 111.80 (daily cloud top).
Res: 111.30, 111.50, 111.80, 112.12
Sup: 111.00, 110.62, 110.50, 110.23
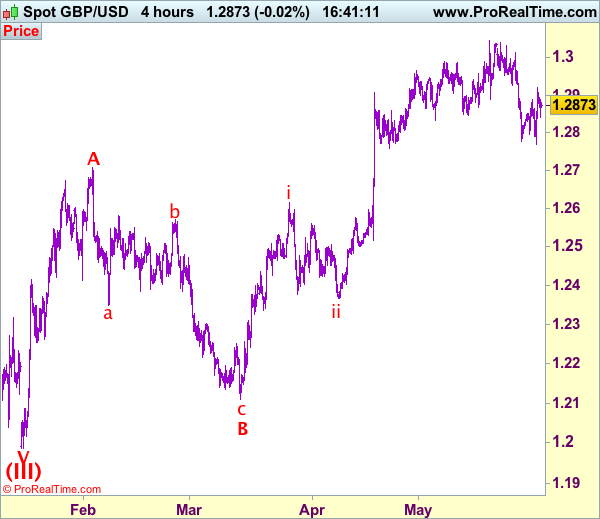
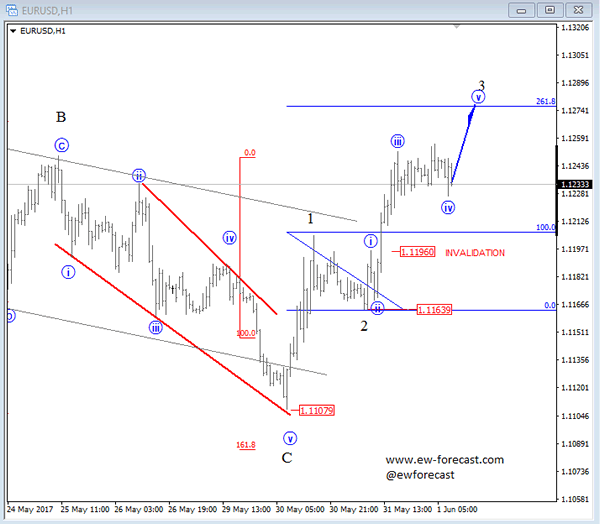
Elliott Wave Analysis: EURUSD Intra-day View
EURUSD is trading higher, now well above the upper channel line which is a suggestion that bulls are on the move. That said specifically we see price trading in sub-wave four, as part of a higher degree wave 3, that may unfold in sessions ahead.
EURUSD, 1H
Foreign Exchange Market Commentary: EUR/USD, USD/JPY, GBP/USD, GOLD, WTI CRUDE, DJIA, FTSE100, DAX
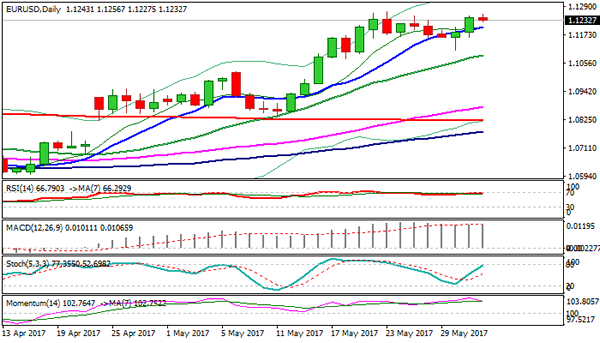
EUR/USD
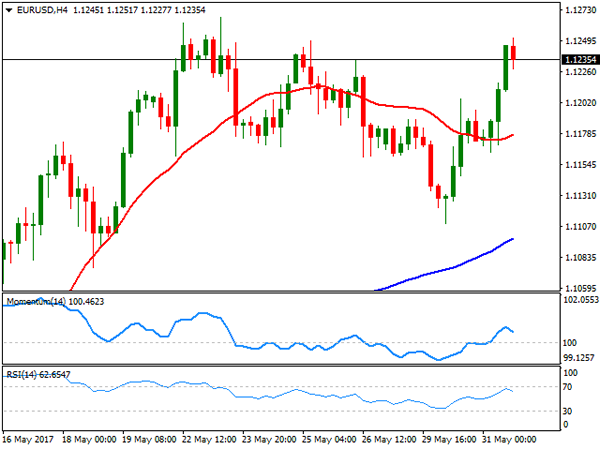
Dollar's weakness became more evident this Wednesday, as despite news coming from Europe were far from encouraging, the EUR/USD pair managed to regain the 1.1200 level, advancing towards the 1.1230 region during London trading hours, later fueled by another batch of US negative data to top for the day at 1.1251.
European CPI surprised to the downside, as in May, inflation rose by less than expected according to preliminary estimates with headline yearly inflation rising by 1.4%, below previous 1.9%, with most of the advance having been attributed to rising energy prices. Seems Draghi's stance of keeping QE alive was not that wrong after all. The region's unemployment rate fell 5.7%, the lowest in over eight years. In the US, Pending Home Sales fell for a second consecutive month in April, down by 1.3%, while the Chicago PMI was initially released at 55.2, compared to previous 58.3 and the expected 57.0, but re-released a couple of hours later at 59.4, the best reading since November 2014. The damage, however, was done and the dollar plunged, with Wall Street also falling sharply. The corrected number was enough to pare dollar's decline, but failed to trigger demand for the troubled currency.
From a technical point of view, the pair has recoup its bullish stance, with the price above a flat 20 SMA, in the 4 hours chart, but with the larger ones heading north far below it, and technical indicators losing upward strength, but holding near their daily highs. Overall, the pair looks poised to extend its advance, although it would take an advance beyond 1.1265 to confirm such extension towards 1.1300 and beyond.
Support levels: 1.1200 1.1160 1.1120
Resistance levels: 1.1265 1.1300 1.1345
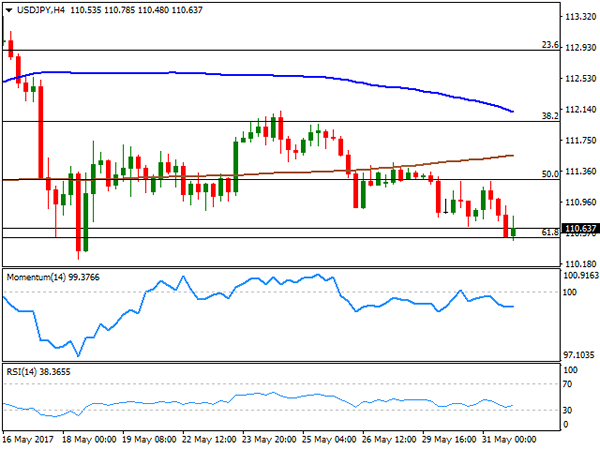
USD/JPY
The USD/JPY pair stretched its weekly decline to 110.48, ending the day a handful of pips above this last, as the yen found strength in the poor performance of US equities and yields. US Treasury yields fell to multi-week lows in the last day of May, with the 30-year benchmark down to 2.86% from previous 2.89% and 10-year note one down to 2.20% from previous 2.22%. The decline stalled after the second release of the Chicago PMI, initially misreported, but the strong number was not enough to trigger dollar demand, clearly indicating that the risk remains towards the downside. From a technical point of view, the 4 hour chart shows that the price is struggling around the 61.8% retracement of the latest bullish run at 110.50, whilst the 100 and 200 SMAs remain well above the current level, and particularly the shortest gaining bearish strength. In the same chart, technical indicators have turned flat near their daily lows within bearish territory, also favoring a new leg south particularly on a break below the mentioned Fibonacci support.
Support levels: 110.50 110.10 109.75
Resistance levels: 111.10 111.65 112.05
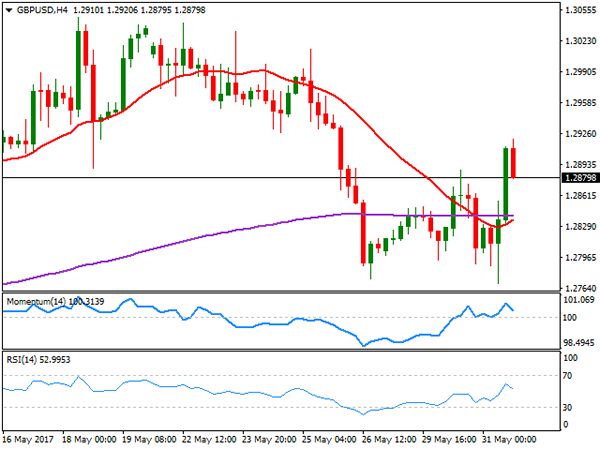
GBP/USD
The GBP/USD pair fell to a fresh 1-month low of 1.2769 this Wednesday, undermined by poor UK data and the latest YouGov poll, which estimated that PM May Conservative party may loss up to 20 seats in the upcoming General Election, suggesting that the UK could end up with a hung Parliament. Also, UK money figures showed that net lending to individuals fell to £4.3B in April, missing expectations and below March £4.7B, while mortgage approvals in the month also decreased, standing at 64.645K. The pair changed course on dollar's weakness, rallying up to 1.2920, helped by a Kantar opinion poll showing that Conservatives' lead increased from 8, to 10 points. Now trading around 1.2880, the pair was unable to hold on to gains beyond the critical 1.2900 figure, but trades anyway in the green, with the 4 hours chart showing that the price extended well above its moving averages that anyway lack directional strength, whilst technical indicators are retreating within positive territory, reflecting decreasing buying interest around the mentioned level.
Support levels: 1.2830 1.2790 1.2765
Resistance levels: 1.2920 1.2960 1.3000
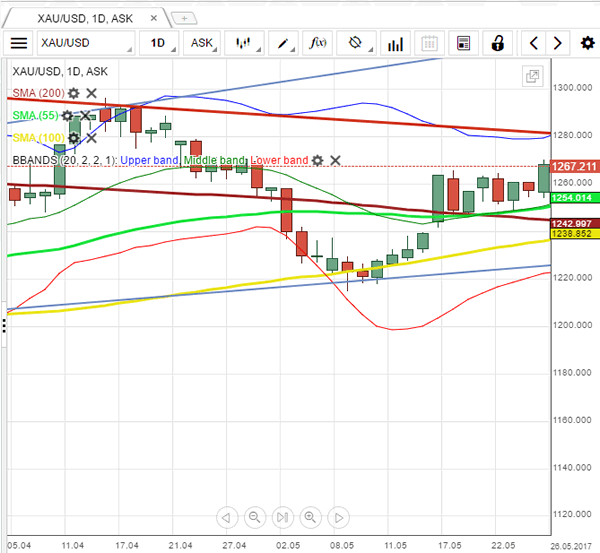
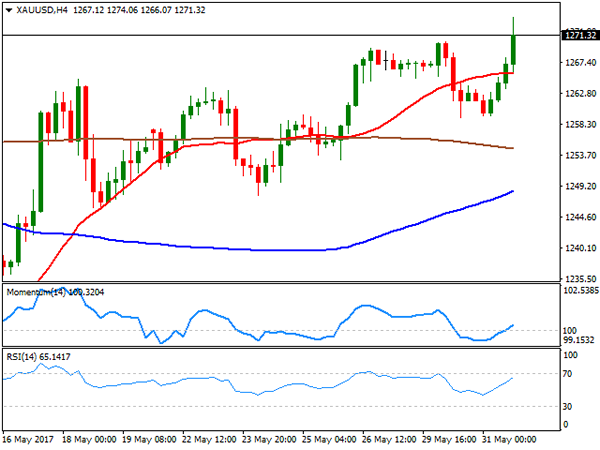
GOLD
Spot gold ended May on a higher note, up to its highest in over a month and settling at $1,271.43 a troy ounce. Weak US data weighed on the greenback, with investors now speculating whether the Fed will be able to act this June, and if it does as a matter of credibility, how long will it take to move rates again. The sour tone of equities, also backed the safe-haven metal. Gains have been moderated, but the daily chart supports additional advances given that technical indicators have turned back north near overbought readings, whilst the price holds above bullish moving averages. In the 4 hours chart, the price surpassed a bullish 20 SMA, now offering an immediate support at 1,265.90, while technical indicators maintain their sharp bullish slopes after entering positive territory. The commodity has scope to extend its advance up to 1,295.40, April 17th high ahead of the June Fed's meeting.
Support levels: 1,265.90 1,254.60 1,245.20
Resistance levels: 1,274.05 1,283.10 1,295.40
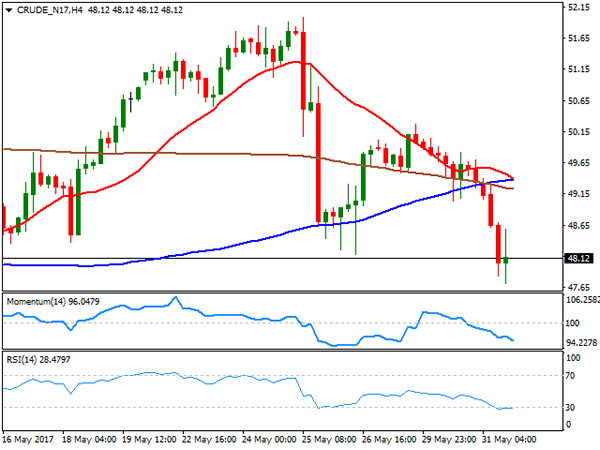
WTI CRUDE OIL
Crude oil prices plunged this Wednesday, with West Texas Intermediate crude futures settling at $48.12 a barrel. The commodity fell to its lowest in three-weeks ahead of the release of US stockpiles data, as speculative interest continues to believe that OPEC's decision was not enough to offset rising US production. The EIA is expected to report this Thursday a 3.2 million barrels' fall in crude-oil stockpiles, which may bring some relief to prices. In the meantime, the technical outlook is bearish, given that in the daily chart, the price has broken below a bearish 20 SMA with a long volume candle, while technical indicators have turned south, heading strongly lower now within bearish territory. Shorter term, the 4 hours chart also presents a bearish stance, with the Momentum indicator heading sharply lower below its 100 level, the RSI indicator consolidating around 28, and the price having accelerated after breaking below all of its moving averages, which converge in the 49.30/60 region.
Support levels: 47.70 47.10 46.45
Resistance levels: 48.60 49.30 49.90
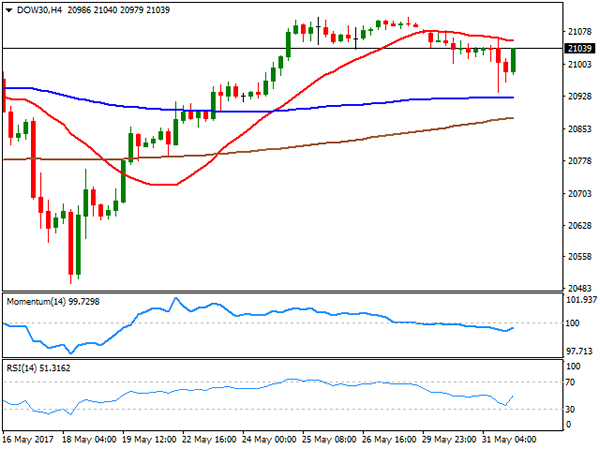
DJIA
US indexes closed again in the red, with the banking sector being the worst performer. The Dow Jones Industrial Average closed at 21,008.58, down 20 points, while the Nasdaq Composite settled at 6,198.52, down by 0.08% and the S&P closed at 2,411.80, having eased 0.05%. All of the three major indexes closed the month with gains, with the Nasdaq being the best, up in May by2.5%. Stocks started the day with a sour tone, plunging on soft local macroeconomic releases, but trimmed most of their losses after the corrected Chicago PMI was out. Within the Dow, Goldman Sachs was the worst performer, down 3.4% followed by JPMorgan that shed 1.98%. El du Pont was the biggest winner, up 1.65%, followed by Pfizer that added 1.63%. From a technical point of view, the DJIA remains within bullish territory but with no upward momentum, as the daily chart shows that the price bounced sharply on an approach to a horizontal 20 DMA, whilst technical indicators eased modestly near their mid-lines, but still above them. Shorter term, the 4 hours chart shows that a bearish 20 SMA continued to cap the upside, currently at 21,058, while technical indicators recovered modestly within bearish territory, lacking directional momentum and at neutral readings at the time being.
Support levels: 21,003 20,972 20,940
Resistance levels: 21,058 21,075 21,112
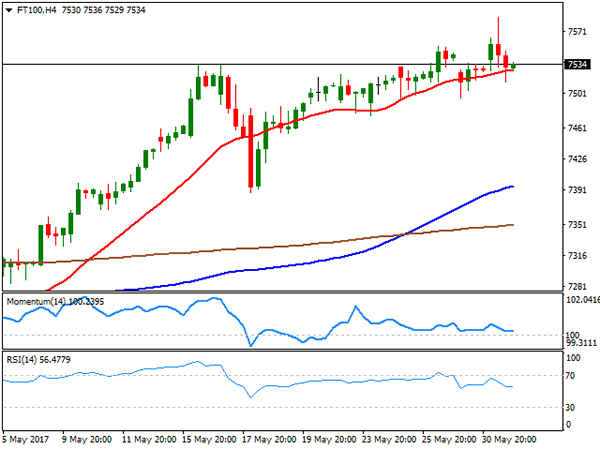
FTSE100
The FTSE 100 closed at 7,519.5, down 0.09% or 6 points daily basis, undermined by a re-surging Pound. The index peaked intraday at an all-time high of 7,587, as Brexit jitters prompted the Pound lower early London, although the movement was later reverted by a softer greenback and a new pre-election poll backing Conservatives. Randgold Resources led advancers with a 2.79% gain, supported by rising gold, but the mining-related bloc closed in the red as base metals eased. The worst performer was Rio Tinto, with a 2.53% decline, followed by BHP Billiton that closed down 2.45% and Glencore that shed 2.36%. Daily basis, technical indicators have eased from oversold readings, with the Momentum somehow anticipating a deeper correction ahead. Still the index is far above bullish moving averages, keeping the downward potential limited. In the 4 hours chart, the index is holding right around a bullish 20 SMA, while the Momentum indicator remains flat around its 100 level, and the RSI indicator pulled back within positive territory, hovering now around 54, also suggesting a possible downward corrective move ahead.
Support levels: 7,515 7,490 7,455
Resistance levels: 7,554 7,587 7,620
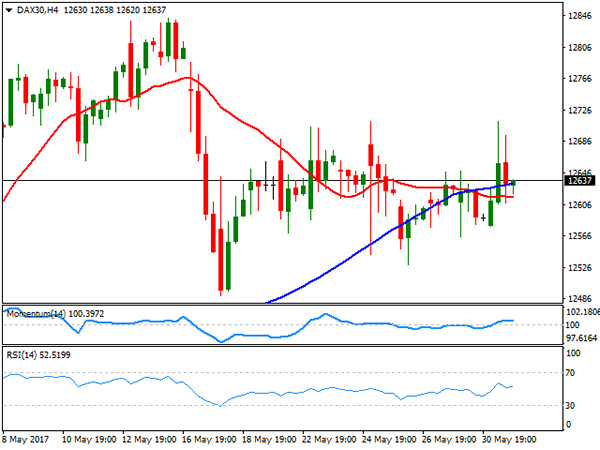
DAX
European equities saw strong swings this Thursday, but closed mixed and not far from their daily openings. The German DAX settled at 12,615.06, up 16 points or 0.13%, pulling back from an intraday high of 12,711 on the back of poor European inflation figures. An advance in the utilities and pharmaceutical sectors helped the DAX to remain afloat, with E.ON leading the way higher, up 2.59% at the end of the day, followed by Fresenius that added 2.48%. Deutsche Bank led decliners, easing 2.94%, followed by Adidas that shed 1.94%. The index retains its neutral stance in the daily chart, as indicators continue heading nowhere around their mid-lines, whilst the intraday advance was once again contained by a modestly bullish 20 SMA. In the 4 hours chart, the benchmark settled around its 20 and 100 SMAs, both converging in a tight range, while technical indicators are also stuck around their mid-lines, reflecting the cautious mood persisting among investors.
Support levels: 12,602 12,542 12,490
Resistance levels: 12,675 12,729 12,800
Technical Outlook: EURUSD Is Looking For Final Break Above 1.1268 High, Rising Daily Tenkan-Sen To Contain Dips
The Euro is consolidating under fresh recovery high at 1.1256, just ticks below yearly high at 1.1268 (posted on 23 May), following strong two-day rally from 1.1100 zone, where correction from 1.1268 peak found support.
Candles of past two days are underpinning for final attack at 1.1268 barrier and resumption larger uptrend.
Long-tailed bullish candle on Tuesday showed strong downside rejection, with long bullish candle that was left on Wednesday, confirming renewed strength.
Sustained break above 1.1268 is needed to signal bullish resumption and extension of current fifth wave of five wave cycle from 1.0820 towards its Fibonacci expansion levels at 1.1322 (FE 238.2%) and 1.1370 (FE 261.8%) in extension.
Meantime, extended downticks are expected to find footstep above rising Tenkan-sen (1.1188), which guards strong support at 1.1160, loss of which would put near-term bulls on hold.
Res: 1.1256, 1.1268, 1.1300, 1.1322
Sup: 1.1227, 1.1205, 1.1188, 1.1160
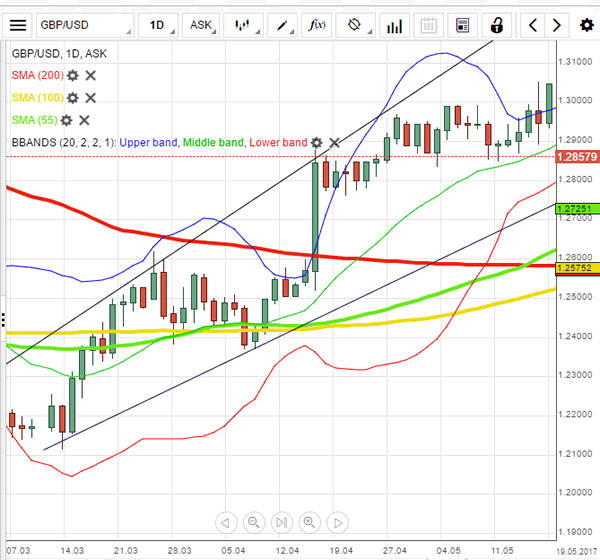
Trade Idea: GBP/USD – Hold short entered at 1.2920
GBP/USD – 1.2886
Recent wave: Wave V of larger degree wave (III) has ended at 1.1986 and major correction has commenced from there for gain to 1.3000 and 1.3140-50
Trend: Near term up
Original strategy :
Sold at 1.2920, Target: 1.2770, Stop: 1.2980
Position: - Short at 1.2920
Target: - 1.2770
Stop: - 1.2980
New strategy :
Hold short entered at 1.2920, Target: 1.2770, Stop: 1.2920
Position: - Short at 1.2920
Target: - 1.2770
Stop:- 1.2920
Although the British pound staged a strong rebound after marginal fall to 1.2769 yesterday, as sterling met resistance at 1.2921 and has retreated, retaining our bearishness and as long as this level holds, mild downside bias remains, below 1.2840 would signal the rebound from 1.2769 has ended, bring weakness to 1.2800, then retest of said support, break there would extend recent decline from 1.3048 to support at 1.2757 which is likely to hold on first testing.
Our preferred count on the daily chart is that cable's rebound from 1.3500 (wave (A) trough) is unfolding as a wave (B) with A ended at 1.7043, followed by triangle wave B and wave C as well as wave (B) has ended at 1.7192, the subsequent selloff is the larger degree wave (C) which is still unfolding with minor wave (III) of larger degree wave 3 ended at 1.1986, hence wave (IV) correction is in progress which could either be a triangle wave (IV) of a complex formation but upside should be limited to 1.3500 and price should falter well below 1.4000, bring another decline in wave (V) of 3 for weakness to 1.1500, then 1.1200.
On the upside, above 1.2921-26 (said resistance and previous support) would defer and suggest low has been formed instead, risk a stronger rebound to 1.2965-70 and possibly towards 1.3000 but only break of resistance at 1.3015 would signal the retreat from 1.3048 has ended.