Sample Category Title
Is Gold Really Recovering Or Will It Correct Lower This Week?
Key Points:
- Downside risks are increasing despite last week's excellent performance.
- Technical bias remains mixed.
- Interest rate speculation likely to see increased selling pressure this week.
Gold reversed its fortunes somewhat last week, moving higher and ending what has been its worst tranche of losses in a while. As a result, it may be worth taking a closer look at what was driving this price action and what it could mean moving forward. In particular, we should take a look at the fundamental and technical factors that have been impacting,and will continue to impact, the metal this week.
Starting with the week that was, last week saw gold have some of its best performance in some time despite a notable slide on Thursday following the uptick in the US Philadelphia Federal Manufacturing Index. Most of the gains came as a result of the market taking a risk-off approach on Wednesday as allegations swirled that Trump had interfered with the FBI investigation into his ties to Russia. The session saw US stocks go into free fall and the VIX spike from 10.61 to 15.59 – both developments encouraging traders to retreat to safe havens. The ultimate effect of the fresh bout of geopolitical risk meant that gold closed the week substantially higher at around the 1255.27 handle.
From a technical perspective, the big development has been gold surging above its 100 day EMA and the convergence of the 12 and 20 day averages. Taken together, this would suggest that gold is potentially entering a new uptrend. Interestingly, this would be in agreement with the Parabolic SAR reading which has been indicating that this has been the case for some time. Moreover, it would tend to indicate that the uptick in buying pressure last week is more than a knee-jerk reaction. However, contrary to this, we have also seen stochastics trend almost into overbought and the existence of a historical reversal point near the metal's current price could limit gains without some strong fundamental support.
Speaking of fundamentals, we are tentatively expecting to see this week's data put pressure on gold. More precisely, the bevy of speaking engagements from FOMC members and the release of the FOMC Meeting Minutes will be watched closely by those seeking to gauge the probability of us seeing a rate hike in the coming meeting. Currently, the probability of a hike is around 76% and any increase in this following the scheduled remarks or the minutes release will put pressure on gold prices, leading to a near-term reversal for the metal.
Ultimately, given the mixed nature of both the technicals and fundamentals, it's fairly hard to form a bias moving forward. However, on the balance of things, the evidence seems to suggest that downside risks may be on the rise due to the increasing chances of a US rate hike and the presence of that technical reversal zone. As a result, we have a fairly bearish view for the week to come but keep an eye on Trump as he has a propensity to impact the market erratically.
Euro Likely To Remain Fairly Neutral In The Week Ahead
Key Points:
- U.S. Preliminary GDP likely to be key in the week ahead.
- Initial bias for the week ahead is neutral.
- 1.1097 support likely to be key in the week ahead.
The Euro had a resoundingly positive week as the pair reacted to slipping greenback sentiment following a rise in U.S. political risk. In particular, news that President Trump might have attempted to interfere in the FBI investigation largely overshadowed the economic data. Subsequently, the Euro rallied sharply to close the week around the 1.1206 mark. Moving forward, monitor the U.S. Unemployment Claims and Core Durable Goods Orders figures.
Last week proved to be a positive one for the Euro Dollar after sentiment for the greenback sunk following news that President Trump might have attempted to influence the FBI investigation into the Russian election allegations. This caused an immediate rout to the Dollar and saw most of the cross pairs rising. Subsequently, the Euro gained strongly and rallied late into the week thereby closing around the 1.1206 mark. Fundamentally, the Eurozone GDP figures came in on target at 0.5% q/q whilst the CPI results proved robust at 1.9% y/y. On the U.S. side, the Unemployment Claims figures came in fractionally below estimates at 232k, whilst Industrial Production rose to 1.0%. Subsequently, despite a range of strong results from both economies, the focus was less about the results and more about the growing U.S. Political risk.
Looking ahead, the market's focus is likely to be primarily upon the bevy of U.S. economic data due out in the coming week. In particular, the release of the Fed's FOMC minutes will be closely watched for any signs that the central bank is gearing up for additional near term hikes. As far as actual data releases go, the Unemployment Claims and Core Durable Goods Orders are the key metrics that are likely to provide the market with some volatility. This time around, the Unemployment Claims are forecast at 238k but are likely to come in significantly below that level. Subsequently, watch the pair for any sharp moves following the aforementioned events.
From a technical perspective, the extension of the rally above the 1.1200 handle has likely exhausted the current move with the RSI and Stochastic Oscillators now trending sideways within overbought territory. Subsequently, there is plenty of scope for either a period of moderation or a pullback which predicates a neutral bias for the week ahead. Support is currently in place for the pair at 1.1097, 1.0954, and 1.0873. Resistance exists on the upside at 1.1211, 1.1343, and 1.1425.
Ultimately, the week ahead is likely to be all about the coming U.S. economic data and, hopefully, falling political risk from the Trump administration. Subsequently, the U.S. Preliminary GDP and Core Durable Goods Order figures are likely to be the key components in the pair's near term trend.
Weekly Technical Outlook And Review: EUR/USD, GBP/USD, AUD/USD, USD/JPY, USD/CAD, USD/CHF, DOW 30, GOLD
A note on lower timeframe confirming price action...
Waiting for lower timeframe confirmation is our main tool to confirm strength within higher timeframe zones, and has really been the key to our trading success. It takes a little time to understand the subtle nuances, however, as each trade is never the same, but once you master the rhythm so to speak, you will be saved from countless unnecessary losing trades. The following is a list of what we look for:
- A break/retest of supply or demand dependent on which way you're trading.
- A trendline break/retest.
- Buying/selling tails ... essentially we look for a cluster of very obvious spikes off of lower timeframe support and resistance levels within the higher timeframe zone.
- Candlestick patterns. We tend to only stick with pin bars and engulfing bars as these have proven to be the most effective.
We typically search for lower-timeframe confirmation between the M15 and H1 timeframes, since most of our higher-timeframe areas begin with the H4. Stops are usually placed 1-3 pips beyond confirming structures.
EUR/USD
Weekly gain/loss: + 276 pips
Weekly closing price: 1.1207
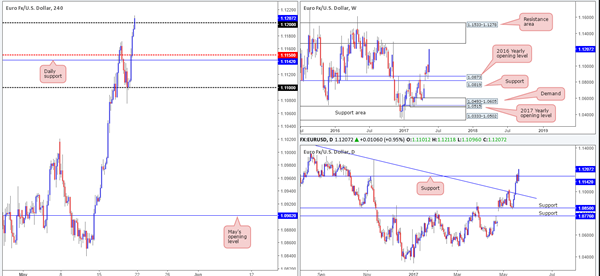
Across the board, the US dollar index plummeted last week, which, given its strong inverse correlation to the EUR/USD, helped the pair print hefty gains into the week's close. As can be seen from the weekly chart, price is currently lurking within striking distance of a major resistance area at 1.1533-1.1278. This base has capped upside on several occasions since mid-2015, so there's a healthy chance that history may repeat itself here!
Along similar lines, daily price recently crossed back above resistance at 1.1142 and ended the week forming a near-full-bodied bullish candle. Technically speaking, we see very little resistance on this scale until the unit connects with the said weekly resistance area.
A quick recap of Friday's movements on the H4 chart shows that the unit concluded the day marginally closing above the 1.12 handle, reaching a high of 1.1211. Above 1.12 the pathway appears relatively free up to resistance pegged at 1.1279, followed closely by the 1.13 handle.
Our suggestions: In view of the higher-timeframe picture, additional upside in this market is probable. With that in mind, and assuming H4 price remains above 1.12 at the open, a long trade on any retest seen at this psychological number could be an option, targeting the aforementioned H4 resistance line. Ideally, however, we would also like to see a reasonably sized H4 bull candle (preferably a full-bodied candle) take shape following the retest. This, for us, helps confirm buyer interest.
Data points to consider: Eurogroup meetings (all day). FOMC member Harker speaks at 3pm GMT+1.
Levels to watch/live orders:
- Buys: 1.12 region ([waiting for a H4 bullish candle to form following the retest is advised] stop loss ideally beyond the candle's tail).
- Sells: Flat (stop loss: N/A).
GBP/USD:
Weekly gain/loss: + 151 pips
Weekly closing price: 1.3033
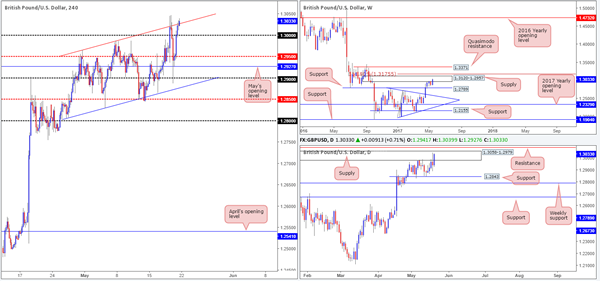
Over the last week, GBP bulls went back on the offensive after a brief pause around the underside of weekly supply coming in at 1.3120-1.2957. In the event that this supply is eventually consumed, the bulls will need to overcome the nearby 161.8% weekly Fib ext. at 1.3175 taken from the low 1.1986, before the weekly Quasimodo resistance at 1.3371 can be challenged.
Daily supply at 1.3058-1.2979, despite managing to cap upside on the 8th May, is currently under threat. Friday's bullish candle, which happened to print a near-full-bodied candle into the close, concluded trade within the upper limits of the said supply. Also of particular interest here is the resistance at 1.3085 sitting directly above that boasts strong historical significance.
Since the beginning of May, the H4 candles have been trading within an ascending channel (low: 1.2804 high: 1.2965). In the final hours of trade on Friday, nonetheless, price poked its head above the channel resistance line and marginally closed higher. Does this mean a breakout trade could be in play? Of course, this is a possibility, but it's not something our desk would feel comfortable trading knowing that both weekly and daily candles area trading within higher-timeframe structure.
Our suggestions: To our way of seeing things, the close above the aforementioned channel resistance is not a breakout signal, due to where price is trading on the bigger picture. Therefore, we believe the bears will drag this unit back into the channel on Monday and challenge the large psychological number 1.30. This level will be KEY in deciding direction. A rejection off this line will likely imply the bulls are going to attempt to break above the said higher-timeframe areas, and a violation of this number would likely lead to a move down to the H4 mid-level support at 1.2950, and possibly beyond.
On account of the above notes, we're going to remain flat for now. We'll look to assess how price action behaves when/if price tests 1.30, before making any further decisions.
Data points to consider: FOMC member Harker speaks at 3pm GMT+1.
Levels to watch/live orders:
- Buys: Flat (stop loss: N/A).
- Sells: Flat (stop loss: N/A).
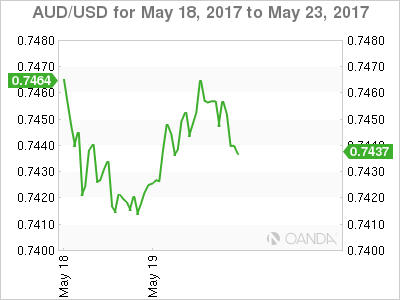
AUD/USD
Weekly gain/loss: + 71 pips
Weekly closing price: 0.7456
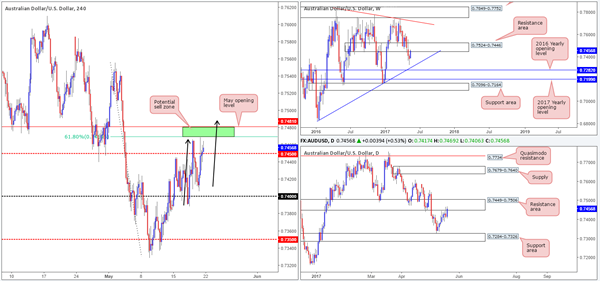
Following four weeks of downside momentum, the pair, as you can see, recovered last week and retested the underside of a weekly resistance area penciled in at 0.7524-0.7446. This structure has been in motion since mid-2016, so there's a reasonable chance that the bears may defend this barrier in the coming week. Should this come to fruition, the next base of interest seen below is a trendline support etched from the low 0.6827.
By the same token, daily price is also seen retesting the underside of a resistance area that's plotted within the weekly zone at 0.7449-0.7506. However, Friday's bullish engulfing candle is, we admit, a tad concerning here.
Leaving the 0.74 handle unchallenged, H4 bulls managed to take out the mid-level resistance at 0.7450 and come within inches of connecting with the underside of our pre-determined H4 sell zone (comprised of May's opening level at 0.7481 and a H4 61.8% Fib resistance at 0.7470 taken from the high 0.7556 [green zone]).
Our suggestions: Depending on where the market opens on Monday, our prime focus, for now, remains around the 0.7481/0.7470 neighborhood. Not only because this H4 sell zone is encapsulated within higher-timeframe structure, but also due to the market's overall trend facing south. And this, in our view, leads us to believe that the recent bullish move on the Aussie could, quite simply, be nothing more than a pullback.
However, as highlighted in Friday's report, one should expect a fakeout above this H4 zone to take place. The reason for why simply comes down to the potential H4 AB=CD approach taken from the low 0.7388 (see black arrows) terminating beyond the area.
Data points to consider: RBA Assist Gov. Debelle speaks at 6.30pm. FOMC member Harker speaks at 3pm GMT+1.
Levels to watch/live orders:
- Buys: Flat (stop loss: N/A).
- Sells: 0.7481/0.7470 ([waiting for a reasonably sized H4 bear candle, preferably a full-bodied candle, to form before pulling the trigger is advised] stop loss: ideally beyond the candle's wick).
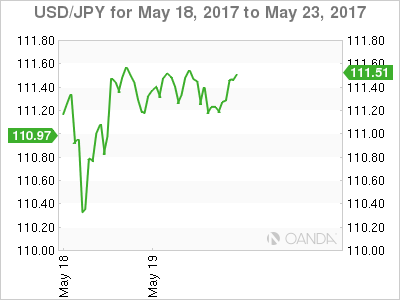
USD/JPY
Weekly gain/loss: – 207 pips
Weekly closing price: 111.26
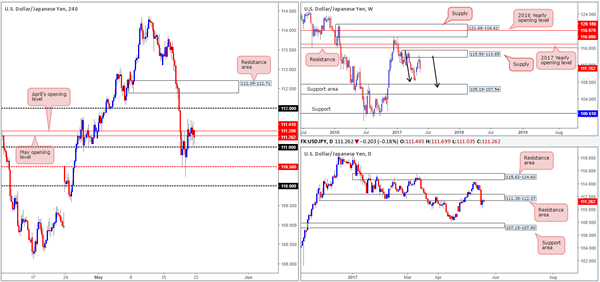
After an impressive rejection off weekly supply at 115.50-113.85 two weeks back, the bears further stamped in their authority last week, reaching a low of 110.23. We know there's a lot of ground to cover, but this rejection and follow-through move could be the beginnings of further downside in the form of a weekly AB=CD correction (see black arrows) into the weekly support area marked at 105.19-107.54.
In conjunction with weekly flow, price managed to run through bids at a support area drawn from 111.35-112.37 last week, which was recently retested and has so far held as resistance. The next area on the hit list falls in at 107.15-107.90: a support zone that's glued to the top edge of the said weekly support area.
A brief look at recent dealings on the H4 chart shows that price took on more of a sober approach on Friday, vacillating around April/May's opening levels at 111.41/111.29. As you can see, directly below current price sits the 111 handle, whereas to the upside we see that we have the 112 handle in sight.
Our suggestions: While both the weekly and daily charts indicate further selling could be on the cards this coming week, we would not feel comfortable shorting into bids at 111. We would, however, consider a sell on a close below 111, as this likely clears the pathway south down to at least the H4 mid-level support at 110.50.
110.50, in our opinion, provides a decent level to lock in some profits and reduce risk to breakeven. However, according to the higher-timeframe structure, price could potentially drive much lower than 110.50, so best to leave some on the table to take advantage of this!
Data points to consider: FOMC member Harker speaks at 3pm GMT+1.
Levels to watch/live orders:
- Buys: Flat (stop loss: N/A).
- Sells: 0.7481/0.7470 ([waiting for a reasonably sized H4 bear candle, preferably a full-bodied candle, to form before pulling the trigger is advised] stop loss: ideally beyond the candle's wick).
USD/JPY
Weekly gain/loss: – 207 pips
Weekly closing price: 111.26
After an impressive rejection off weekly supply at 115.50-113.85 two weeks back, the bears further stamped in their authority last week, reaching a low of 110.23. We know there's a lot of ground to cover, but this rejection and follow-through move could be the beginnings of further downside in the form of a weekly AB=CD correction (see black arrows) into the weekly support area marked at 105.19-107.54.
In conjunction with weekly flow, price managed to run through bids at a support area drawn from 111.35-112.37 last week, which was recently retested and has so far held as resistance. The next area on the hit list falls in at 107.15-107.90: a support zone that's glued to the top edge of the said weekly support area.
A brief look at recent dealings on the H4 chart shows that price took on more of a sober approach on Friday, vacillating around April/May's opening levels at 111.41/111.29. As you can see, directly below current price sits the 111 handle, whereas to the upside we see that we have the 112 handle in sight.
Our suggestions: While both the weekly and daily charts indicate further selling could be on the cards this coming week, we would not feel comfortable shorting into bids at 111. We would, however, consider a sell on a close below 111, as this likely clears the pathway south down to at least the H4 mid-level support at 110.50.
110.50, in our opinion, provides a decent level to lock in some profits and reduce risk to breakeven. However, according to the higher-timeframe structure, price could potentially drive much lower than 110.50, so best to leave some on the table to take advantage of this!
Data points to consider: FOMC member Harker speaks at 3pm GMT+1.
Levels to watch/live orders:
- Buys: 1.3457 ([pending order] stop loss: 1.3408).
- Sells: Flat (stop loss: N/A).
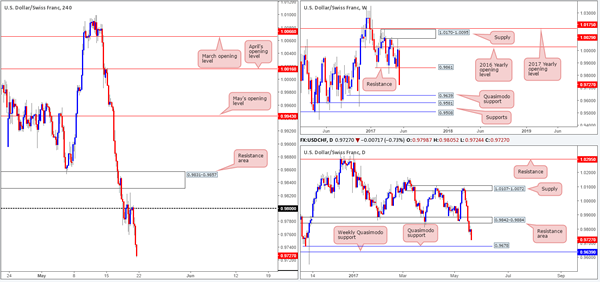
USD/CHF
Weekly gain/loss: – 281 pips
Weekly closing price: 0.9727
The CHF made considerable ground against the US dollar last week, with the USD/CHF closing in the shape of a strong-looking full-bodied bearish candle! Weekly support at 0.9861 was aggressively consumed, leaving the weekly Quasimodo support at 0.9639 in view.
Sliding down to the daily timeframe, we can see the support area at 0.9842-0.9884, which happens to hold the weekly support level mentioned above within, was taken out on Wednesday. In our estimation, this has placed the daily Quasimodo support at 0.9678 on the hit list, followed closely by the above noted weekly Quasimodo support.
For those who read Friday's report you may recall that our desk highlighted the possibility of selling from 0.98 if a reasonably sized H4 bearish candle took shape from here. As you can see, going into the early hours of London this occurred and price continued to decline in value for the remainder of the day! Well done to any of our readers who managed to jump aboard this move as price clocked a healthy low of 0.9724 on the day.
Our suggestions: With the H4 candles lurking within shouting distance of the 0.97 handle, we would be very cautious taking shorts in this market. The reason being is not only is 0.97 a watched number by the majority of traders, it also sits a little over 20 pips above the said daily Quasimodo support, which as we already know, is located just above the aforementioned weekly Quasimodo support.
So, with the above notes in mind, we may, should a H4 bullish candle (preferably a full-bodied candle) take shape between 0.9678/0.97 today/this week, look to go long from here and target the 0.98 hurdle. The reason for requiring this confirming candle is simply to avoid being faked on a push down to the weekly Quasimodo support.
Data points to consider: FOMC member Harker speaks at 3pm GMT+1.
Levels to watch/live orders:
- Buys: 0.9678/0.97 region ([waiting for a reasonably sized H4 bull candle, preferably a full-bodied candle, to form before pulling the trigger is advised] stop loss: ideally beyond the candle's tail).
- Sells: Flat (stop loss: N/A).
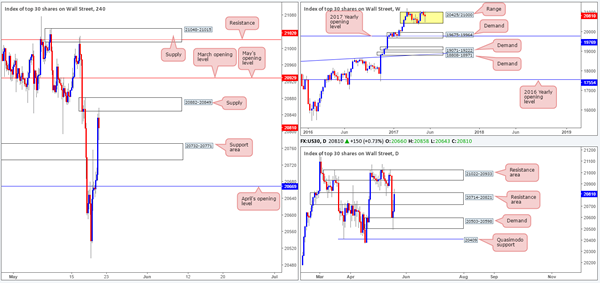
DOW 30
Weekly gain/loss: – 75 points
Weekly closing price: 20810
At this point, there's not really much we see that can be gathered from the weekly timeframe. The only salient point we feel noteworthy is the index appears to be chiseling out a consolidation around record highs of 21170 between 20425/21000.
Moving down to the daily timeframe, however, we can see that the unit extended Thursday's bounce from demand at 20503-20598 on Friday, and lifted price up to within the top edge of a resistance zone coming in at 20714-20821 by the close. Should this area fail, we don't have far to go until we reach the next area of importance: a resistance area pegged at 21022-20933.
Jumping across to the H4 timeframe, supply at 20882-20849 was brought into the action going into the closing bell. So far this zone looks as though it will continue to hold, but the concerning point is how far can price drop from here? Technically speaking, we see little wiggle room since there's a nearby support area marked at 20732-20771.
Our suggestions: Personally, we do not see much to hang our hat on here at the moment. Downside is limited to the said H4 support area, and upside is challenging given the current H4 supply and converging daily resistance area at 20714-20821.
Therefore, opting to stand on the sidelines for the time being may very well be the better path to take.
Data points to consider: FOMC member Harker speaks at 3pm GMT+1.
Levels to watch/live orders:
- Buys: 0.9678/0.97 region ([waiting for a reasonably sized H4 bull candle, preferably a full-bodied candle, to form before pulling the trigger is advised] stop loss: ideally beyond the candle's tail).
- Sells: Flat (stop loss: N/A).
DOW 30
Weekly gain/loss: – 75 points
Weekly closing price: 20810
At this point, there's not really much we see that can be gathered from the weekly timeframe. The only salient point we feel noteworthy is the index appears to be chiseling out a consolidation around record highs of 21170 between 20425/21000.
Moving down to the daily timeframe, however, we can see that the unit extended Thursday's bounce from demand at 20503-20598 on Friday, and lifted price up to within the top edge of a resistance zone coming in at 20714-20821 by the close. Should this area fail, we don't have far to go until we reach the next area of importance: a resistance area pegged at 21022-20933.
Jumping across to the H4 timeframe, supply at 20882-20849 was brought into the action going into the closing bell. So far this zone looks as though it will continue to hold, but the concerning point is how far can price drop from here? Technically speaking, we see little wiggle room since there's a nearby support area marked at 20732-20771.
Our suggestions: Personally, we do not see much to hang our hat on here at the moment. Downside is limited to the said H4 support area, and upside is challenging given the current H4 supply and converging daily resistance area at 20714-20821.
Therefore, opting to stand on the sidelines for the time being may very well be the better path to take.
Data points to consider: FOMC member Harker speaks at 3pm GMT+1.
Levels to watch/live orders:
- Buys: 1249.2 ([live] stop loss: breakeven).
- Sells: Flat (stop loss: N/A).
European Open Briefing: Risk Appetite Improved In Asia
Global Markets:
- Asian stock markets: Nikkei up 0.45 %, Shanghai Composite fell 0.25 %, Hang Seng rallied 0.90 %, ASX 200 rose 0.80 %
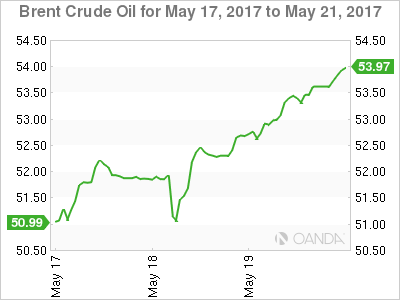
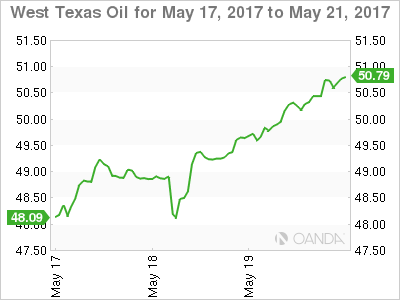
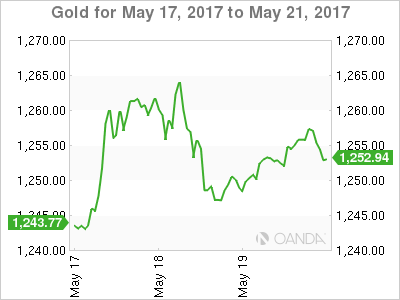
- Commodities: Gold at $1252 (-0.10 %), Silver at $16.88 (+0.50 %), WTI Oil at $51.20 (+1.00 %), Brent Oil at $54.10 (+0.90 %)
- Rates: US 10-year yield at 2.25, UK 10-year yield at 1.10, German 10-year yield at 0.36
News & Data:
- UK Rightmove House Prices (MoM) May: 1.2% (prev 1.1%)
- UK Rightmove House Prices (YoY) May: 3.0% (exp 2.0%; prev 2.2%)
- Japan Trade Balance (JPY) Apr: 481.7B (exp 520.7B; rev prev 614.0B)
- Japan Trade Balance Adjusted (JPY) Apr: 97.6B (exp 259.6B; prev 172.2B)
- Japan Exports (YoY) Apr: 7.5% (exp 8.0%; prev 12.0%)
- Japan Imports (YoY) Apr: 15.1% (exp 14.8%; prev 15.8%)
- PBoC Fixes USDCNY Reference Rate At 6.8673 (prev fix 6.8937 prev close 6.8870)
- Asian stocks post biggest rise in a month; dollar weak – RTRS
- Oil rises on expectation of extended, possibly deepened output cut – RTRS
- Dollar hovers near six-month lows amid U.S. political uncertainty – RTRS
CFTC Positioning Data:
- EUR long 37K vs 22K short last week
- GBP short 33K vs 47K short last week
- JPY short 60K vs 36K short last week
- CHF short 21K vs 15K short last week
- CAD short 98K vs 86K short last week
- AUD long 6K vs 26K long last week
- NZD short 12K vs 11K short last week
Markets Update:
Risk appetite improved in Asia, with most stock markets up on the day. Oil prices extended gains as well, which brought the US Dollar additionally under pressure. Meanwhile, Gold fell slightly as the demand for safe havens declined.
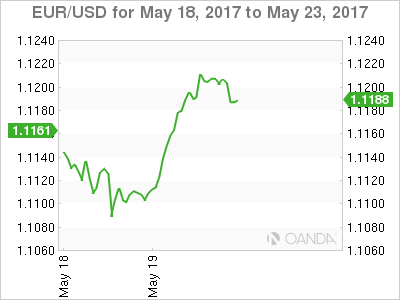
EUR/USD started the trading day around 1.1205, unchanged from Friday. During the Asian trading session, it fell to a low of 1.1180 before bouncing back to 1.1195. The Euro looks somewhat overbought in the near-term, and a correction seems likely. Support is seen at 1.1170 and 1.1120.
GBP/USD opened slightly lower in Asia and fell to 1.2970. However, the pair recovered quickly and is back above 1.30. The technical outlook remains positive, and following the break above 1.30 resistance, a rally towards 1.31 seems likely.
USD/JPY should benefit from the improved risk appetite. If the pair can take out resistance at 111.70, a rally towards 112.50 seems likely.
AUD/USD is still struggling with resistance at 0.7450 and 0.7470. Heavy resistance is then seen again at 0.7550. The short-term outlook is mixed.
Upcoming Events:
- 15:00 BST – FOMC Member Harker speaks
- 15:30 BST – FOMC Member Kashkari speaks
- 18:30 BST – RBA Assistant Governor Debelle speaks
The Week Ahead:
Tuesday, May 23rd
- 07:00 BST – Swiss Trade Balance
- 07:00 BST – German GDP
- 08:00 BST – French Manufacturing PMI
- 08:00 BST – French Services PMI
- 08:30 BST – German Manufacturing PMI
- 08:30 BST – German Services PMI
- 09:00 BST – Euro Zone Manufacturing PMI
- 09:00 BST – Euro Zone Services PMI
- 09:00 BST – German IFO Business Expectations
- 09:00 BST – German IFO Current Assessment
- 09:00 BST – German IFO Business Climate
- 10:00 BST – UK Inflation Report Hearings
- 14:45 BTS – US Services PMI
- 14:45 BST – US Manufacturing PMI
- 15:00 BST – US New Home Sales
- 15:00 BST – US Richmond Manufacturing Index
- 20:15 BST – FOMC Member Kashkari speaks
- 22:00 BST – FOMC Member Harker speaks
Wednesday, May 24th
- 01:30 BST – Australian Leading Index
- 09:30 BST – ECB Member Praet speaks
- 13:45 BST – ECB President Draghi speaks
- 15:00 BST – US Existing Home Sales
- 15:00 BST – Bank of Canada Rate Decision
- 15:30 BST – US Crude Oil Inventories
- 19:00 BST – FOMC Meeting Minutes
Thursday, May 25th
- 09:00 BST – RBA Assistant Governor Debelle speaks
- 09:30 BST – UK GDP
- 13:30 BST – US Initial Jobless Claims
- 15:00 BST – FOMC Member Brainard speaks
- 18:00 BST – ECB Member Constancio speaks
Friday, May 26th
- 08:00 BST – ECB Member Coeure speaks
- 13:30 BST – US GDP
- 15:00 BST – US Michigan Consumer Sentiment
Oil And Gold Looking Good In Asia Trading
Both oil and gold present constructive technical pictures mid-session in Asia following their Friday rallies.
Crude oil soared over two percent on Friday as rumours swirled that OPEC’s working group the ECB was considering recommending the double whammy of a production cut extension and deeper cuts ahead of this Thursday’s meeting. With the extension by OPEC and Non-OPEC already priced in, the added teaser of deeper cuts added fuel to the fire and capped an excellent week by both crude contracts.
We are somewhat sceptical that any more cuts can be on the agenda though, if only because of time constraints involved in thrashing out the details before Thursday. Having said that the market had discounted all hope of OPEC and Non-OPEC coming together to produce the cuts in January so maybe it is a case of where there is smoke, there is an oil fire.
Traders were not bothered with such thoughts, however, with Brent and WTI spots finishing Friday at their highs of 53.63 and 50.43 respectively. The positivity has carried on in early Asian trading with both contracts trading higher to start the week.
Brent spot trades at 53.75 and has closed above its 100-day moving average at 53.40, now initial support followed by the pivotal 52.40 region. Resistance lies in wait at 54.50.
WTI spot trades at 50.60, just below its 100-day moving average at 50.80 which is initial resistance followed by 52.00. Support sits in the 49.50 region followed by 47.90.
Both contracts look extremely constructive from a chart perspective, but both with be subject to the nuances of headlines as we approach Thursday’s meeting. We would expect choppy price action meaning traders should be nimble this week.
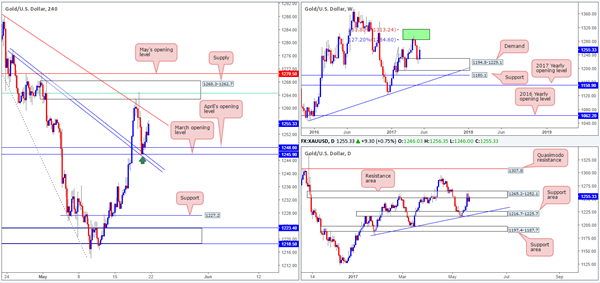
Gold
After Thursday’s massive pullback, gold found its mojo again on Friday, rising 10 dollars to 1256 as traders hedged weekend event risk. Unsurprisingly, some of that risk hedging has been unwound in early Asia trading with gold falling from 1258 to 1253 in the session and completely ignoring North Koreas latest missile test.
The price action overall remains constructive though as the U.S. Dollar continues to remain weaker against most of its G-10 currencies. The geopolitical heat is definitely rising again slowly, and this should ensure that gold remains bids on any material dips in the early part of this week.
Gold has support at 1246, a double bottom and its 200-day moving average followed by 1240. Thursday’s high at 1265 is initial resistance followed by the 1272 region.
Market Morning Briefing: Dollar Remains Weak
STOCKS
Dow (20804.84, +0.69%) is trading higher and has risen from levels below 20600 as mentioned last week. 21000 and higher levels of 21170 are important resistances on the upside. While 21000 holds, we may expect the near term to remain within the narrow 21000-20500 zone. Overall broader range of 21200-20400 remains intact for the long term.
Dax (12638.69, +0.39%) tested 12500 before bouncing back from there. Lower support is visible near 12300. A bounce beyond 12800 is not expected to be seen soon.
Shanghai (3095.44, +0.16) is testing resistance on the daily candles and while the immediate trend resistance holds, the price is directed to lower levels. A sustained break above 3120 is needed to take it towards higher levels of 3150-3170.
Nikkei (19659.15, +0.35%) bounced back from 19450 but does not look very bullish just now. While support near 110 holds on Dollar-Yen, Nikkei could try to move up towards 20010 or at least remain sideways within 20010-19300 region.
Nifty (9427.90, -0.02%) is holding well above immediate support near 9350 and while that holds, trade within the 9550-9350 region is possible for the next couple of sessions. Unless 9350 breaks on the downside, near term looks bullish.
COMMODITIES
Muted price action has been seen in Gold (1251). If 1249 holds on a closing basis then sideways consolidation within 1249-1280 continues though the same is not our proffered view. Thus we need to keep a close watch on the price action in Dollar Index (97.22) which could give some cue on further Gold direction. We will remain bearish while it is trading below 1280 levels and a close below 1249 could open up 1230 levels as well.
Similar kind of trading pattern has been seen in Silver (16.86) also. It is trading below 17 levels, thus a possibility of a sideways movement between 16.50-16.91 levels can’t be ruled out.
We were mentioning for last few weeks that 2.44 levels could be an area of strong support for copper, which might open higher levels for the scrip itself. Today copper (2.57) is trading above its crucial resistance of 2.55 and a close above 2.62 could open up 2.70 levels as well.
Brent (54.09) and WTI (50.80) had moved higher in line with our short term expectation. Brent is trading above its crucial resistance of 53.50, which could be a positive sign for the bulls, but WTI is still below 51.20 levels. If they will manage to hold these levels on a closing basis then we could see 56.20 in Brent and 52.51 in WTI within few trading sessions.Brent has to hold 53 levels throughout this week to sustain the bullish momentum. The only concern is the short term overbought condition and the outcome of this week's U.S crude oil inventories.
FOREX
Dollar remains weak with more downside left and the majors may rally further .
As expected, Dollar Index (97.17) resumed its downtrend after barely a day of pause and tested 97.00 in the last session. Our targets of 96.50-00 may be achieved this week with the trend firmly down in all timeframes.
Euro (1.1191) has achieved our target of 1.1200 but the rise may not be over and the next target of 1.1300 may be met in the next few sessions.
Dollar Yen (111.47) has been moving sideways in the range of 110-112 just as expected which may continue for another couple of sessions.
Pound (1.3003) has sustained above the support of 1.2870, keeping the trend up and the target of 1.3200 can still be achieved as the currency trades at a 8-month high.
Aussie (0.7443) is stuck in the narrow range of 0.7400-70 after its rejection from our resistance 0.7470 last week. Repeat - only a successful break above 0.7470-0.7500 may negate the possibility of seeing the downside targets of 0.7300-0.7290 and bring bullish options on the table.
While our Dollar Rupee (64.64) target of 65.00 has been met as expected but the closing price of 64.64 keeps the next directional path unresolved. The sharp rejection from 65.00 definitely brings back the possibility of a resumption of the larger timeframe downtrend but on the other hand, the chances of another bounce towards 65.00 can’t be ruled out as long as the support of 64.55-50 holds.
INTEREST RATES
The US 10-5Yr (0.45%) has come off sharply and could be headed towards 0.42% in the near term. Overall trend looks down for the coming sessions.
The US yields have bounce slightly from support levels and could move higher in the near term. The 5Yr (1.80%), 10YR (2.25%) and 30Yr (2.91%) are up by 1-2bps compared to the previous session.
The UK 10YR (1.08%) is trading above support near 1% and while that holds, could try to move up towards 1.15% levels. The 20Yr (1.63%) on the other hand has some room on the downside towards 1.50% which could be tested in the coming sessions before we see a bounce from there.
The Japanese yield differentials are almost headed lower and looks bearish in the near term indicating that the yield curve is flattening.
A Lull In The Action
A Lull in the action
There was a slight improvement in market sentiment heading into week's end but likely driven by weekend position trimming, Brazil turbulence abating and market fatigue setting in.Indeed pressure on risk assets has lessened, but caution persists.
Last week's sharp spike in market demand for volatility suggests investors are unlikely to reload risk assets anytime soon and would be more disposed to await some clarity on the US political landscape.Given the market was positioned for a low volatility long carry trade summer, Wednesday moves were likely amplified as positions unwound from the most crowded and up until that time, the most profitable low volatility carry trade positions.
Political noise is very tough to trade and to cut through the constant babble and headline risk even more so. While we're likely to face additional challenging conditions and the madness can start up just as suddenly as it stopped, but on balance, I maintain a guardedly positive long-term outlook for US markets, as I expect a favourable response to US policy changes that are on the horizon. But the timing of these policies amongst broader political concerns is likely to persist and will continue to weigh on the dollar near term.
In the meantime, one needs to respect the blanket of political upheaval and investors rotation to non-USD safe havens. At the same time, however, the political noise could be grossly exaggerated.Regardless of the view, given discovery surrounding the political melodrama in the Foggy Dew will be a long drawn out fact finding mission, we could be in for an extended period of uncertainty. And it's market uncertainty which poses the greatest challenge for both bulls and bears
While political risk will continue to be a factor, as it has been since President Trump took office, Fed Speak could be this week's number one priority as the market searches for policy clarity especially in the wake of recent market turmoil. So far, Fed members have been shrugging off the market volatility, but this week's calendar is jammed with 2017 voters, so dealers will be looking for any suggestions, other than staying the course, which could send the greenback topsy-turvy and dollar bulls looking for life buoys to stay afloat. Fed minutes on Wednesday should play second fiddle to the plethora of Fed speak as the minute's views are dated given last week's tumult
In addition to Fed Speak, we have the all-important OPEC meeting on May 25. Amidst widespread expectations of an oil supply cut extension. Expect continued moves into petrol currencies like the CAD and MXN, and to a lesser extent, hard commodity plays like the AUD, all of which should l stand to gain over the short term. However, the longevity of these currency moves will greatly depend on OPEC. Unless the oil cartel comes through with deeper supply cuts, in the face of rising US shale production, forward selling pressure will likely intensify even more so with U.S. drillers adding more rigs by the week.
In commodity markets, crude oil soared 2% with Saudi Arabia's energy minister stating that “We think we have everybody on board” to extend output restrictions out to the end of March next year. Riding on Oil price coattails, Metals also enjoyed a bumper session, with both copper and iron ore both rising close to 2%. However, the Greenback continued to struggle and lost ground against most G10 currencies. Losses were more pronounced against the Euro as the EURUSD march higher has virtually gone unopposed and closed above 1.12 for the first time since October last year.
News flow was light over the weekend, and at the open, FX markets are trading around their Friday New York closing levels as dealers await the next catalyst.
Euro
The ECB rhetoric is starting to gather steam, but the Euro rapid ascent has seen traders cut longs into week's end despite a one-way street mentality on Thursday and Friday. Overall uncertainty is running high, and dealers will err on the side of caution when it comes to weekend headline risk.
The long term prospect for the Euro remains bright as capital inflows should continue to accelerate while an anticipated shift in ECB rhetoric in June should keep the Euro supported in a market looking for any excuse to sell the greenback.
Japanese Yen
Narrowing of US -JPY bond differentials and investors intent on non-US dollar safe havens should cap USD rallies near term. While the positive momentum in Euro ( EURJPY )trade has underpinned the USDJPY of late, if the greenback remains out of favour, given the escalation of US political risk, and without some hawkish rhetoric from the Feds, we could test 110 before a reversal above 113. Whether it's US politics, regional geopolitical risk or even Japanese domestic economic data, there are few reasons to sell JPY in this risk unfriendly environment.
Australian Dollar
There could be tactical buying ahead of the OPEC meeting as the knock on effect of the rising oil prices will likely underpin commodities in general. Whether this ends up little more than 15 minutes of fame type trade will greatly depend on OPEC. Also, the Aussie may get some support from tactical plays as the currency could play catch up to other G-10 moves as more US political concerns could turn into a broader US dollar sell-off.
Friday's price action was a mix of uncertainty coupled with short covering ahead of weekend headline risk with oil prices surging.Aussie bears have increased gross shorts to the largest level in three months according to the Commitment of Traders reporting week ending May 16, which may have factored into play
All in all, too many questions and not enough answers in the Aussie trade which should keep current ranges in place.
EM Asia
Dealers will pay close attention to both the open and market follow through in Indonesia capital markets after late Friday afternoon exhilaration on local EM desks when S&P lifted Indonesia's sovereign rating to BBB- (investment grade)from BB+.While the market was expecting this upgrade earlier in the year after a successful tax amnesty boosted the government coffers by $11 billion in revenue, it was a surprise none the less as investors were starting to give up hope. This rating upgrade will open the door to a panacea of investors which should prove to be a long-term boost to the Jakarta Composite Index and could underpin near term movements in the Rupiah
May is typically a weak month for EM risk, and when compounded with the latest political turmoil in the US, investors will likely shy away from of risk exposure, and if anything may continue to reduce expose in the most crowded EM Asia positions.
EURUSD – Resumes Its Medium Term Uptrend
EURUSD - With the pair rallying to close higher the past week, more strength is expected in the new week. Resistance comes in at 1.1250 level with a cut through here opening the door for more upside towards the 1.1300 level. Further up, resistance lies at the 1.1350 level where a break will expose the 1.1400 level. Conversely, support lies at the 1.1150 level where a violation will aim at the 1.1100 level. A break of here will aim at the 1.1050 level. All in all, EURUSD faces further bear pressure.
GOLD – Remains Biased To The Upside On Correction
GOLD - The commodity closed higher the past week leaving risk higher. On the downside, support comes in at the 1,250.00 level where a break will turn attention to the 1,240.00 level. Further down, a cut through here will open the door for a move lower towards the 1,230.00 level. Below here if seen could trigger further downside pressure targeting the 1,220.00 level. Conversely, resistance resides at the 1,260.00 level where a break will aim at the 1,270.00 level. A turn above there will expose the 1,280.00 level. Further out, resistance stands at the 1,290.00 level. All in all, GOLD looks to strengthen further.
Politics Drove the Markets as Dollar Tumbled While Euro Surged, Canadian Dollar Picked Up Strength With Oil
Dollar was sold off broadly last week as sentiments were rocked by political turmoil in the White House, regarding US President Donald Trump's alleged intervention in FBI investigation. Selloff in equities triggered massive safe haven flows into Swiss Franc and Japanese Yen. But Euro followed closely as political risks in the Eurozone faded and on ECB expectations. Commodity currencies performed poorly in spite of the rally in oil and gold price. Aussie and Kiwi ended the week as two of the weakest major currencies, just next to Dollar. Sterling and Canadian Dollar were among the weakest batch too but showed a turnaround as oil broke 50 handle. Political uncertainty in US is set to continue as former FBI director James Comey, fired by US President Donald Trump earlier this month, agreed to testify in open session before the Senate Intelligence Committee. Dollar is vulnerable to more selling against Euro and Yen.
Dollar index could be in a medium term correction
As noted during the week, the downside acceleration in the Dollar index is now raising the chance that fall from 103.82 is indeed a medium term correction. That is, the five wave sequence from 72.69 (2011 low) has completed at 103.82 last year. This is also reflected in the decisive break of 55 week EMA. Next near term focus is 61.8% retracement of 91.91 to 103.82 at 94.46. Sustained break there should pull the index down to key long term cluster support at 91.91 (38.2% retracement of 72.69 to 103.82 at 91.93) before having solid support for rebound. And this will now be the slightly favored case as long as 99.88 near term resistance holds.
10 year yield's fall halted but stays vulnerable
The decline in 10 year yield (TNX) somewhat halted after hitting 2.191. It's trying to draw support from 2.177 chart support, 55 week EMA (now at 2.175), as well as 55 month EMA (now at 2.186). Also, Friday's rebound in US stocks also helped stabilize yields. But TNX remains vulnerable to deeper decline too. Another round of downside acceleration will take out the mentioned cluster support level. And in that case, TNX could dive through 38.2% retracement of 1.336 to 2.621 at 2.130 to 61.8% retracement at 1.826 and below.
DOW in risk of a larger reversal
DJIA's rebound and close above 55 EMA last week showed some relief from selling pressure. But downside risk is quickly increasing. Firstly, lost of momentum is clear after hitting long term channel resistance. Secondly 55 week EMA has been staying below signal line for a while. Thirdly, bearish divergence condition is seen in daily MACD. 20379.55 support will be the key level to watch in near term and break there will at least bring deeper pull back to 38.2% retracement of 17883.56 to 21169.11 at 19914.02. And in that case, there is even risk of deeper fall to 55 week EMA (now at 19453.00). Meanwhile, in case of a break of 21169.11 and up trend resumption, we'll remain skeptical until there is solid proof of upside acceleration.
Politics, FOMC minutes, Eurozone data, BoC and oil to watch
There are a couple of things to watch in the coming week, politics aside. After all the sentiments shift and market volatility, the markets are still convinced that Fed will continue with a rate hike in June. Fed fund futures are pricing in 78.5% chance of that. Markets will look into minutes of the May 3 FOMC meeting to affirm that expectation. A bunch of Eurozone data will also be closely watched, including PMIs and German IFO sentiments. Euro's strength is built on optimism of improving Eurozone economic outlook. Also, there is expectation of an upgrade in ECB staff forecast in June, a hawkish twist in the press conference. And that could be followed by announcement of stimulus exit of some sort in September. More upside surprises in Eurozone data will give the common currency another boost.
Canadian Dollar will be a currency to watch this week. BoC is widely expected to hold interest rate unchanged at 0.50%. The central bank will likely maintain a neutral stance in spite of recent mixed batch of data. The Loonie, however, would possibly re-couple with oil price again. This could be seen in the late dive in USD/CAD through 1.3534 key support level, accompanied by WTI crude oil's surge through 50 handle. The rally in WTI should have confirmed that the fall from 55.24 has completed as a corrective move to 43.76, after drawing support from 38.2% retracement of 26.05 to 55.234 at 44.09. The rally in oil price is set to extend to 53.76/55.24 resistance zone. That would possibly pull USD/CAD lower to 1.3222 support level.
Trading strategy - Hold EUR/AUD long, sell USD/CAD
Regarding trading strategies, we bought EUR/AUD at 1.4790 last week and the strategy is correct so far as EUR/AUD jumped to as high as 1.5074. The cross lost momentum ahead of 1.5094 resistance but there is no clear sign of topping yet. We maintain the view that the trend in EUR/AUD has reversed and further rise should be seen to 1.5455 fibonacci level and above. Hence, we'll hold on to the long position while raising the the stop from 1.4640 to 1.4850 to protect our profits in case of rejection from 1.5094. 1.4850 is slightly below 4 hour 55 EMA.
As mentioned above, we're expecting more weakness in Dollar in near term. Euro will likely be the better performer in the markets but we've already got EUR/AUD on hand. USD/JPY's fall hesitated a bit after hitting 110.23 and therefore we prefer not to sell this one. Instead, we'll turn to sell USD/CAD at market this week for anticipation of more strength in oil. Stop will be set at 1.3600, with slightly above 1.3570 minor resistance. 1.3222 is seen as the first target. We'll assess the outlook later to decide the chance for reversing the whole trend from 2016 low at 1.2460.
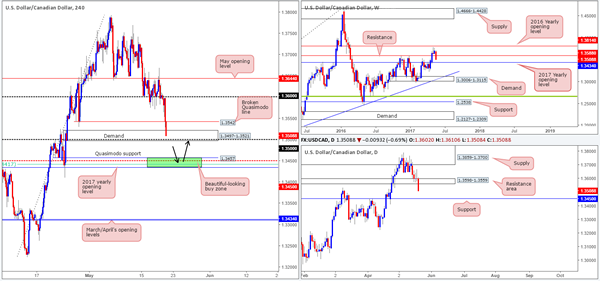
USD/CAD Weekly Outlook
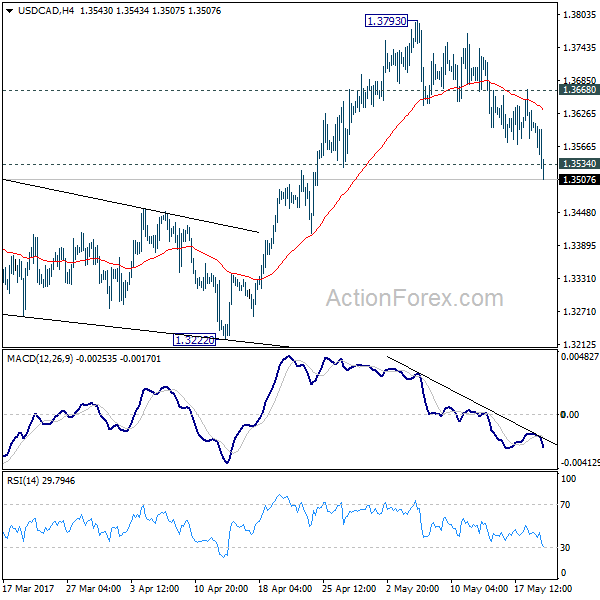
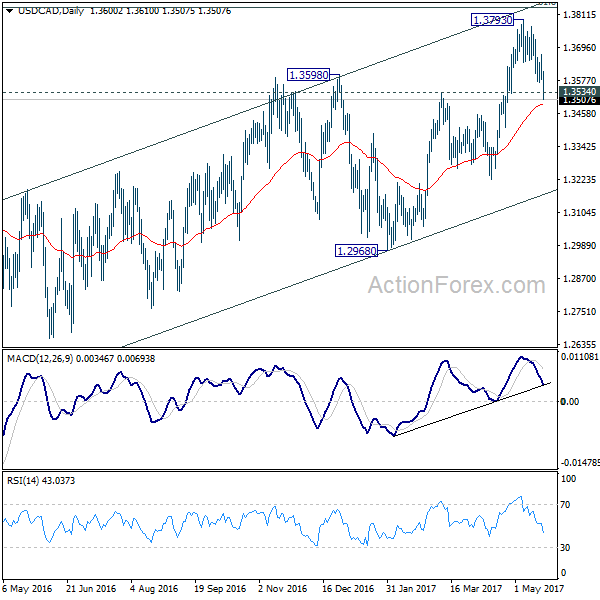
USD/CAD's fall from 1.3793 extended to as low as 1.3507 last week and broke 1.3534 resistance turned support. The development confirmed completion of rise from 1.2968. Initial bias remains on the downside for 1.3222 support next. Also, the corrective rally from 1.2460 could have finished too, ahead of 1.3838 fibonacci level. Break of 1.3222 will affirm this case and target 1.2968 key support level for confirmation. On the upside, break of 1.3668 minor resistance is needed to indicate completion of the fall from 1.3793. Otherwise, outlook will remain cautiously bearish in case of recovery.
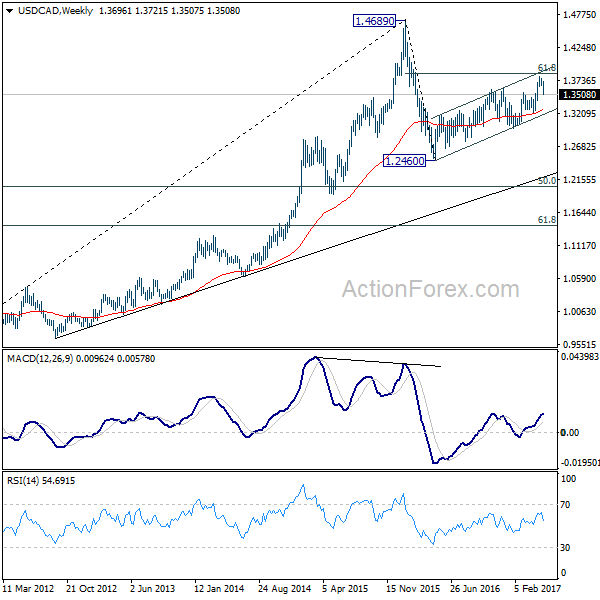
In the bigger picture, price actions from 1.4689 medium term top are seen as a correction pattern. The first leg has completed at 1.2460. Rise from 1.2460 is seen as the second leg and would end at around 61.8% retracement of 1.4689 to 1.2460 at 1.3838. Break of 1.3222 should indicate the start of the third leg while further break of 1.2968 should confirm. Nonetheless, sustained trading above 1.3838 would pave the way to retest 1.4689 high.
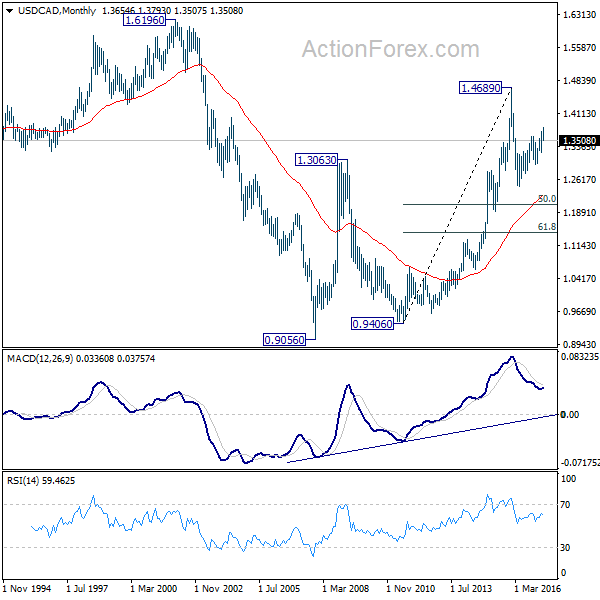
In the longer term picture, rise from 0.9056 (2007 low) is viewed as a long term up trend. It's taking a breath after hitting 1.4689. But such rise expected to resume later to test 1.6196 down the road.