Sample Category Title
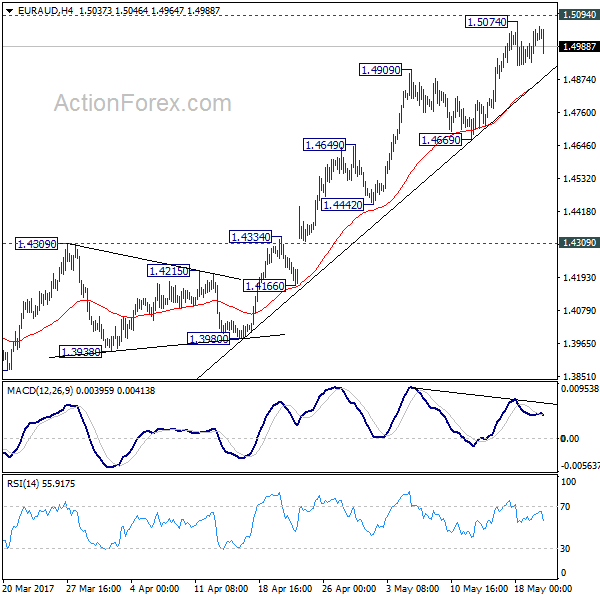
EUR/AUD Daily Outlook
Daily Pivots: (S1) 1.4954; (P) 1.5000; (R1) 1.5066; More...
Intraday bias in EUR/AUD remains neutral as consolidation from 1.5074 continues. Downside of retreat should be contained above 1.4669 support and bring rise resumption. We're holding on to the bullish view that the medium term trend has reversed. Break of 1.5094 resistance will extend the rally from 1.3624 to next medium term fibonacci level at 1.5455. However, considering bearish divergence condition in 4 hour MACD, break of 1.4669 will confirm short term topping and bring deeper pull back, possibly to 55 day EMA (now at 1.4428).
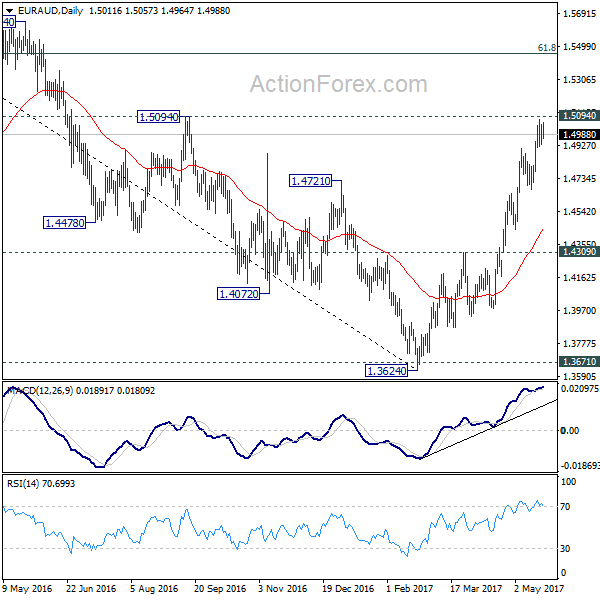
In the bigger picture, price actions from 1.6587 medium term top are viewed as a corrective pattern. Such correction should be completed at 1.3624 after defending 1.3671 key support. Rise from 1.3642 is now expected to target 61.8% retracement of 1.6587 to 1.3624 at 1.5455 and above. In any case, outlook will now stay cautiously bullish as long as 1.4309 resistance turned support holds.
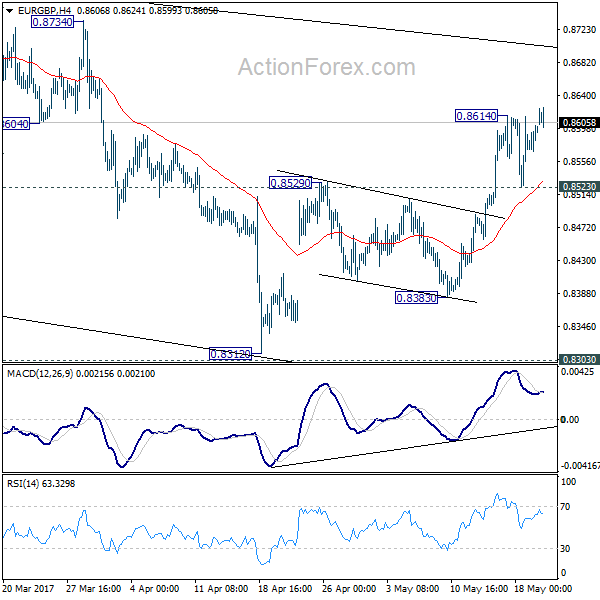
EUR/GBP Daily Outlook
Daily Pivots: (S1) 0.8575; (P) 0.8588; (R1) 0.8608; More...
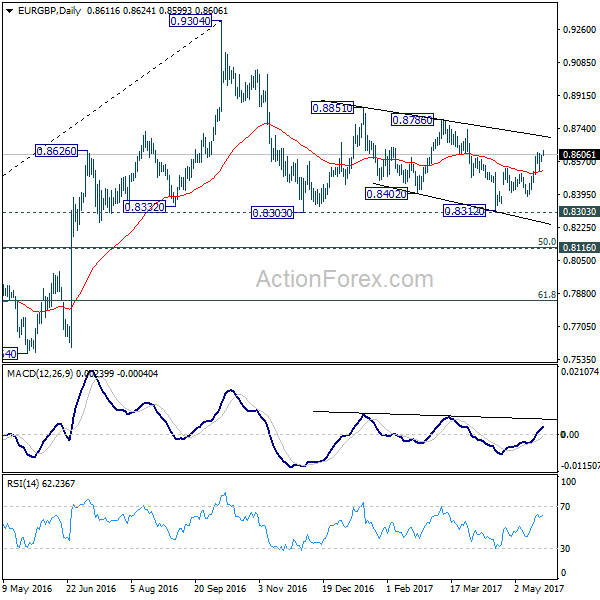
Break of 0.8614 suggests that EUR/GBP's rebound from 0.8312 is resuming. Intraday bias is turned back to the upside for 0.8786 resistance next. Overall, price actions 0.9304 are viewed as a medium term corrective pattern that is extending. As EUR/GBP has just defended 0.8303 resistance. Break of 0.8786 could bring a retest on 0.9304 high. On the downside, below 0.8523 minor support will turn bias back to the downside for 0.8383 support instead.
In the bigger picture, price actions from 0.9304 are viewed as a medium term corrective pattern. In case of deeper fall, we'd expect strong support from 0.8116 cluster support (50% retracement of 0.6935 to 0.9304 at 0.8120) to contain downside. Rise from 0.6935 (2015 low) will resume at a later stage to 0.9799 (2008 high). However, sustained break of 0.8116 could bring deeper decline to next key support level at 0.7564 before the correction completes.
Market Update – Asian Session: Japan Trade Surplus Smaller Than Forecast
Asia Mid-Session Market Update: Japan Trade surplus smaller than forecast; North Korea launches another test missile
Friday US Session Highlights
OPEC Panel said to be considering scenario of deepening and extending oil supply cut agreement following meeting with non-member on Friday, May 19th - financial press
(US) Speaker Ryan: Congress won't undercut Pres Trump's military budget - comments in DC
(US) Fed's Bullard (non-voter, dovish): do not expect growth much above 2% in 2017; drop in long-term yields and inflation expectations suggest Fed may be moving too fast
(BR) Fitch affirms Brazil's BB ratings
(US) New York Fed Nowcast: raises Q2 GDP forecast to 2.3% from 1.9% from 5/12
Politics
(IR) Iran President Hassan Rouhani wins second term with 57% of the vote, defeating Hard-liner Ebrahim Raisi
(US) President Trump’s budget said to cut entitlements by $1.7T – US financial press
(UK) According to the latest Survation survey, ruling Conservative party's lead on Labour has narrowed to 43% to 34% - press
(ES) Spain’s Pedro Sanchez expected to win Socialist party elections by a margin of 49.6% vs 40.2% for Susana Diaz
(JP) Japan Cabinet Approval rating declines by 5 pct points to 46% - Japanese Press
Weekend US/EU Corporate Headlines
HUN: Said to be close to all-stock merger agreement with Clariant; Combined enterprise value $20B - US financial press
F: Reportedly CEO Mark Fields to be replaced by James P. Hackett - press
(SA) US to sign $110B of military contracts as part of memorandum of intent to support Saudi defense
Key economic data:
(JP) JAPAN APR TRADE BALANCE: ¥482B V ¥521BE; ADJ TRADE BALANCE: ¥97.6B V ¥260BE
(KR) South Korea Custom Agency: South Korea May 1-20 exports +3.4% y/y, imports +11.6% y/y
(KR) South Korea April Producer Prices M/M: -0.1% v 0.0% prior; Y/Y: +4.0% v +4.3% prior
Asia Session Notable Observations, Speakers and Press
Asian equity markets are mostly higher, tracking 2nd day of gains on Wall st on Friday as investors bought the Trump political controversy dip. Energy sector is performing particularly well, with Crude Oil prices rising above $51/brl - a 1-month high - on chatter of OPEC supply cut extension.
In FX, renewed risk-on flows translated into JPY weakness, as USD/JPY rose some 60pips from opening lows. Commodity currencies AUD and NZD are rangebound despite the jump in iron ore prices. GBP underperformed following UK press report citing Brexit min Davis threatening pullout out from Brexit negotiation if EU imposes a penalty as part of the deal. Separately, UK's Survation poll for the upcoming elections saw PM May and Conservatives' lead slip to single digits, shrinking in half.
Over the weekend, US Pres Trump kicked off his Middle East trip with first stop in Saudi Arabia, where he signalled US is signing some $110B of military contracts as part of memorandum of intent to support Saudi defense. Saudi Oil Min Al-Falih also said OPEC and non-OPEC producers are on course to back an agreement extending the oil supply deal by a further nine months. Also of note in the region, Iranian Pres Rouhani defeated hard-line candidate Raisi by a wide margin in re-election for 2nd term.
In economic data, Japan trade surplus was smaller than expected on bigger than anticipated rise in imports than exports, though both were in positive territory for 5th and 4th month respectively. Shipments to Asia and China were up mid-teens again, while export growth to US and Europe grew low single digits.
Korean peninsula remained in focus with another ballistic missile test by Pyongyang. Projective said to have flown about 500km, and South Korea defense officials suggested today's test did provide "meaningful data" to the North.
China
(CN) China PBOC Q1 Monetary Policy Operations Report: Concerned by the aggregate impact of different regulatory agencies all tightening at the same time, to enhance cooperation to stabilize the market
(CN) China FX regulator (SAFE) head Pan Gongsheng: China's current cross-border capital flows are stabilizing and improving - press
(CN) China Commerce Ministry (MOFCOM) to implement a 45% duty on out of quota sugar imports for 1-yr from May 22nd
Japan
(JP) Japan summer bonuses decline by 2.8% y/y, first decline in 5 years – Japanese Press
(JP) Japan Cabinet Approval rating declines by 5 pct points to 46% - Japanese Press
Australia / New Zealand
(AU) CoreLogic: 77% of Australia property auctions were successful in the capital cities last week, up from 73% prior - press
(AU) S&P cuts various banks in Australia on which it previously had Negative Outlook
(NZ) New Zealand growth forecast expectations to be unveiled with this week's budget to be upbeat - NZ Press
Korea
(KR) North Korea leader Kim Jong Un said to have supervised a test firing of a ballistic missile
(KR) Japan chief cabinet Seg Suga: Considering unilateral sanctions on North Korea
Asian Equity Indices/Futures (00:30ET)
Nikkei +0.5%, Hang Seng +0.9%, Shanghai -0.2%, ASX200 +0.8%, Kospi +0.5%
Equity Futures: S&P500 +0.1%; Nasdaq +0.2%, Dax +0.1%, FTSE100 -0.1%
FX ranges/Commodities/Fixed Income (00:30ET)
EUR 1.1180-1.1210; JPY 111.00-111.60; AUD 0.7435-0.7620; NZD 0.6910-0.6940; GBP 1.2975-1.3025
June Gold -0.1% at 1,252/oz; June Crude Oil +0.9% at $51.14/brl; July Copper -0.5% at $2.57/lb
SPDR Gold Trust ETF daily holdings fall 1.2 tonns to at 850.7 tonnes; 6th straight decline
(US) Weekly Baker Hughes US Rig Count: 901 v 885 w/w (+1.8%) (18th straight weekly rise)
(CN) PBOC SETS YUAN MID POINT AT 6.8673 V 6.8786 PRIOR
(CN) PBOC to inject combined CNY40B v skipped prior
(KR) South Korea MOF sells 10-yr bonds;avg yield 2.270%
Asia equities / Notables / movers
Australia
Alumina (AWC) +4.2%; Names new CE) / Rise in metals
WorleyParsons (WOR) +0.5%; Announces 5-yr framework agreement with Shell, financial terms not disclosed
Surfstitch (SRF) -26.5%; Guides FY17
Hong Kong
Kingsoft Corp (3888) +3.8%; Q1 result
Cathay Pacific (293) +1.8%; Restructuring / job cuts
Melbourne Enterprises (158) +0.6%; H1 result
Japan
Rakuten (4755) +3.1%; Launches JV project 'Rakuten Trade'
Sharp (6753) +3.0%; Partners SoftBank's tech fund
Sony (6758) +0.1%; FY17 result speculation
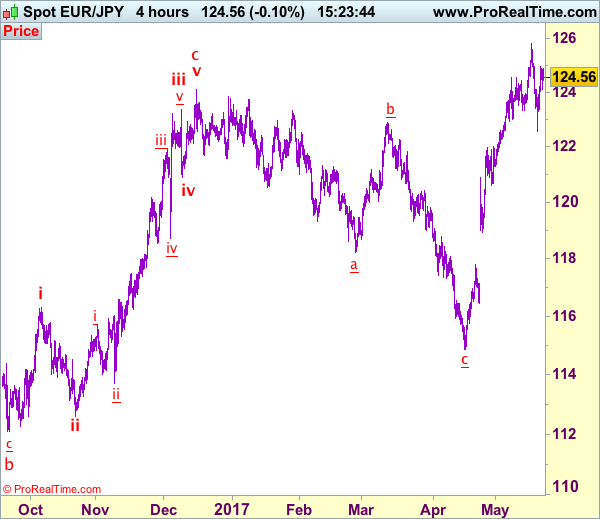
Trade Idea: EUR/JPY – Stand aside
EUR/JPY - 124.52
Recent wave: wave v of (C) ended at 94.12 and major correction in wave A has ended at 149.79
Trend: Near term up
New strategy :
Stand aside
Position: -
Target: -
Stop:-
Although the single currency staged a strong rebound after slipping to 122.56 last week, reckon upside would be limited to 125.05-10 and price should falter below recent high at 125.82, bring further choppy consolidation later. Only a break of this recent high would signal upmove has resumed and extend gain to 126.20-30 and possibly 126.60-70 but reckon 127.00-10 would hold from here due to near term overbought condition.
In view of this, would not chase this rise here and would be prudent to stand aside for now. Below 123,90-00 would bring retreat to 123.35-40 but reckon downside would be limited to 123.00 and said support at 122.56 should hold, bring another rebound. Only a break below this support would add credence to our view that top has been formed, bring retracement of recent upmove to 122.00-10 and then 121.50-60 but downside should be limited to 121.20-30.
Our latest preferred count is that wave (ii) is ABC-X-ABC which ended at 123.33 and wave (iii) is unfolding with wave iii ended at 100.77, followed by wave iv at 111.57 and wave v as well as the wave (iii) has ended at 97.04, followed by wave (iv) at 111.43 and wave (v) has ended at 94.12 which is also the end of the larger degree v, this also implied the major wave (C) has also ended there, hence major correction has commenced from there with (A) leg unfolding in its lower degree wave c which has possibly ended at 145.69. Under this count, A-B-C wave (B) has commenced with A leg ended at 136.23, wave B at 143.79 and wave C has possibly ended at 149.79.
Our larger degree count is that the decline from 139.26 is wave (C) and is sub-divided into a diagonal triangle i-ii-iii-iv-v with wave i - 105.44, wave ii- 123.33, wave iii - 97.03, wave iv - 111.43, followed by the final wave v as well as the end of wave (C) at 94.12, this also mark the bottom of larger degree wave B. Under this count, major rise in wave C has commenced as an impulsive wave with minor wave III ended at 145.69, wave V is still in progress for further gain to 150.00. Having said that, this so-called wave V could well be the first leg of larger degree 5-waver wave C and this wave C should bring at least a retest of wave A top at 169.97 (July 2008).
Currencies: Dollar Still Doesn’t Profit From Risk-Rebound
Sunrise Market Commentary
- Rates: Some downside correction as risk sentiment improves?
Friday, equities continued their rebound and overnight Asian equity trading suggests some continuation today. With little on the calendar, we favour technical sentiment driven trading. Core bonds might come under some mild downward pressure. No key supports seem to be in danger. - Currencies: Dollar still doesn't profit from risk-rebound
On Friday, the Trump-tensions eased further, but the improved risk-sentiment didn't help the dollar. EUR/USD jumped to the 1.12 area. Today, global sentiment will again set the tone for USD trading. Will the dollar finally get some downside protection from higher yields and rising equities?
The Sunrise Headlines
- US equities closed Friday's session with good gains and have now about halved the losses of earlier last week when president Trump came in problems. Asian equities start the week on a solid footing.
- President Trump dialed back his criticism of Islam while basking in a slew of praise from Gulf leaders during a visit to Saudi Arabia. Defence contracts worth about $110 billion were announced. Today, he visits Israel, where the PM is set to ask him for tougher sanctions on Iran.
- The ECB will need to 'demonstrate backbone' when price pressures increase again, ECB Weidmann said. 'At the present time, it's indisputable that an expansive monetary policy is appropriate. However, there are diverting views on the necessary degree of monetary expansion and on the instruments that we use'.
- EU ministers have a busy day in Brussels, trying to clinch a deal on a Greece bailout while also laying out their Brexit negotiating positions.
- The U.K. will quit talks on leaving the European Union unless the bloc drops its demands for a divorce payment as high as €100B, Brexit Secretary David Davis said. Britain's negotiations would otherwise be plunged into 'chaos'.
- S&P affirmed the Dutch AAA rating, stable outlook. It anticipates small budget surpluses over 2017/20 and a further reduction of the debt ratio.
- OPEC and other producers agreed on extending oil output cuts by nine months, according to Saudi's energy minister. 'We think we have everybody on board,' Khalid Al-Falih said. Brent oil traded overnight just above $54/barrel.
- Brazilian real and equities rose as traders seem less sensitive to fresh news tied to JBS plea bargain deal. The Supreme Court will on Wednesday decide on Temer's request to suspend the inquiry until the authenticity of the clandestine recording be definitively verified.
- The Market calendar is light. The Eurogroup meeting, Trump's trip and speeches of Kashkari and Harker are the only events.
Currencies: Dollar Still Doesn't Profit From Risk-Rebound
USD still struggles even as risk sentiment improves
On Friday, dollar weakness still dominated FX markets. Remarkably, the decline of the dollar occurred as the Trump crisis eased and as risk sentiment improved. Still, EUR/USD and EUR/JPY remained in the driver's seat. EUR/USD regained the 1.12 barrier and close the session at 1.1206. Interest rate differentials narrowed slightly in favour of the euro. The gains of USD/JPY were non-existent given improved US/global risk sentiment. The pair close the session at 111.26 (from 111.49).
Overnight, Asian equities join Friday's US rebound. A further rebound in the oil price is supporting oil- and commodity related assets. The focus on the US political scene turned away from the links of the Trump campaign with Russia to the visit of the President to the Middle East. The constructive risk sentiment still doesn't help the dollar much. EUR/USD is trading just below 1.12, still within reach of Friday's top. USD/JPY dropped temporary below 111 overnight, but rebounded to the 111.50 area. Even so, the USD gains remain very modest.
Today, the eco calendars in EMU and the US are uneventful. Fed's Harker and Kashkari are scheduled to speak, but we don't expect them to change the markets' assessment on the Fed in a profound way. So, USD trading will again be driven by global sentiment. The headlines of president's Trump visit to Israel are a wildcard.
At the end of last week, we assumed that an easing of the Trump-crisis could slow the decline of the dollar. For now, core yields and the dollar hardly profited from the rebound of equities. The EUR/USD rebound was probably partially inspired by euro strength going into the June 08 ECB meeting. However, the mediocre performance of USD/JPY also suggests USD softness. We think that the USD correction has gone far enough, but it remains dangerous to row against the EUR/USD rally as long as interest rate differentials move (slightly) in favour of the euro. Investors are also cautious to be short euro going into the ECB meeting
In a longer term perspective, the recent turmoil maybe makes it more difficult for US equities to extend the record rally. At the same time, a June Fed rate hike is not in question and US yields are near important support levels. So, the dollar shouldn't lose much interest rate support anymore. In this context, we think that a sustained rebound of USD/JPY has become more difficult.
A cautious sell-on-upticks approach is preferred. We remain also sceptic on the safe haven characteristics of the euro if sentiment would turn really risk-off. In that context, EUR/JPY and EUR/USD might decline in lockstep. However, for now this scenario isn't in play
Technical picture.
The USD/JPY rebound ran into resistance twee weeks ago. Initially, it was no more than a correction, but Wednesday's sell-off/re-break below the 112.20 previous top aborted the uptrend and made the short-term picture negative. Return action lower in the 108.13/114.37 range is possible.
Earlier this month, it looked that EUR/USD could revisit the 1.0821/1.0778 support (gap). However, poor US data and political upheaval finally propelled EUR/USD north the 1.1023 range top. The correction tops at 1.1300/1.1366 is the next resistance. We think that USD sentiment will have to be extremely negative to clear this hurdle short-term. Further ST EUR/USD gains might become tougher. A return below 1.1023 would indicate that the upside momentum has eased.
EUR/USD: euro rally continues even as Trump-tensions ease .
EUR/GBP
EUR/GBP tests 0.86 on euro strength
On Friday, sterling trading was primarily driven by the broader moves in the dollar and the euro. EUR/GBP held a very tight sideways range in the high 0.85 area and closed at 0.8596 as EUR/USD rebound well bid. The swings in cable were more pronounced. The pair copied the intraday gains of EUR/USD and returned north of 1.30, to close the day at 1.3036. The CBI order data were better than expected, but the price component of the report was slightly softer than expected.
Overnight, the Rightmove house prices were stronger than expected at 1.2% M/M and 3.0% Y/Y. The data don't help sterling. There are no other UK eco data today, but there might be quite some Brexit related noise. The UK election campaign continues and might yields some hard comments on the Brexit issue. The euro group discussing the starting position of the EU for the negotiations might also be quite tough. We don't expect a big negative reaction of sterling. However, this context probably won't help to change fortunes in favour of sterling.
Of late, the positive sterling sentiment faded and euro strength prevailed in EUR/GBP trading.. The pair bottomed out with 0.84/0.8330 as a solid bottom. The breach of 0.8509/31 (previous ST tops) improved the technical picture. For now, we stick to the EUR/GBP uptrend even as the euro rebound might slow shortterm. Longer term, Brexit remains potentially negative for sterling
EUR/GBP: euro strength dominates
EUR/CHF Daily Outlook
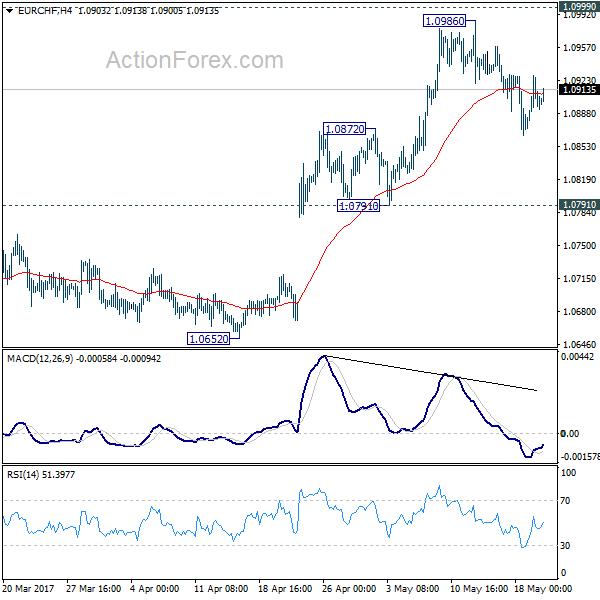
Daily Pivots: (S1) 1.0873; (P) 1.0901; (R1) 1.0927; More...
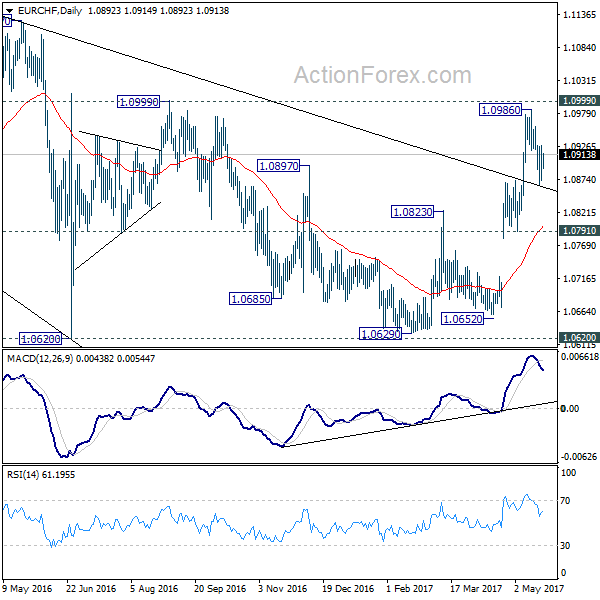
Intraday bias in EUR/CHF stays neutral as consolidation from 1.0986 is still in progress. In case of another fall, downside is expected to be contained by 1.0791/0872 support zone to bring rise resumption. As noted before, the consolidative pattern from 1.1198 should be completed. Firm break of 1.0999 resistance will pave the way for a retest on 1.1198 high.
In the bigger picture, the price actions from 1.1198 are seen as a corrective move. Current strong rebound is raising the chance that it's completed after defending 38.2% retracement of 0.9771 to 1.1198 at 1.0653. Decisive break of 1.0999 resistance will target a test on 1.1198 high. For now, this will be the preferred case as long as 1.0791 support holds.
Trade Idea: AUD/USD – Buy at 0.7390
AUD/USD – 0.7457
Recent wave: Wave 5 ended at 1.1081 and major correction has commenced for fall to 0.7000 and then towards 0.6500-10
Trend: Near term down
Original strategy :
Buy at 0.7370, Target: 0.7520, Stop: 0.7320
Position: -
Target: -
Stop: -
New strategy :
Buy at 0.7390, Target: 0.7540, Stop: 0.7330
Position: -
Target: -
Stop:-
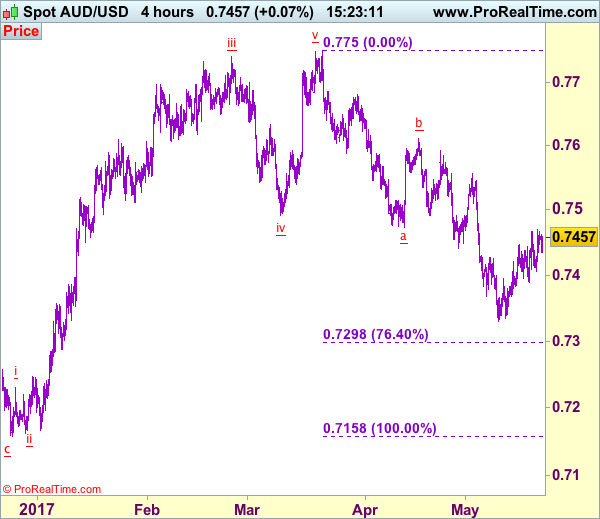
As aussie found good support at 0.76329 earlier this month and has staged a rebound, suggesting low has possibly been formed there and consolidation with upside bias is seen for gain to 0.7329 to 0.7500-10 but break there is needed to add credence to this view, bring subsequent rise towards resistance at 0.7556 which is likely to hold from here due to near term overbought condition.
In view of this, we are looking to buy aussie on dips as 0.7390 should limit downside. A break of said support at 0.7329 would abort and signal recent decline is still in progress for weakness to 0.7295-00 (76.4% retracement of 0.7158-0.7750), however, loss of downward momentum should prevent sharp fall below 0.7300 and reckon 0.7245-50 would remain intact, bring another rebound later.
On the 4-hour chart, the move from 0.8066 is the wave 5 with i: 0.8860, ii: 0.8315, wave iii is an extended move ended at 1.0183, iv: 0.9706 and wave v has ended at 1.1081 (also the top of entire wave 5). The subsequent selloff is the major correction which is unfolding as ABC-X-ABC and 2nd A leg has ended at 0.8848, followed by a-b-c wave B which ended at 0.9758, hence, 2nd C wave is now in progress and indicated downside target at 0.7000 and 0.6950 had been met, so further fall to 0.6710-20 cannot be ruled out.
Trade Idea : USD/CHF – Sell at 0.9850 or buy at 0.9700
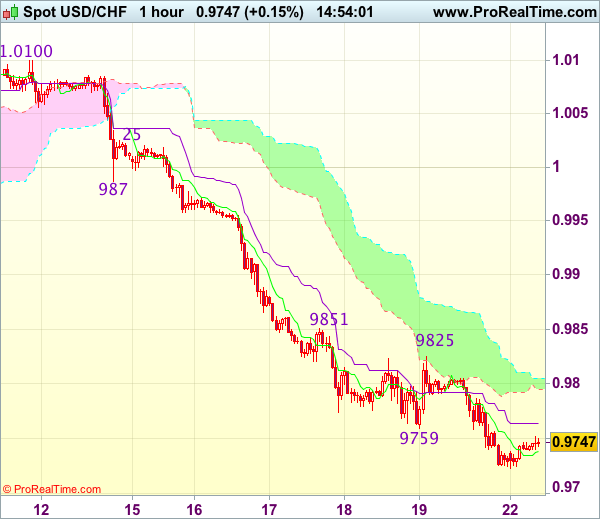
USD/CHF - 0.9755
Most recent candlesticks pattern : N/A
Trend : Near term down
Tenkan-Sen level : 0.9741
Kijun-Sen level : 0.9764
Ichimoku cloud top : 0.9805
Ichimoku cloud bottom : 0.9795
Original strategy :
Sell at 0.9850, Target: 0.9750, Stop: 0.9885
Position : -
Target : -
Stop : -
New strategy :
Sell at 0.9850, Target: 0.9725, Stop: 0.9885
O.C.O.
Buy at 0.9700, Target: 0.9800, Stop: 0.9665
Position : -
Target : -
Stop : -
Although dollar has recovered after finding support at 0.9723, reckon 0.9790-00 would limit upside and near term downside risk remains for recent selloff to extend one more decline to 0.9700, however, oversold condition should prevent sharp fall below there and bring rebound later, above 0.9800 would bring recovery to 0.9825 but renewed selling interest should emerge around previous resistance at 0.9851, bring another decline later.
In view of this, whilst we are still looking to sell dollar on recovery, we are inclined to buy dollar on next fall as 0.9700 should limit downside. Below 0.9670-75 would risk weakness to 0.9650 but still reckon downside would be limited to 0.9620-25 and bring another rebound later.
Dollar Looks To A New Week, OPEC Meeting In Focus
The US dollar index will be looking to a fresh week with the possibility of a rebound following last week's sharp declines. On Friday, the US dollar edged lower with no major economic events to report.
Oil prices were back in the limelight ahead of this week's OPEC meeting on Thursday, 25 May 2017. The OPEC leaders and Russia are widely expected to extend the production cut until March 2018. Oil prices closed at $50.33, rising 2% by Friday's close.
Looking ahead, economic data today is light which puts Fed members Harker and Kashkari's speeches in the limelight.
EURUSD intraday analysis
The US dollar index will be looking to a fresh week with the possibility of a rebound following last week's sharp declines. On Friday, the US dollar edged lower with no major economic events to report.
Oil prices were back in the limelight ahead of this week's OPEC meeting on Thursday, 25 May 2017. The OPEC leaders and Russia are widely expected to extend the production cut until March 2018. Oil prices closed at $50.33, rising 2% by Friday's close.
Looking ahead, economic data today is light which puts Fed members Harker and Kashkari's speeches in the limelight.
USDJPY intraday analysis
USDJPY (111.53): USDJPY has been pushing higher since the open today, although price action is clearly pointing to a bearish flag pattern as seen on the 4-hour chart.
Resistance is seen likely to form at 112.00 and only above this level can we expect to see some upside gains. To the downside, a break down from the bearish flag pattern is essential at 110.79 which will push the USDJPY lower towards the next immediate support at 109.50 and 109.00 levels.
XAUUSD intraday analysis
XAUUSD (1252.33): Gold prices continue to consolidate near the 1250 handle following last week's rally towards 1265 highs.
The rising wedge pattern on the daily chart remains in play which could potentially signal a move lower towards 1200.00 potentially. In the near term, gold prices remain range bound within 1263 and 1250 levels and a break down below one of these levels is needed to push gold prices further
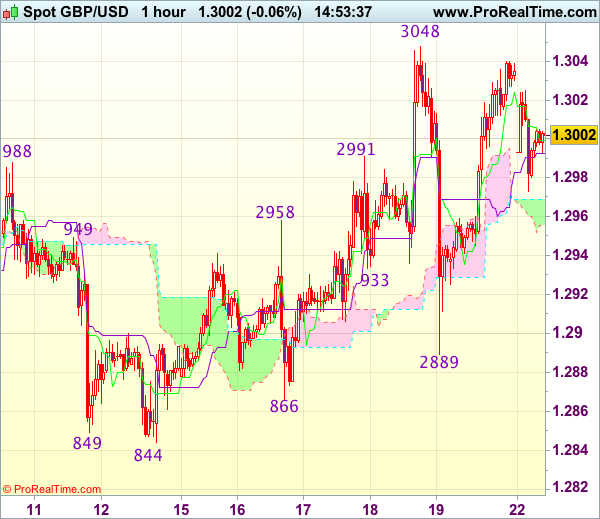
Trade Idea : GBP/USD – Stand aside
GBP/USD - 1.2995
Most recent candlesticks pattern : N/A
Trend : Near term up
Tenkan-Sen level : 1.2999
Kijun-Sen level : 1.2996
Ichimoku cloud top : 1.2969
Ichimoku cloud bottom : 1.2958
New strategy :
Stand aside
Position : -
Target : -
Stop : -
Despite staging a strong rebound from 1.2889 to 1.3040 on Friday, the subsequent retreat after faltering below last week’s high of 1.3048 suggest further choppy trading below this level would be seen and pullback to 1.2950-55 cannot be ruled out, however, reckon downside would be limited to 1.2920-25 and said support at 1.2889 should remain intact, bring another rebound later.
On the upside, expect recovery to be limited to 1.3020-25 and price should falter below said resistance at 1.3048, bring retreat later. Only a bream of said resistance at 1.3048 would confirm recent upmove has resumed an extend further gain to 1.3075-80 and possibly towards 1.3100-10 later. As near term outlook is mixed, would be prudent to stand aside in the meantime.