Sample Category Title
Canadian Consumer Prices And Core Retail Sales Miss Forecasts
'The fact that core (inflation) remains so muted is a fairly strong argument in favor of not following any lead by the Fed in the immediate future.' — Doug Porter, BMO Capital Markets
Canadian consumer prices rose less than expected last month, official figures showed on Friday. Statistics Canada reported that its CPI advanced 0.4% in April, following the preceding month's gain of 0.2% and falling behind expectations for an increase of 0.5%. Meanwhile, the so-called core inflation rate came in at 0.0% last month, compared to a 0.3% climb in March. On an annual basis, headline inflation rose 1.6%, unchanged from March's figure and missing forecasts for a 1.7% gain. Meanwhile, other measures of inflation, the Common CPI, the Median CPI and the Trimmed CPI came in at 1.3%, 1.6% and 1.3%, respectively, year-over-year in April. Prices were up in six out of the eight components, with gasoline prices posting the largest gain of 15.9% on an annual basis. Other data showed that retail sales climbed 0.7% in March, compared to the prior month's upwardly revised fall of 0.4% and surpassing expectations for a 0.4% increase. However, excluding volatile items, core retail sales fell 0.2%, whereas analysts anticipated a climb of 0.2% in the reported month after a 0.1% drop in February.
Forex Technical Analysis: EUR/USD, USD/JPY, GBP/USD
EUR/USD
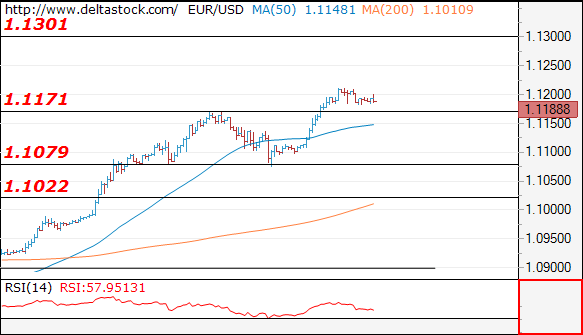
Current level - 1.1188
The uptrend is still intact, with an intraday support at 1.1170 and crucial level at 1.1080. Next major resistance lies at 1.1300.
| Resistance | Support | ||
| intraday | intraweek | intraday | intraweek |
| 1.1210 | 1.1300 | 1.1170 | 1.1022 |
| 1.1300 | 1.1300 | 1.1080 | 1.0838 |
USD/JPY
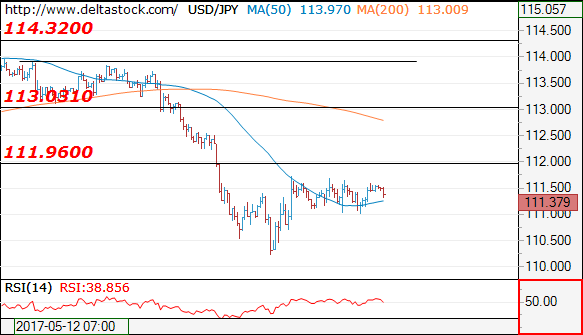
Current level - 111.23
The outlook here remains positive, for a break through 111.90, towards 113.00 area.
| Resistance | Support | ||
| intraday | intraweek | intraday | intraweek |
| 111.90 | 114.30 | 111.00 | 109.40 |
| 113.00 | 115.60 | 111.20 | 108.12 |
GBP/USD
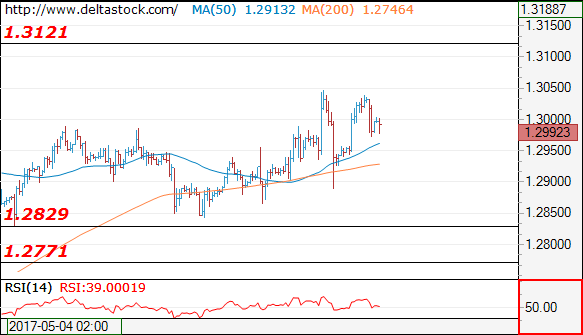
Current level - 1.2948
The intraday bias is neutral, as the pair is ready for another upswing, towards 1.3120 resistance. Crucial on the downside is 1.2830 low.
| Resistance | Support | ||
| intraday | intraweek | intraday | intraweek |
| 1.3050 | 1.3120 | 1.2900 | 1.2770 |
| 1.3120 | 1.3500 | 1.2830 | 1.2610 |
Conservative’s Approval Rating Drops Ahead Of General Election
The dollar index hit a new post presidential election low of 96.95 on Friday May 19th. EUR/USD hit a high of 1.1211 a level not seen since November 9th of last year. On Monday morning, during the European session, the dollar index experienced a moderate rebound, touching 97.29, as the market is aware of a strong support level at 97.00.
The UK general election will be held on June 8th – less than 3 weeks away. Per recent polls (conducted by Business Insider and GFK) 48% of Brits will vote for the Conservative Party, seeing an increase of 7% comparing to the previous polls, 28% will vote for the Labour Party, in line with the previous polls. Per polls conducted by the tabloid newspaper The Daily Mail on May 20th, the approval rating for the Conservative Party is 46% whereas with Labour it is 34%.
The Brexit negotiation is one of the focuses of the election, the Conservative Party has pledged a smooth and orderly Brexit. To attract Labour party voters the Conservatives changed their policies; focusing more on the needs of workers and middle classes, enhancing NHS' financial conditions (by reducing free services offered to wealthy elders) and controlling the number of immigrants into the UK.
These new policies are expected to help the Conservative Party to obtain 56 seats from other parties, especially from UKIP. Per recent polls, the Conservative Party is expected to win a landslide victory in the election. Polls forecast the Conservative Party will win 390 seats, out of the 650 seats in the Parliament, becoming the outright majority with a 130 seats lead.
On May 20th it was reported that Theresa May plans to cancel school free lunches as it is not necessary for those families which can afford it, taking government spending reallocation into consideration. The announcement caused a slide in approval rating for the Conservative Party. Per the latest polls conducted by YouGov, the difference of approval rating between the Conservative and the Labour now narrows to 9% (the approval rating for the Conservatives dropped to 44%, whereas with the Labour it increased to 35%). Regardless of this fall the Conservative Party is still expected to win the General Election.
GBP/USD hit a high of 1.3047, last seen September 29, breaking a significant resistance at 1.3000. On Monday morning, during the early European session, GBP/USD saw a retracement falling below 1.3000 as a result of the dollar rebound. GBP/USD has rallied 3.75% since Theresa May announced a snap general election. Consensus about GBP has turned to bullish from bearish with many shorts being closed out as Cable has rallied higher.
Technical Outlook: Recovery Stays Capped By 55SMA As Wed’s Long Red Candle Continues To Weigh
Recovery attempts from last Thursday's spike low at 110.22 remain capped by descending 55SMA (currently at 111.68) as overall structure remains weak and keep near-term focus at 110.00/109.80 targets (psychological support/rising 200SMA).
Long red candle that was left on Wednesday continues to weigh, together with daily cloud top at 111.80.
Another strong barrier lies at 112.29 (daily Tenkan-sen) where extended corrective upticks should be limited before bears resume.
Res: 111.68, 111.80, 112.29, 112.78
Sup: 111.13, 110.96, 110.50, 110.22
USD Bounces Back As US Political Risk Eases
GBP loses momentum amid political jitters
Sterling went under renewed pressure on Monday morning with Brexit negotiations expected to make a comeback this week. The pound was the worst G10 performer as it slid 0.50% against the greenback with GBP/USD easing as low as 1.2967.
Over the last few days, the pound has been testing the 1.3000-50 resistance area as investors anticipated a strong Tory majority at the upcoming general election. However, their confidence has been damaged recently over Prime Minister Theresa May's propositions to amend the social care system and revelations that its introduction was kept in the strictest confidence, putting into question the unity of the Conservative party.
Knowing that the GBP has been rallying strongly on anticipation of a stronger Tory majority following the elections, investors are naturally trimming their bullish bets on the pound. GBP/USD has returned below the 1.30 threshold and is heading towards the next support at around 1.29. We remain cautious on the GBP outlook, especially since the tone between the EU and UK has turned up as discussions surrounding the 'divorce bill'.
Focus back on US fundamentals
Markets have refocused on fundamentals yet are keeping one eye on the political risks. With US President Donald Trump - the lone source of market volatility - now traveling in the world's most unstable region, even the most bullish investor is skittish.
On Wednesday (23 May), the FOMC meeting minutes will be released. The primary takeaway is that most members view the slowdown in 1Q as transitory. Members should point to the weak inflation reads as one-off factors and indicate that the strong labour market, including an upwards trend in wages, will pressure prices. In regards to the path of normalisation, we suspect this will remain unchanged with two rate hikes in 2017. While expectations for a June hike sagged slightly after the recent US political noise, we still anticipate a 25bp hike in June (another in September). Fully pricing in of June should see mild USD demand.
Finally, the most critical question is around balance sheet reduction and the lack of consensus (objective & strategy) will sideline any update. We continue to expect the balance sheet reduction strategy to be released in September with a passive and simple strategy that will involve natural roll-off (over forced selling) reducing portfolio to $2.5 trillion.
The thin calendars of Fed speakers pre-blackout in the coming weeks suggests trade will only have economic data on which to adjust June expectations. Elsewhere President Trump has sent a letter to Congress that officially starts a 90-day countdown before the US, Mexico and Canada begin the negotiation process for NAFTA. We believe the end result will be pleasing to free-trading advocates. Yet clearly there will be noise and we would position ourselves to buy CAD and MXN on dips.
Eurozone: Le Maire and Schauble meet today in Berlin
Continuing the European construction is one of the key points of new French President Emmanuel Macron and we should see reforms in that direction.
Today the German and French Finance Ministers Wolfgang Schauble and Bruno Le Maire will meet in Berlin and we know that discussions will be mostly on harmonising corporate tax rates in Europe. This topic promises to be tough. Indeed we recall that a European reform to be accepted needs the approval of all the 28 members according to Article 48 of the Treaty on European Union.
In Ireland for example, their fiscal is very attractive and the country has clearly an unfair advantage regarding other countries so it is obvious that the country will never give up an advantage so easily. In Greece, would we imagine the country to lower their corporate rate which is one of the highest in Europe (29%) given we know the difficult situation they are in.
Technical Outlook: EURUSD – Bulls Look For Extension Above 1.1200 After Consolidation
The Euro is consolidating under fresh highs at 1.1211/08 (Friday/today) following very strong rally last week, when it was up 2.5%. The pair took out strong barriers at 1.1000 (psychological) and 1.1065 (weekly cloud top) that generated strong bullish signals.
Cracked 1.1200 level is currently acting as solid barrier, with extended easing on overbought slow stochastic not ruled out.
Initial support at 1.1166 (Fibo 38.2% of Friday's rally) is holding for now, with possible extension towards 1.1140 (Fibo 61.8% and 1.1100 (Friday's low) seen before fresh attempts higher.
The Euro is currently running on extended third wave of five-wave cycle from 1.0819 which eyes its 200% Fibonacci expansion at 1.1245 and may travel towards 1.1323 (FE 238.2% which lies near Fibo 76.4% of 1.1614/1.0339 descend).
Only return below weekly cloud top would sideline bulls for deeper correction.
Res: 1.1211, 1.1245, 1.1300, 1.1323
Sup: 1.1166, 1.1140, 1.1100, 1.1065
An Explosive Data-Packed Week Lies Ahead
Asian equities roared back to life during early trading on Monday after oil's sharp appreciation boosted global sentiment and rekindled risk appetite. European shares were mostly mixed as investors attempted to look beyond the political turmoil in Washington to focus on the macro-fundamentals in Europe. With concerns regarding Donald Trump's presidency slightly easing and some still optimistic for his pro-growth policies, Wall Street is likely to receive some minor support this afternoon.
Dollar bears remain relentless
The Greenback was 'Trumped' last week with prices struggling to recover from six-month lows as investors re-evaluated the ramifications of the political instability in Washington and the impact it will have on Trump's pro-growth policies. With the Dollar-Inspired Trump rally relinquishing all gains amid the growing uncertainty, bears are truly back in town. Much attention will be directed towards former FBI director James Comey's pending public testimony, which should expose the Dollar to further downside shocks if any new information is brought to the table. On the macro front, the Federal Reserve minutes and US GDP will steal the limelight with investors heavily scrutinizing both for further clues on rate hike timings this year.
GBPUSD breaks above 1.3000
Sterling bulls have effortlessly exploited the Dollar's weakness to elevate the GBPUSD above the stubborn 1.3000 resistance. With UK politics and Theresa May back in focus this week, the upside is likely to remain limited with Sterling instore for some fresh punishment.
There is still a strong sense of uncertainty over the pending Brexit negotiations, while suspicions of the European Union playing hardball in the talks should expose Sterling to further losses. With the pending second estimate GDP for the first quarter of 2017 likely to be unrevised, the main event risk for Sterling this week should be the inflation report hearings on Tuesday where BoE Mark Carney testifies on inflation and the economic outlook before the Parliamentary Committee.
OPEC meeting in focus
Oil prices have ventured higher on Monday as optimism continues to sharply rise over big oil-producing countries extending output cuts to balance the markets. Although markets widely expect a meeting between OPEC and Non-OPEC members on May 25 to conclude with the current output deal extended by another 9 months, it remains a question of how U.S Shale reacts. The price action observed in oil markets suggests that prices remain entangled in a fierce bout with OPEC bulls and U.S Shale bears. While prices could edge higher following the extension of the production cut deal, the upside should face headwinds if U.S Shale continues to pump oil incessantly into the already oversaturated markets.
Commodity spotlight – Gold
The Trump woes have turbocharged Gold bulls this month with the yellow metal trading around $1254 as of writing. With political unrest in Washington hastening the flight to safety, investors sprinted to Gold as a form of protection. The yellow metal is in the process of turning bullish on the daily charts and a vulnerable Dollar should inspire bulls to conquer $1260. From a technical standpoint, a breakout above $1260 may open a path higher towards $1275.
Technical Outlook: GBPUSD – Weekly Cloud/Politics Continues To Weigh After Break Above 1.30
Cable stands at the back foot in early European trading after opening lower on Monday, as polls showed UK PM May's lead reduced. The pair returned below 1.3000 level which was taken out last week. Spike above 1.3000 on Thursday and eventual close above it on Friday, generated bullish signal, as cable was up 1.2% for the week. Bullish technical studies and strong bullish sentiment are seen as supportive factors for further advance. On the other side, the rally is facing strong headwinds from descending weekly cloud base, which continues to limit attempts above 1.30(cloud base currently lies at 1.3016). Politics may also weigh on pair's near-term action. The pair is so far holding within 1.2964/1.3022 range and still away from strong supports at 1.2934/19, provided by converging 10 and 20 SMA's. Break here would weaken near-term structure and risk further easing. Key near supports lay at 1.2843/30.
Res: 1.3000, 1.3022, 1.3046, 1.3100
Sup: 1.2964, 1.2934, 1.2919, 1.2889
GBP/JPY Daily Outlook
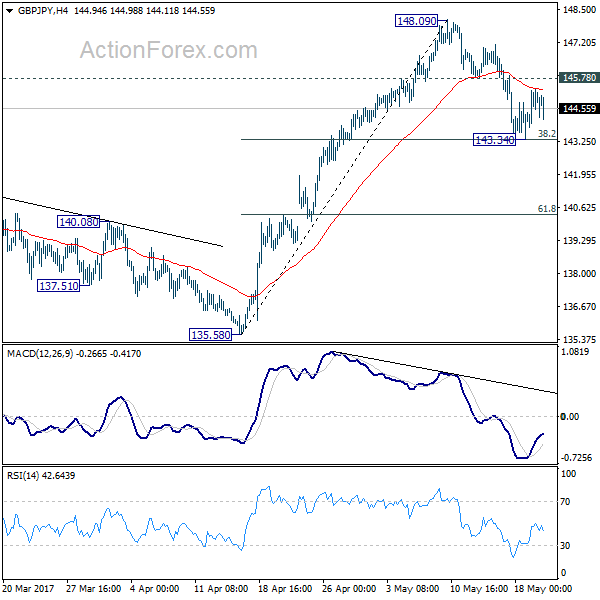
Daily Pivots: (S1) 144.06; (P) 144.72; (R1) 145.62; More....
Intraday bias in GBP/JPY remains neutral for the moment. The corrective pattern from 148.09 short term top could extend. On the upside, above 145.78 will turn bias back to the upside for retesting 148.09 first. Meanwhile, break of 143.34 will extend the pull back from 148.09 to 61.8% retracement at 140.35. Overall, we'd still expect the rise from 122.36 to resume after pull back from 148.09 completes. Break of 148.09 will target 150.42 long term fibonacci level first.
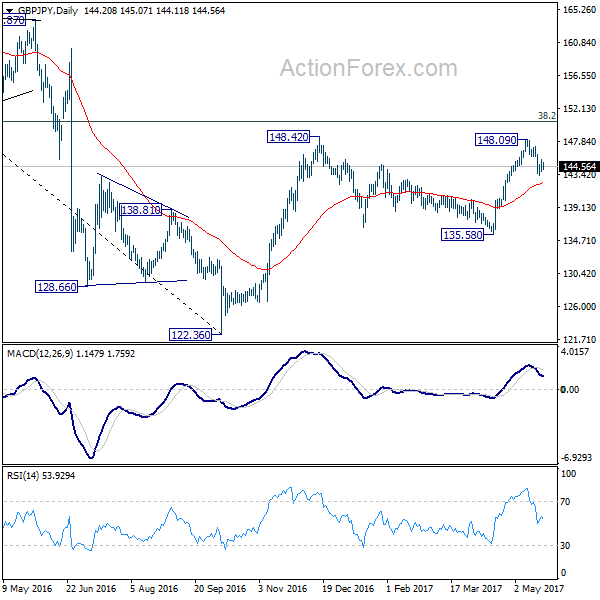
In the bigger picture, based on current momentum, rise from 122.36 bottom should be developing into a medium term move. Break of 38.2% retracement of 195.86 to 122.36 at 150.42 should pave the way to 61.8% retracement at 167.78. This will now be the favored case as long as 135.58 support holds.
EUR/JPY Daily Outlook
Daily Pivots: (S1) 123.72; (P) 124.32; (R1) 125.27; More...
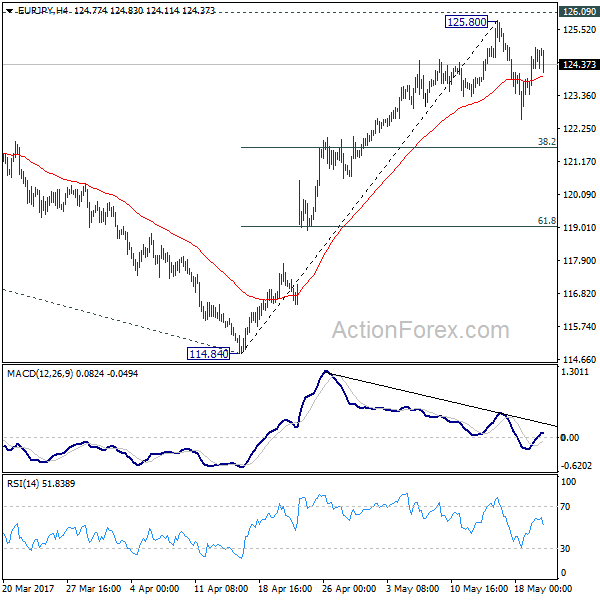
Intraday bias in EUR/JPY remains neutral as the consolidation from 125.80 short term top continues. More consolidative trading would be seen and another fall cannot be ruled out. But downside should be contained by 38.2% retracement of 114.84 to 125.80 at 121.61 to bring rise resumption. We're staying mildly bullish in the cross. And, break of 126.09 key resistance will extend the whole rebound from 109.03 to 100% projection of 109.03 to 124.08 from 114.84 at 129.89.
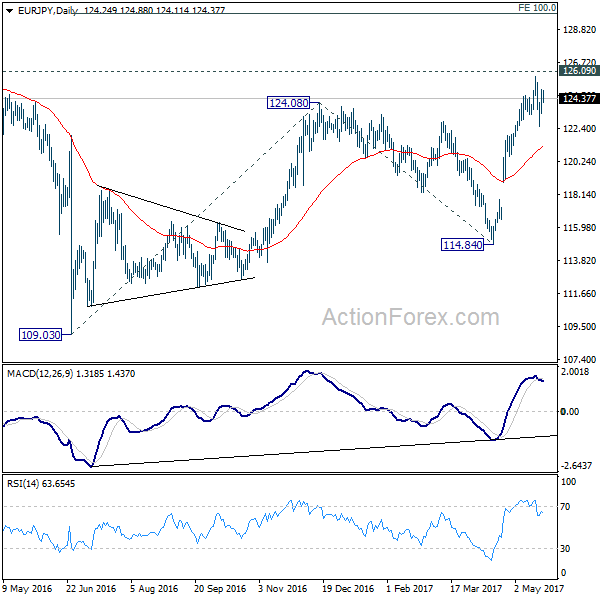
In the bigger picture, focus is back on 126.09 support turned resistance. Decisive break there will confirm completion of the down trend from 149.76. And in such case, rise from 109.20 is at the same degree and should target 141.04 resistance and above. Meanwhile, rejection from 126.09 and break of 114.84 will extend the fall from 149.76 through 109.20 low.