Sample Category Title
Fed Speeches and Trump’s Global Tour in Focus
- GBP weighed down as May's poll lead is cut in half;
- GBPUSD pares Friday's gains but EURGBP looks more bullish;
- Donald Trump's global tour in focus on an otherwise quiet day.
It's been a relatively uneventful start to the week, with equity markets in Europe trading a little mixed while those in the US are expected to open flat. The FTSE is clearly the outperformer in the European session so far buoyed by both the weaker pound sterling and the gains in commodity markets.
The pound is coming under some pressure this morning, weighed down by comments from Brexit Secretary David Davis and polls over the weekend that showed the Conservatives lead over Labour has been slashed. Davis' claim that the UK will quit talks with the EU if the reported Brexit bill isn't revised lower appears to be putting some pressure on the currency. While the pound remains vulnerable to suggestions that talks could break down, I think this is just another case of people involved preparing for tough negotiations and threatening things they ultimately will try to avoid at all costs.
The polls released over the weekend may also be contributing to moves in the pound this morning, with the Conservatives lead over Labour having halved in some cases. A large majority for the Conservatives is viewed as beneficial by some when it comes to the Brexit negotiations as it gives them a strong mandate while enabling them to take a softer approach when necessary without having to rely on the support of some of the bigger eurosceptics in the party.
It is worth considering though that while sterling is among the worst performing currencies today, the loss against the dollar only equates to around half of the gains made on Friday. The reality may well be that the apparent negative news is aiding a small correction that was on the cards regardless. That said, it is suffering a little more against the euro, with today's moves having taken the pair through an interesting technical level that may signal further downside for the pound.
The first trading day of the week is looking a little quiet in terms of economic data or events. US President Donald Trump's global tour will be of interest to traders although we do appear to be seeing a more reserved version of himself so far, which will come as a relief to many. The political storm at home is unlikely to go away but it may take a bit more of a backseat this week. We will hear from two voting members of the FOMC today, with Neel Kashkari and Patrick Harker both scheduled to make appearances.
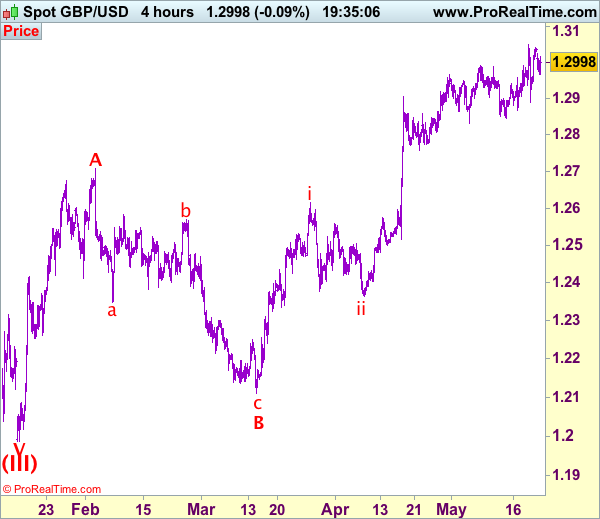
Trade Idea: GBP/USD – Stand aside
GBP/USD – 1.3006
Recent wave: Wave V of larger degree wave (III) has ended at 1.1986 and major correction has commenced from there for gain to 1.3000 and 1.3140-50
Trend: Near term up
New strategy :
Stand aside
Position: -
Target: -
Stop:-
Although cable rose to as high as 1.3040 late last week, as sterling has retreated again after faltering below previous resistance at 1.3048, suggesting further consolidation would be seen and pullback to 1.2960 cannot be ruled out, however, reckon downside would be limited to 1.2920-25 and bring another rise later. A break of said resistance at 1.3048 would confirm upmove has resumed and extend further rise to 1.3075-80, then 1.3100-10 but near term overbought condition should limit upside to 1.3050-60 and price should falter well below 1.3100-10.
Our preferred count on the daily chart is that cable's rebound from 1.3500 (wave (A) trough) is unfolding as a wave (B) with A ended at 1.7043, followed by triangle wave B and wave C as well as wave (B) has ended at 1.7192, the subsequent selloff is the larger degree wave (C) which is still unfolding with minor wave (III) of larger degree wave 3 ended at 1.1986, hence wave (IV) correction is in progress which could either be a triangle wave (IV) of a complex formation but upside should be limited to 1.3500 and price should falter well below 1.4000, bring another decline in wave (V) of 3 for weakness to 1.1500, then 1.1200.
On the downside, whilst pullback to 1.2960 is likely, reckon 1.2920-25 would limit downside and bring further consolidation. Only below said support at 1.2889 would signal top has been formed at 1.3048 and bring retracement of recent upmove to 1.2866, then towards previous support at 1.2844 which is likely to hold from here.
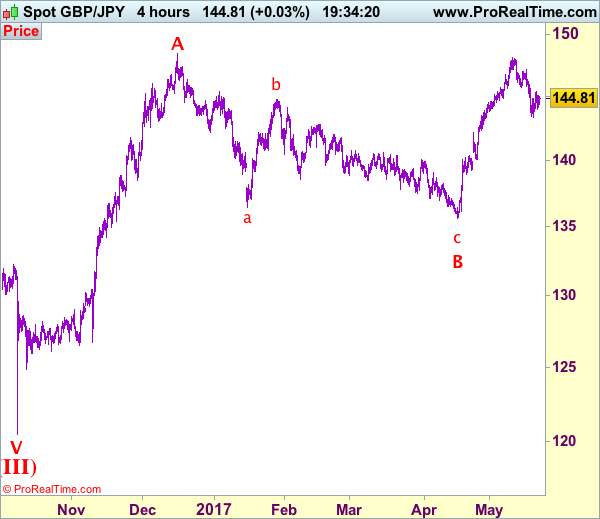
Trade Idea: GBP/JPY – Stand aside
GBP/JPY - 144.90
Recent wave: Medium term low formed at 120.50 and (A)-(B)-(C) major correction has commenced with (A) leg ended at 148.45, hence wave (B) is unfolding for retreat to 131.00-10.
Trend: Near term up
New strategy :
Stand aside
Position: -
Target: -
Stop:-
Although sterling found support at 144.00 and has rebounded again, retaining our view that further consolidation above last week’s low at 143.40 would be seen and gain to 145.40-45 cannot be ruled out, however, break of resistance at 145.90-95 is needed to signal low is formed there, bring a stronger rebound to 146.30-35 but resistance at 147.10 should remain intact, bring retreat later.
In view of this, would be prudent to stand aside for now. Below 144.00 would bring test of 143.80-85 but break there is needed to signal the rebound from 143.40 has ended, bring another test of this level, break there would extend the corrective decline from 148.10 top for retracement of recent upmove to 143.00, then towards 142.50-60.
Our preferred count is that larger degree wave V with circle is unfolding from 251.12 with wave (I) 219.34, (II): 241.38 and wave (III) is subdivided into 1: 192.60, 2: 215.89 (23 Jul 2008) and wave 3 ended at 118.87 earlier in 2009. The correction from there to 162.60 is wave 4 which itself is a double three and is labeled as first a-b-c ended at 151.53, followed by wave x at 139.03, 2nd a ended at 162.60, 2nd b at 146.75 and 2nd c leg of wave 4 ended at 163.00. Therefore, the decline from 163.00 to 116.85 is now treated as wave 5 which also marked the end of larger degree wave (III), hence wave (IV) major correction has commenced for retracement of the wave (III) from 241.38 and upside target at 183.95-00 (50% Fibonacci retracement of the wave (II) from 241.38) had been met, a drop below 160.00 would suggest wave (IV) has ended at 195.85, bring decline in wave (V) for initial weakness to 130 (already met) and 120.
Technical Outlook: Spot Gold Back Above Daily Cloud, Reduces Risk Return To Key $1245 Support
Spot Gold is holding positive near-term tone on Monday and is back above daily cloud (cloud top lies at $1254 and is reinforced by daily Kijun-sen and 50% of $1295/$1214), extending strong recovery rally from Friday. While the price is holding above the cloud, fresh upside attempts could be expected. Bullishly aligned daily studies support the notion. However, negative signal is coming from reversal of slow stochastic from overbought zone and the price may ease back into cloud. Session low at $1251 offers initial support, guarding very strong support and lower breakpoint at $1245 (converged 200/55SMA's/daily cloud base/Fibo 38.2% of $1295/$1214). Extended dips should be contained here to avoid bearish scenario expected on break below $1245 pivot.
Res: 1257, 1261, 1265, 1270
Sup: 1254, 1251, 1245, 1241
EUR/USD Elliott Wave Analysis
EUR/USD – 1.1241
EUR/USD: Wave (c) of 2 ended at 1.3993 and wave 3 of III has commenced for weakness to 1.0411 (1.236 of wave 1), then 1.0000.
As euro’s upmove has gathered momentum after breaking recent high at 1.1025, adding credence to our bullish view that the erratic upmove from 1.0340 low is still in progress and test of previous resistance at 1.1300 is likely, however, a daily close above there is needed to retain bullishness and signal medium term downtrend has resumed and extend gain to another previous resistance at 1.1366 but near term overbought condition should prevent sharp move beyond 1.1430-35 and price should falter below 1.1500, bring retreat later.
Our preferred count on the daily chart remains that a wave (II) from 1.2329 ended at 1.5145 with A-leg ended at 1.4720, followed by wave B at 1.2457, the wave C from there was also a 3 legged move and is labeled as (a): 1.3739, (b): 1.2885, the wave iii of the 5-waver (c) from 1.2885 has ended at 1.4339 and wave iv is a triangle ended at 1.3878 and wave v formed a top at 1.5145. The decline from there is a 5-waver (C) with minor wave (i) of I of (C) ended at 1.4218 with wave (ii) ended at 1.4580, wave (iii) ended at 1.3267 and wave (iv) ended at 1.3692 and wave (v) ended at 1.1876, this is also the low of wave I of (C) and wave II ended at 1.4940, hence wave III is now in progress with a diagonal wave 1 ended at 1.2042, the breach of previous support at 1.1876 (wave I trough) adds credence to our view that the wave 2 has ended at 1.3993, wave 3 has commenced for further weakness to 1.0411, then towards 1.0000.
On the downside, although initial pullback to 1.1190-00 cannot be ruled out, reckon 1.1100 would limit downside and bring another rise to aforesaid upside targets. Only below said previous resistance at 1.1025 would abort and suggest a temporary top is formed instead, bring correction to 1.0975-80 but downside should be limited to 1.0900 and support at 1.0839 should remain intact, bring rebound later.
Recommendation: Buy at 1.0780 for 1.0980 with stop below 1.0680.
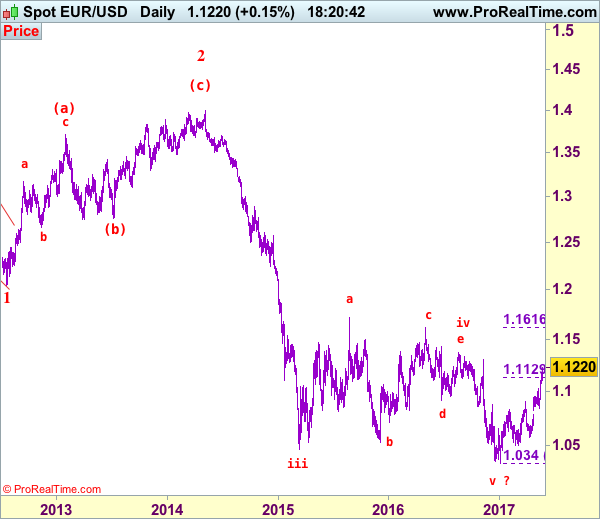
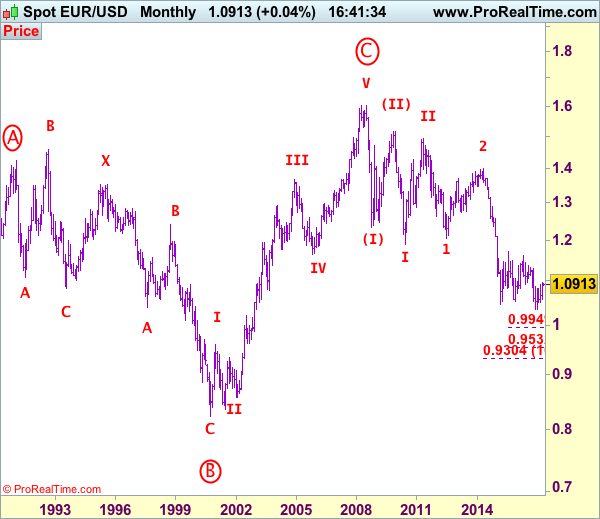
Euro's long-term uptrend started from 0.8228 (26 Oct 2000) with an impulsive structure. The rise from 0.8228 to 0.9593 (5 Jan 2001) is labeled as wave I, the retreat to 0.8352 (6 Jul 2001) is wave II and the rally to 1.3670 (31 Dec 2004) is wave III. Wave IV from there ended at 1.1640 (15 Nov 2005), the subsequent upmove to 1.6040 (July 15, 2008) is treated as wave V, the major selloff from the record high of 1.6040 to 1.2329 (October 27, 2008) signals a reversal has taken place with (I) leg ended at 1.2329 and once (II) ended at 1.5145, wave (III) itself is an extended move with I: 1.1876 and complex wave II ended at 1.4902, wave III has commenced with wave 1 and 2 ended at 1.2042 and 1.3993 respectively, wave 3 of III is now unfolding for weakness towards parity.
Technical Outlook: US Oil Is Stabilizing Around $51.00, Expected Production Cut Extension Strongly Underpins, Focus On OPEC May 25...
US oil is maintaining strong bullish tone on Monday and holds above $51.00 handle, following strong rally on Friday when oil price was up 3.1% and broke above psychological $50.00 level, hitting one-month highs.
Monday's action is so far holding in a tight range, consolidating strong rally on Friday and cracked barrier at $51.13 (100SMA).
Daily studies are turning into full bullish setup and favor further upside. Strong bullish sentiment on increased expectations for extension of production cut on OPEC meeting on 25 May is underpinning the action.
The price may extend towards $53.74 (12 Apr high) to fully retrace $53.74/$43.74 downleg.
Slow Stochastic is strongly overbought on daily chart but continues to move north, delaying to generate bearish signal. However, corrective action should be anticipated in the near-term, with broken $50.00 level now acting as strong support, together with broken 200SMA ($49.53) expected to contain dips.
Res: 51.22, 51.38, 52.00, 52.62
Sup: 50.90, 50.00, 49.53, 49.29
EUR/USD – Euro Steady As Trump Concerns Ease
The euro has inched lower on Monday, following sharp gains in the Friday session. Currently, EUR/USD is trading at 1.1180. It's very quiet on the economic front, as there are no economic reports out of the eurozone or the US. In the US, we'll hear from four FOMC members, and the markets will be looking for clues as to the Fed's plans with regard to future rate hikes. On Tuesday, Germany and the eurozone will release Manufacturing PMI reports, as well as German Ifo Business Climate. In the US, the key release is New Home Sales.
There are no economic events in the US on Monday, so the markets will have a chance to focus on the Federal Reserve, with four FOMC members delivering speeches. The Fed has been keeping the markets on their toes in recent weeks regarding a rate hike. The central bank is expected to announce a rate hike at its June 14 meeting, but the odds of a hike have shown strong volatility. In late April, a rate hike was priced in at just 50%. The odds jumped higher in May but continue to show movement. Currently, the markets have priced in a hike at 78%, up from 73% on Friday. If the likelihood of a June move continue to fluctuate, the US dollar could also show some movement, as a rate hike will make US-dollar assets more attractive to investors.
The euro sparkled last week, as EUR/USD jumped 2.7 percent. On Friday, the euro gained one percent and punched past the 1.12 line for the first time since November. The US dollar was broadly lower, as President Trump endured one of his most difficult weeks since taking office. Trump's administration was rocked by reports that he had asked former FBI director James Comey to end an investigation into connections between Russia and the Trump campaign team during the US election. If these accusations are true, Trump could be charged with committing obstruction of justice. President Trump fired back on Thursday, angrily denouncing this move as a 'witch hunt'. The media and the Democrats have had a field day with Trump's woes, and many Republicans are expressing unease with an administration that appears rudderless and is staggering from crisis to crisis. The ongoing turmoil in Washington has soured investors on the US dollar, and the euro has taken full advantage. However, with Trump out of the US on an official tour to the Middle East and Europe, the political tensions in Washington have receded, at least for now
USD/JPY Elliott Wave Analysis
USD/JPY - 111.45
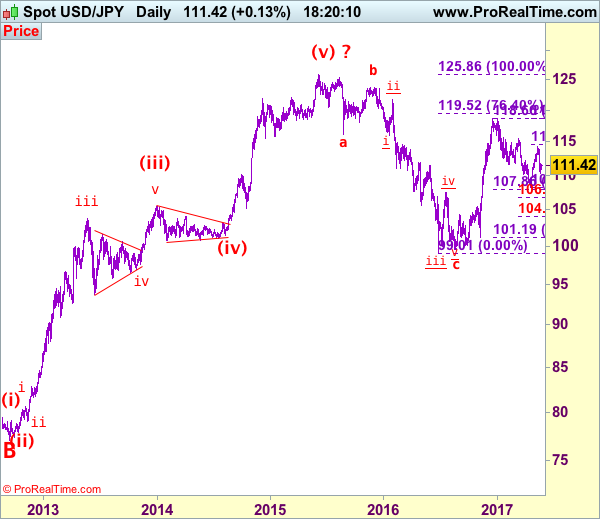
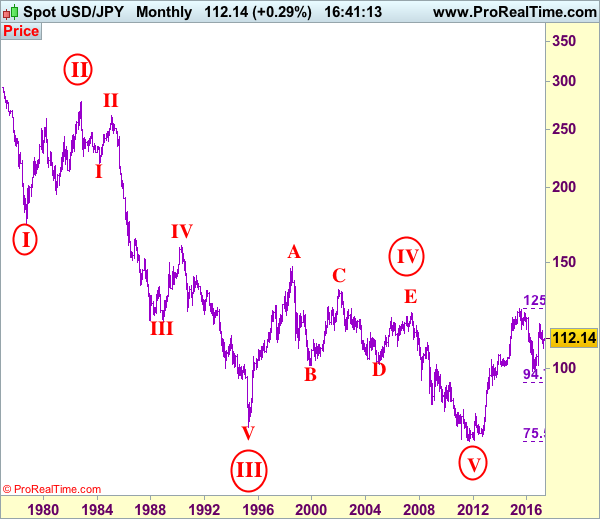
USD/JPY – Wave V of larger degree circle V has possibly ended at 75.31 and major correction has commenced and already met indicated target at 125.00.
As dollar’s retreat from 114.37 turned out to be much stronger than expected, suggesting the rebound from 108.13 has ended there and downside risk is seen for weakness to 110.00-10, however, outlook remains consolidative, reckon downside would be limited to 109.59 and bring recovery later. In the event dollar closes below 109.00 on a daily basis, this would provide confirmation and bring retest of 108.13 eventually.
Our preferred count is that, triangle wave IV (with circle) ended at 101.45 and the circle wave V brought dollar down to the record low of 75.31 in 2011 and the subsequent rebound signal major correction has commenced with A leg ended at 84.19, followed by wave B at 77.14 and impulsive wave C is now unfolding (indicated upside target at 125.00 had been met) for gain towards 127.00 level. In the event dollar drops below support at 99.01, this would confirm medium term decline from 125.86 top (2015 high) has resumed for subsequent weakness to 98.00 and possibly 97.00.
Under this count, this wave C is unfolding as impulsive waves with (1) (2), 1 2 ended at 80.67, 79.07, 82.84 and 81.69 respectively, hence the extended wave 3 has ended at 103.74 and wave 4 correction of recent upmove should bring weakness to 92.57, then towards 90.88 but psychological support at 90.00 should limit downside and bring another rally later in wave 5, indicated target at 125.00 had been met and gain to 127.00 cannot be ruled out but reckon price would falter below 130.00.
On the upside, whilst initial recovery to 112.00 cannot be ruled out, reckon 112.60-65 would limit upside and price should falter below 113.00 and bring another decline later. Above 113.85 would suggest the retreat from 114.37 has ended and bring another rise to this level, however, break of this resistance at 114.37 would extend the rise from 108.13 low to 114.60-65 (61.8% Fibonacci retracement of 118.66-108.13). Having said that, a daily close above there is needed to retain bullishness and suggest the entire fall from 118.66 has ended at 108.13, then further gain to 115.00 and later test of key resistance at 115.51 would follow.
Recommendation: Buy at 112.10 for 114.10 with stop below 111.10.
On the monthly chart, we have changed our preferred count that an impulsive wave is unfolding with major wave III with circle ended at 79.75, then followed by wave IV with circle and is labeled as a triangle with A: 147.64 (11 August, 1998), B: 101.25, C: 135.20, D: 101.67 and E leg ended at 124.14 to end the wave IV with circle. Hence, wave V with circle commenced from there and hit a record low of 75.31, however, the subsequent strong rebound signals this circle wave V has possibly ended there, hence gain to (indicated upside target at 122.00 and 125.00 had been met), the retreat from 125.86 suggests wave A of major correction has ended there and wave B correction back to 99.00, then 95.00 would be seen, however, reckon downside would be limited to 90.00, bring another rebound in wave C next year.
Market Update – European Session: Eurogroup Meets To Try To Again Finalize The Greek Bailout Review, UK Tories See...
Notes/Observations
Eurogroup meets and again tries to finalize the 2nd Greek bailout review
Recent polls predicting a narrower-than-expected win for PM May in June election (items in recent party manifesto cited)
Socialist Party re-elects Sanchez as its leader(opposition), seen as a thorn in PM Rajoy's policies
Bi-annual OPEC meeting on Thursday with production cut agreement likely to be extended
Overnight/weekend:
Asia:
North Korea leader Kim Jong Un said to have supervised a test firing of a ballistic missile
Japan chief cabinet Seg Suga: Strongly protest North Korea missile launch as intolerable and a clear violation of UN Resolution
US Sec of State Tillerson: Will continue to apply both economic and diplomatic pressure to North Korea after ballistic missile launch
Europe:
ECB's Weidmann (Germany): ECB will need to show backbone and not back off when inflationary pressures rise in Euro Zone. Reiterated Council view that expansionary policy remains justified for now
German Finance Ministry Monthly Report: Domestic economic upswing to continue after 'strong' Q1, but with less momentum. Maintained 2017 GDP growth forecast of 1.5% and 1.6% for 2018.
Germany's Foreign Minister Gabriel said to favor debt relief for Greece. Country has been promised debt relief over and over again if reforms are carried out; we must stand by this promise and not fail due to resistance from Germany
EU's Moscovici: Very close to an overall agreement for Greece
UK Brexit Min Davis: "No deal" with EU threat is genuine, Britain is prepared to see it through; still thinks an agreement is most likely outcome
UK May Rightmove House Prices M/M: 1.2% v 1.1% prior; Y/Y: 3.0% v 2.0%e
Recent polls on upcoming UK electiosn (to be held Jun 8th); Labour making up some ground following release of Conservative Party election manifesto
Americas:
President Trump's budget said to cut entitlements by $1.7T. Report notes the budget proposal won't reform Social Security or Medicare (in line with his campaign promise) but it will make large cuts to other entitlement programs.
US to sign $110B of military contracts as part of memorandum of intent to support Saudi defense
Council of Brazil's Order of Lawyers (OAB) voted favor of an impeachment hearing for President Temer
Energy:
Saudi Oil Min Al-Falih indicated OPEC and non-OPEC producers are on course to back an agreement extending the oil supply deal by a further nine months
Iran President Hassan Rouhani wins second term with 57% of the vote. (Note: Hard-liner Ebrahim Raisi, won 38% of the vote)
Economic Data
(TW) Taiwan Apr Export Orders Y/Y: 7.4% v 13.0%e
Fixed Income Issuance:
(NO) Norway sold NOK4.0B vs. NOK4.0B indicated in 6-month Bills; Avg Yield: 0.40% v 0.47% prior; Bid-to-cover: 3.01x v 3.55x prior
(SE) Sweden sold SEK5B in 2028 Bonds; Avg Yield: 0.7412% v 0.7511% prior; Bid-to-cover: 2.69x v 3.41x prior
SPEAKERS/FIXED INCOME/FX/COMMODITIES/ERRATUM
Equities
Indices [EuroStoxx50 flat at 3586, FTSE +0.4% at 7502, DAX +0.2% at 12657, CAC-40 +0.3% at 5338, IBEX-35 -0.3% at 10806, FTSE MIB -0.9% at 21381, SMI +0.4% at 10807, S&P 500 Futures +0.1%] Market Focal Points/Key Themes European indices trade mixed this morning with out performance in the UK FTSE, and weakness in the Italian FTSE MIB. The announced all stock merger of Clariant and Hunstman was the main headline this morning with shares of Clariant up over 9%. Else where the naming of Jan Jenisch as new CEO for LarfargeHolcim helped the stock rise over 6%. Shares of UCB are under pressure as the expected action date for EVENITY was delayed beyond M2017. Looking ahead to the US morning notable earnings include Booz Hamilton, Cheetah Mobile and Navios Maritime. Also on the look out for the formal confirmation of a CEO change at Ford.
Equities
Materials: [Clariant [CLN.CH] +9% (All stock merger with Huntsman), LafargeHolcim [LHN.CH] +6.2% (New CEO),
Financials: [Julius Baer [BAER.CH] +0.5% (AUM), Aegon [AGN] +7.4% (Divestment of some US businesses)
Technology: [Tele Columbus [TC1.DE] +2.2% (Earnings)]
Healthcare: [ Evotec [EVT.DE] +2.3% (Milestone payment from collaboration with Bayer), UCB [UCB.BE] -14% (Sees Osteoporosis Drug Delay on Heart Safety Concern)
Energy: [RWE [RWE.DE] +2.1% (Analyst upgrade), Petro Welt Tech [O2C.DE] -3.5% (Earnings)]
Speakers
Italy Stats Agency (ISTAT) 2017 Economic Forecasts: Raises 2017 GDP growth from 0.9% to 1.0% (as speculated)
Germany Finance Ministry: No completion of second Greece review and no clearance for next loan installment expected at this Eurogroup meeting in Brussels. Have three debt-relief scenarios on the table based upon Greek primary surplus and would be discussed by Eurogroup
France Fin Min Le Maire: France will respect deficit reduction commitments. Working group to present concrete ideas for developing Euro Zone; will look at investment projects
Austria Fin Min Schelling: Meeting on EU Financial Transaction tax (FTT) postponed until Jun 15th Eurogroup meeting. Cited that France's new finance minister asked for more time to review the issue because he just took office
Russia Econ Min Oreshkin: Could adjust macro economic forecasts in June if oil producing countries reach agreement on production cuts
Romania Central Bank Gov Isarescu stated that monetary and fiscal policies needed to be accommodative but urged prudence on policies. Fiscal stimulus would gradually decline
Iraq State Organization for Marketing of Oil (SOMO) chief Al-Amri: Iraq has made its OPEC production cut commitment and has announced its readiness to the OPEC cut agreement
Currencies
USD began the week inching higher following recent spat of softer economic data and political woes that sent it testing 6-month lows. Dealers noted that FOMC minutes would likely be the main event this week since they are expected to contain an extensive discussion of the Fed's balance sheet strategy
EUR/USD lower by 0.3% in quiet trading. Dealers noted that encouraging Euro Zone economic activity, the prospect of the ECB announcing a path to more tapering of its asset purchase program at the June ECB meeting, and improving capital inflows would continue to underpin the EUR currency
GBP/USD was lower after a spat of recent polls predicted a narrower-than-expected win for PM May in June election. Some of the items in the recent Tory platform manifesto cited for the narrowing of the gap. GBP/USD lower by almost 0.5% arounf 1.2975 area
Fixed Income
Bund futurestrade at 161.12 down 23 ticks, in the middle of last week's trading range. Resistance lies near the April 27th high of 162.01 level followed by 163.68. A break of 160.01 support level could see lows target 159.01 followed by 157.50.
Gilt futurestrade at 128.33 higher by 14 ticks, as strong demand for gilts suggest the UK can borrow more. Last week's rally respected both the 129.00 handle and the 129.14 April 18th high. Price still finds key support at the 127.52 support level. An acceleration lower could test the 126.74 region. Resistance stands at 128.51 then 129.14 followed by 132.80.
Monday's liquidity report showed Friday's excess liquidity dropped lower to €1.6380T a decline of €8B from €1.6460T prior. Use of the marginal lending facility rose to €216M from €137M prior.
Corporate issuancesaw $37.05B issued last week, ahead of last week's forecast of $30B. For the week ahead, analysts eye issuance to come in around $35B. - In Euro denominated issuance €53.7B came to market last week via 41 issuers and 53 tranches.
Looking Ahead
(PT) Portugal Mar Current Account: No est v €0.0B prior - 06:00 (IL) Israel to sell 2019, 2020, 2021, 2027 and 2047 bonds
06:00 (RO) Romania to sell1.35% 2019 Bonds
06:00 (IL) Israel Apr Unemployment Rate: No est v 4.2% prior
06:00 (IE) Ireland Apr PPI M/M: No est v 0.0% prior; Y/Y: No est v 2.1% prior
06:45 (US) Daily Libor Fixing - 07:00 (IN) India announces details of upcoming bond sale (held on Fridays)
07:25 (BR) Brazil Central Bank Weekly Economists Survey - 08:15 (UK) Baltic Dry Bulk Index
08:30 (US) Apr Chicago Fed National Activity Index: 0.10e v 0.08 prior
08:50 (FR) France Debt Agency (AFT) to sell combined €5.4-6.6B in 3-month, 6-month and 12-month BTF Bills
09:00 (MX) Mexico Q1 Final GDP Q/Q: 0.6%e v 0.6% prelim; Y/Y: 2.7%e v 2.7% prelim, Nominal GDP Y/Y: 8.8%e v 8.7% prior
09:00 (MX) Mexico Mar IGAE Economic Activity Index (Monthly GDP) Y/Y: 4.2%e v 1.0% prior
09:00 (RU) Russia Apr Unemployment Rate: 5.5%e v 5.4% prior
09:00 (RU) Russia Apr Real Retail Sales M/M: -0.9%e v +7.9% prior; Y/Y: -0.3%e v -0.4% prior
09:00 (CN) China Apr Conference Board Leading Economic Index: No est v 0.9 prior
09:00 (EU) EU/Euro-Area Finance Ministers (Eurogroup) meet in Brussels
09:30 (EU) ECB announces Covered-Bond Purchases
09:35 (EU) ECB calls for bids in 7-Day Main Refinancing Tender
11:30 (US) Treasury to sell 3-Month and 6-month Bills
13:30 (AU) RBA's Debelle speech in Basel
15:00 (MX) Mexico Citibanamex Survey of Economists
16:00 (US) Weekly Crop Progress Report
GOLD Ready For Another Leg Higher, SILVER Short-Term Bullish, CRUDE OIL Strong Demand.
GOLD Ready for another leg higher.
Gold seems on its way back up. Hourly support is located at 1246 (18/05/2017 low). Stronger support is given at 1195 (10/03/2017 low). Expected to show further upside pressures.
In the long-term, the technical structure suggests that there is a growing upside momentum. A break of 1392 (17/03/2014) is necessary ton confirm it, A major support can be found at 1045 (05/02/2010 low).
SILVER Short-term bullish.
Silver increases. Strong support is given at 15.63 (20/12/2017 low). Closest support is given at 16.20 (04/05/2017 low). Key resistance is given at a distance at 19.00 (09/11/2017 high). Expected ton increase until 50% Fibonacci retracement around 17.30.
In the long-term, the death cross indicates that further downsides are very likely. Resistance is located at 25.11 (28/08/2013 high). Strong support can be found at 11.75 (20/04/2009).
CRUDE OIL Strong demand.
Crude oil continues to bounce on shortsqueeze move. Support is given at a distance 43.76 (05/05/2017 low). Demand is very strong and the road is wide-open for further increase.
In the long-term, crude oil has recovered after its sharp decline last year. However, we consider that further weakness are very likely. Strong support lies at 24.82 (13/11/2002) while resistance can now be found at 55.24 (03/01/2017 high).