Sample Category Title
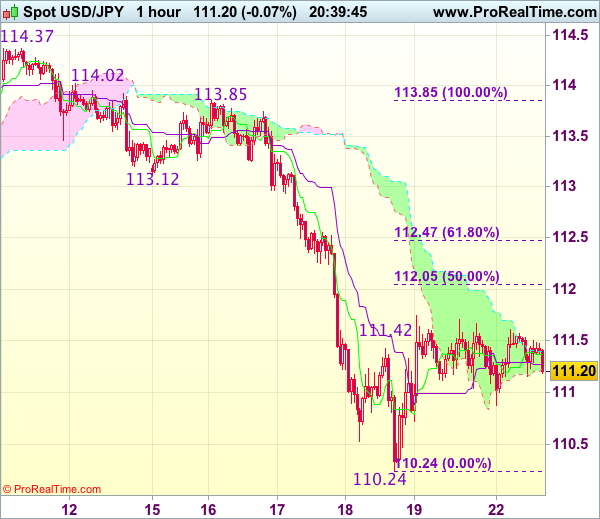
USD/JPY Hovers Above Significant Support Post Trump’s Scandal
Last week USD had its biggest weekly fall since the US presidential election, caused by Trump's Russia leak scandal.
This week markets' risk-off sentiment has been slightly eased.
On May 18th USD/JPY hit a low of 110.22, last seen on April 25th.
Notably, the downtrend has held above the significant support line at 110.00.
Bulls have further recovered to the the next psychological resistance level at 111.00, indicating bullish momentum has been increasing.
The daily Stochastic Oscillator is around 30 which suggests a rebound.
The resistance level is at 111.70 followed by 112.00 and 112.20.
The support level is at 111.00 followed by 110.70 and 110.50.
If there are further adverse findings from the FBI's investigation on Trump's Russia leak scandal it will likely restrain the bullish momentum of USD/JPY.
Conversely, without further adverse findings, we will likely see a rebound of USD/JPY.
Keep an eye on the US economic data on Tuesday at 15:00 BST and the FOMC Minutes on Wednesday at 19:00 BST as it will likely affect USD and USD crosses.
Trade Idea Update: USD/JPY – Sell at 112.05
USD/JPY - 111.23
Original strategy :
Sell at 112.05, Target: 110.85, Stop: 112.40
Position : -
Target : -
Stop : -
New strategy :
Sell at 112.05, Target: 110.85, Stop: 112.40
Position : -
Target : -
Stop : -
As the greenback found support at 110.24 last week and rebounded, retaining our view that further consolidation above this level would be seen and corrective bounce to 112.00-05 (50% Fibonacci retracement of 113.85-110.24) cannot be ruled out, however, reckon upside would be limited and bring another decline later, below 110.70-75 would suggest the rebound from 110.24 has ended, bring retest of this level first.
In view of this, would be prudent to sell dollar on further subsequent recovery as 112.05-10 should limit upside and bring another decline. Above 112.35-40 would defer and signal low is formed instead, risk a stronger rebound to 112.65-70.
DAX Steady but Trump Concerns Remain
The DAX index has ticked lower in the Monday session. Currently, the DAX is trading at 12,596.50. On the release front, it's a quiet start to the week, with no economic events on the schedule. There are a host of events on Tuesday, highlighted by Manufacturing PMIs in Germany and the eurozone, as well as German Ifo Business Climate.
The political turmoil in Washington has had a chilling effect on global stock markets. The DAX dropped 1.4% last week, as nervous investors have sought out safe-haven assets such as gold and the Japanese yen. Will the downward spiral in the stock markets continue? If the crisis atmosphere in Washington continues, stocks could be headed lower. It's been a rocky few months for President Trump, but last week was perhaps his most difficult since taking office. Trump's administration was rocked by reports that he had asked former FBI director James Comey to end an investigation into connections between Russia and the Trump campaign team during the US election. If these accusations are true, Trump could be charged with committing obstruction of justice. President Trump fired back on Thursday, angrily denouncing this move as a "witch hunt". The media and the Democrats have had a field day with Trump's woes, and many Republicans are expressing unease with an administration that appears rudderless and is staggering from crisis to crisis.
The markets are keeping a close eye on Monday's meeting of EU finance ministers, which will be discussing Greece's debt. Greece has undergone a severe austerity plan and understandably, the Greek government is reluctant to adopt further painful measures. However, Greece could be headed on a collision course with the EU, if the latter insists that the further reforms are needed. German Finance Minister Wolfgang Schaeuble praised the reforms implemented by Greece as "remarkable", but insisted that Greece must take further steps before the EU provides further financial aid. Greek's debt woes once resulted in the country almost leaving the eurozone, and if the EU holds up aid, European stock markets could drop sharply.
EUR/USD Mid-Day Outlook
Daily Pivots: (S1) 1.1130; (P) 1.1171 (R1) 1.1246; More....
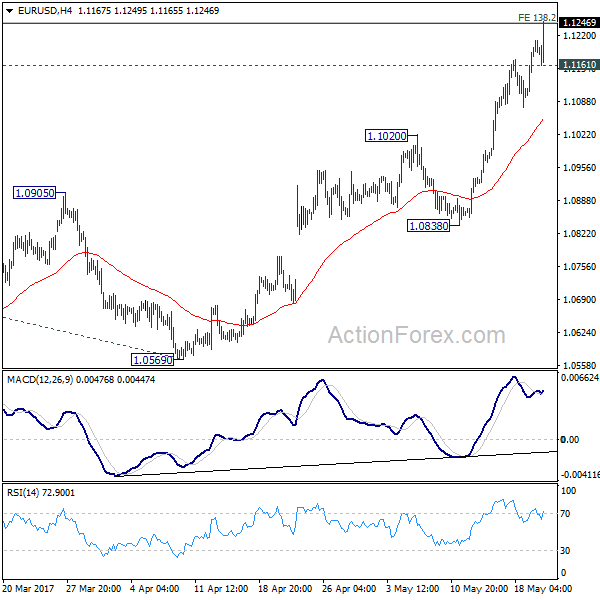
EUR/USD's rally extends to as high as 1.1249 so far today. 138.2% projection of 1.0339 to 1.0828 from 1.0569 at 1.1245 is already met. At this point, we'll stay cautious on strong resistance from 1.1245/98 resistance zone to limit upside and bring reversal. However, decisive break of 1.1298 will carry larger bullish implication and target 1.1615 resistance next. On the downside, below 1.1161 minor support will turn bias neutral first.
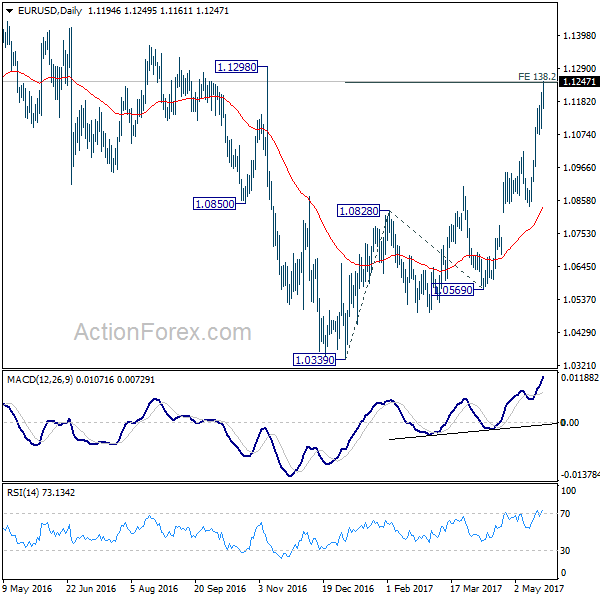
In the bigger picture, the case for medium term reversal continues to build up with EUR/USD now far above 55 week EMA. Also, bullish convergence condition is seen in weekly MACD. Focus will now be on 1.1298 key resistance. Rejection from there will maintain medium term bearishness and would extend the whole down trend from 1.6039 (2008 high). However, firm break of 1.1298 will indicate reversal. In such case, further rally would be seen back to 1.2042 support turned resistance next.
Sterling Tumbles as Conservatives Halved Lead Over Labour, Euro Marches On
Sterling trades broadly lower today on UK politics news. Prime Minister Theresa May's Conservatives was originally having over 20pts lead over Labour back when May announced the snap election back in April. But according to the latest Survation telephone poll, the lead halved to 9% only. The poll put Conservatives on 43% while Labour at 34%. The election is seen as an important step for May to gain solid mandate for Brexit negotiation. And a less than satisfactory result could weaken May's position.
Brexit Sec Davis warned of walking out
UK's Brexit Secretary David Davis warned during the weekend UK could walk away from negotiation if EU demands EUR 100b divorce bill. Davis pointed out that 'We don't need to just look like we can walk away, we need to be able to walk away. Under the circumstances, if that was necessary, we would be in a position to do it.'
EU minister to meet in Brussels
Meanwhile, EU ministers meet in Brussels today to fine-tune Brexit negotiation positions. There is no formal position on the sum yet. European Commission President Jean-Claude Juncker said that amount is about GBP 50b. Luxembourg Prime Minister Xavier Bettlel estimated that to be between EUR 40b and EUR 60b. The Financial Times estimated the sum to be as high as EUR 100b. On the other hand, UK Institute of Chartered Accountants expected it to be as low as GBP 5b.
CEBR: Brexit could cost GBP 36b annually
In UK, an analysis conducted by the Centre of Economic Business Research (CEBR) for the Open Britain organization noted that the lost of EU single market in services after Brexit could cost UK companies up to GBP 36b annually. The reported pointed out that "about a third of the losses from single market withdrawal result from lost businesses in financial services." The impact could be particularly negative on financial services, telecommunications and transport.
It elaborated that "the free movement of services can also be seen to directly touch on immigration if people are coming to the UK to offer their services as self-employed individuals or if firms exercise their mobility rights while wanting to carry their workforce over." And, the overall impact on UK's GDP would be between 1.4% and 2.0%, equivalent to GBP 25b to GBP 36b a year.
OECD: Growth in Germany and Japan picked up
The Organization for Economic Cooperation and Development said today that the combined economic output of its 35 members grew 0.4% qoq in Q1. That's notably slower than Q4's 0.7%. Notable slowdown is seen in US, France and UK. Overall EU growth slowed too but was not as deep. On then other hand pickups in Japan and Germany were clear and has offset some of the slow down in others. Still, economists are generally optimistic about Q2 and Q3. In particular, IMF projects global growth to be at 3.5% this year, revised slightly up from prior forecast of 3.4%. And if realized, that would be the quickest pace in fives years.
Euro optimism continues
Euro remains strong today and extends broad based rally on expectation of further strength in growth. Germany Bundesbank noted in the monthly bulletin that the country's growth would be strong in Q2, following the impressive 0.6% growth back in Q1. Bundebank expected construction sector would continue to "flourish". Services sector is also expected to expand and give a lift to the labor market and wage growth. Consumer spending would be benefited from the developments. On the other hand, Bundesbank also warned that US President Donald Trump's tax plan would hurt the US economy in the long run. It pointed out that the plan would lead to 30% jump in debt-to-GDP ratio within a decade.
Oil rally extends, OPEC to agree on production cut extension
Oil prices continue to surge ahead of an OPEC meeting this Thursday. Saudi Arabia's energy minister Khalid al-Falih said "everybody I talked to... expressed support and enthusiasm to join in this direction" of extending the product cut agreement by a further nine months til next March. And, he's optimistic that continuation with the same level of cuts, plus eventually adding one or two small producers, if they wish to join, will be more than adequate to bring the five-year balance to where they need to be by the end of the first quarter 2018." WTI crude oil is trading at 50.8 at the time writing, up 0.9% comparing to last week's close. Recent rebound in WTI is expected to extend further to 53.76/55.24 resistance zone in near term.
Trump to deliver first budget proposal on Tuesday
US President Donald Trump will deliver his first major budget proposal on Tuesday. It's reported there is a proposal for balancing the federal budget within 10 year through steep cuts to safety net and discretionary spending. One of the key point to note is possibly the massive USD 800b cut over 10 years on Medicaid. The Congressional Budget Office has estimated that this could impact healthcare benefits of 10 million low-income Americans over the decade. And, the inclusion of Medicaid cut is seen as significant by some analysts because there are clear rejections on it from a number of Senate Republicans. While the House has voted to cut Medicaid funding, Senate Republicans have already indicated that they would start from scratch. Such inclusion could further enlarge the division between Trump and some Republicans at the time of political turmoil in Washington.
EUR/USD Mid-Day Outlook
Daily Pivots: (S1) 1.1130; (P) 1.1171 (R1) 1.1246; More....
EUR/USD's rally extends to as high as 1.1249 so far today. 138.2% projection of 1.0339 to 1.0828 from 1.0569 at 1.1245 is already met. At this point, we'll stay cautious on strong resistance from 1.1245/98 resistance zone to limit upside and bring reversal. However, decisive break of 1.1298 will carry larger bullish implication and target 1.1615 resistance next. On the downside, below 1.1161 minor support will turn bias neutral first.
In the bigger picture, the case for medium term reversal continues to build up with EUR/USD now far above 55 week EMA. Also, bullish convergence condition is seen in weekly MACD. Focus will now be on 1.1298 key resistance. Rejection from there will maintain medium term bearishness and would extend the whole down trend from 1.6039 (2008 high). However, firm break of 1.1298 will indicate reversal. In such case, further rally would be seen back to 1.2042 support turned resistance next.
Economic Indicators Update
| GMT | Ccy | Events | Actual | Forecast | Previous | Revised |
|---|---|---|---|---|---|---|
| 23:01 | GBP | Rightmove House Prices M/M May | 1.20% | 1.10% | ||
| 23:50 | JPY | Trade Balance (JPY) Apr | 0.10T | 0.25T | 0.17T | 0.11T |
| 13:00 | CNY | Conference Board Leading Index Apr | 0.90% | |||
| 14:00 | USD | Fed's Harker Speaks in New York | ||||
| 14:30 | USD | Fed's Kashkari Speaks |
Fed Speeches and Trump’s Global Tour in Focus
- GBP weighed down as May's poll lead is cut in half;
- GBPUSD pares Friday's gains but EURGBP looks more bullish;
- Donald Trump's global tour in focus on an otherwise quiet day.
It's been a relatively uneventful start to the week, with equity markets in Europe trading a little mixed while those in the US are expected to open flat. The FTSE is clearly the outperformer in the European session so far buoyed by both the weaker pound sterling and the gains in commodity markets.
The pound is coming under some pressure this morning, weighed down by comments from Brexit Secretary David Davis and polls over the weekend that showed the Conservatives lead over Labour has been slashed. Davis' claim that the UK will quit talks with the EU if the reported Brexit bill isn't revised lower appears to be putting some pressure on the currency. While the pound remains vulnerable to suggestions that talks could break down, I think this is just another case of people involved preparing for tough negotiations and threatening things they ultimately will try to avoid at all costs.
The polls released over the weekend may also be contributing to moves in the pound this morning, with the Conservatives lead over Labour having halved in some cases. A large majority for the Conservatives is viewed as beneficial by some when it comes to the Brexit negotiations as it gives them a strong mandate while enabling them to take a softer approach when necessary without having to rely on the support of some of the bigger eurosceptics in the party.
It is worth considering though that while sterling is among the worst performing currencies today, the loss against the dollar only equates to around half of the gains made on Friday. The reality may well be that the apparent negative news is aiding a small correction that was on the cards regardless. That said, it is suffering a little more against the euro, with today's moves having taken the pair through an interesting technical level that may signal further downside for the pound.
The first trading day of the week is looking a little quiet in terms of economic data or events. US President Donald Trump's global tour will be of interest to traders although we do appear to be seeing a more reserved version of himself so far, which will come as a relief to many. The political storm at home is unlikely to go away but it may take a bit more of a backseat this week. We will hear from two voting members of the FOMC today, with Neel Kashkari and Patrick Harker both scheduled to make appearances.
Trade Idea: GBP/USD – Stand aside
GBP/USD – 1.3006
Recent wave: Wave V of larger degree wave (III) has ended at 1.1986 and major correction has commenced from there for gain to 1.3000 and 1.3140-50
Trend: Near term up
New strategy :
Stand aside
Position: -
Target: -
Stop:-
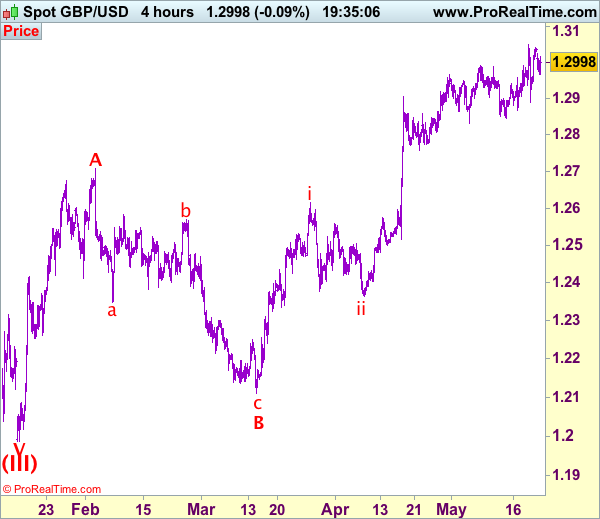
Although cable rose to as high as 1.3040 late last week, as sterling has retreated again after faltering below previous resistance at 1.3048, suggesting further consolidation would be seen and pullback to 1.2960 cannot be ruled out, however, reckon downside would be limited to 1.2920-25 and bring another rise later. A break of said resistance at 1.3048 would confirm upmove has resumed and extend further rise to 1.3075-80, then 1.3100-10 but near term overbought condition should limit upside to 1.3050-60 and price should falter well below 1.3100-10.
Our preferred count on the daily chart is that cable's rebound from 1.3500 (wave (A) trough) is unfolding as a wave (B) with A ended at 1.7043, followed by triangle wave B and wave C as well as wave (B) has ended at 1.7192, the subsequent selloff is the larger degree wave (C) which is still unfolding with minor wave (III) of larger degree wave 3 ended at 1.1986, hence wave (IV) correction is in progress which could either be a triangle wave (IV) of a complex formation but upside should be limited to 1.3500 and price should falter well below 1.4000, bring another decline in wave (V) of 3 for weakness to 1.1500, then 1.1200.
On the downside, whilst pullback to 1.2960 is likely, reckon 1.2920-25 would limit downside and bring further consolidation. Only below said support at 1.2889 would signal top has been formed at 1.3048 and bring retracement of recent upmove to 1.2866, then towards previous support at 1.2844 which is likely to hold from here.
Trade Idea: GBP/JPY – Stand aside
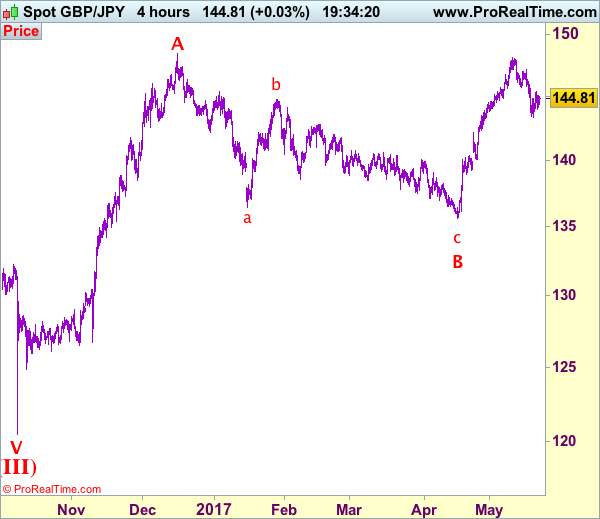
GBP/JPY - 144.90
Recent wave: Medium term low formed at 120.50 and (A)-(B)-(C) major correction has commenced with (A) leg ended at 148.45, hence wave (B) is unfolding for retreat to 131.00-10.
Trend: Near term up
New strategy :
Stand aside
Position: -
Target: -
Stop:-
Although sterling found support at 144.00 and has rebounded again, retaining our view that further consolidation above last week’s low at 143.40 would be seen and gain to 145.40-45 cannot be ruled out, however, break of resistance at 145.90-95 is needed to signal low is formed there, bring a stronger rebound to 146.30-35 but resistance at 147.10 should remain intact, bring retreat later.
In view of this, would be prudent to stand aside for now. Below 144.00 would bring test of 143.80-85 but break there is needed to signal the rebound from 143.40 has ended, bring another test of this level, break there would extend the corrective decline from 148.10 top for retracement of recent upmove to 143.00, then towards 142.50-60.
Our preferred count is that larger degree wave V with circle is unfolding from 251.12 with wave (I) 219.34, (II): 241.38 and wave (III) is subdivided into 1: 192.60, 2: 215.89 (23 Jul 2008) and wave 3 ended at 118.87 earlier in 2009. The correction from there to 162.60 is wave 4 which itself is a double three and is labeled as first a-b-c ended at 151.53, followed by wave x at 139.03, 2nd a ended at 162.60, 2nd b at 146.75 and 2nd c leg of wave 4 ended at 163.00. Therefore, the decline from 163.00 to 116.85 is now treated as wave 5 which also marked the end of larger degree wave (III), hence wave (IV) major correction has commenced for retracement of the wave (III) from 241.38 and upside target at 183.95-00 (50% Fibonacci retracement of the wave (II) from 241.38) had been met, a drop below 160.00 would suggest wave (IV) has ended at 195.85, bring decline in wave (V) for initial weakness to 130 (already met) and 120.
Technical Outlook: Spot Gold Back Above Daily Cloud, Reduces Risk Return To Key $1245 Support
Spot Gold is holding positive near-term tone on Monday and is back above daily cloud (cloud top lies at $1254 and is reinforced by daily Kijun-sen and 50% of $1295/$1214), extending strong recovery rally from Friday. While the price is holding above the cloud, fresh upside attempts could be expected. Bullishly aligned daily studies support the notion. However, negative signal is coming from reversal of slow stochastic from overbought zone and the price may ease back into cloud. Session low at $1251 offers initial support, guarding very strong support and lower breakpoint at $1245 (converged 200/55SMA's/daily cloud base/Fibo 38.2% of $1295/$1214). Extended dips should be contained here to avoid bearish scenario expected on break below $1245 pivot.
Res: 1257, 1261, 1265, 1270
Sup: 1254, 1251, 1245, 1241
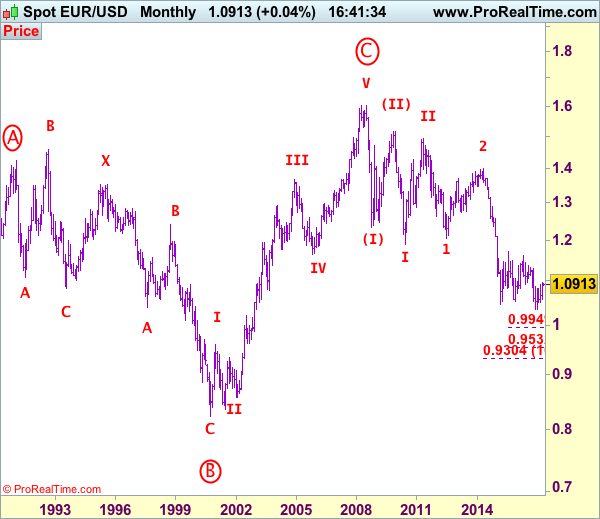
EUR/USD Elliott Wave Analysis
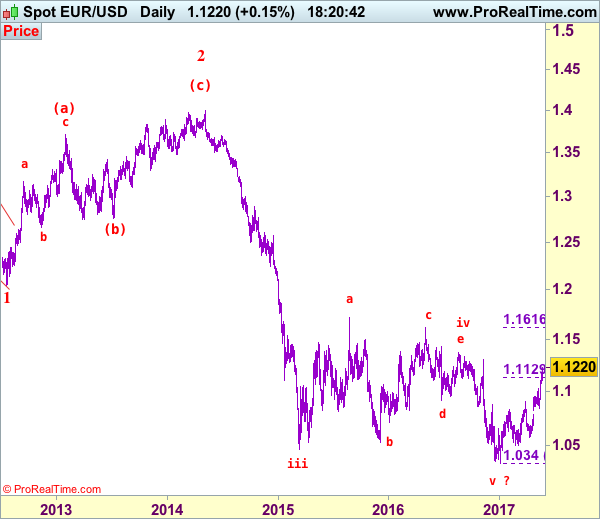
EUR/USD – 1.1241
EUR/USD: Wave (c) of 2 ended at 1.3993 and wave 3 of III has commenced for weakness to 1.0411 (1.236 of wave 1), then 1.0000.
As euro’s upmove has gathered momentum after breaking recent high at 1.1025, adding credence to our bullish view that the erratic upmove from 1.0340 low is still in progress and test of previous resistance at 1.1300 is likely, however, a daily close above there is needed to retain bullishness and signal medium term downtrend has resumed and extend gain to another previous resistance at 1.1366 but near term overbought condition should prevent sharp move beyond 1.1430-35 and price should falter below 1.1500, bring retreat later.
Our preferred count on the daily chart remains that a wave (II) from 1.2329 ended at 1.5145 with A-leg ended at 1.4720, followed by wave B at 1.2457, the wave C from there was also a 3 legged move and is labeled as (a): 1.3739, (b): 1.2885, the wave iii of the 5-waver (c) from 1.2885 has ended at 1.4339 and wave iv is a triangle ended at 1.3878 and wave v formed a top at 1.5145. The decline from there is a 5-waver (C) with minor wave (i) of I of (C) ended at 1.4218 with wave (ii) ended at 1.4580, wave (iii) ended at 1.3267 and wave (iv) ended at 1.3692 and wave (v) ended at 1.1876, this is also the low of wave I of (C) and wave II ended at 1.4940, hence wave III is now in progress with a diagonal wave 1 ended at 1.2042, the breach of previous support at 1.1876 (wave I trough) adds credence to our view that the wave 2 has ended at 1.3993, wave 3 has commenced for further weakness to 1.0411, then towards 1.0000.
On the downside, although initial pullback to 1.1190-00 cannot be ruled out, reckon 1.1100 would limit downside and bring another rise to aforesaid upside targets. Only below said previous resistance at 1.1025 would abort and suggest a temporary top is formed instead, bring correction to 1.0975-80 but downside should be limited to 1.0900 and support at 1.0839 should remain intact, bring rebound later.
Recommendation: Buy at 1.0780 for 1.0980 with stop below 1.0680.
Euro's long-term uptrend started from 0.8228 (26 Oct 2000) with an impulsive structure. The rise from 0.8228 to 0.9593 (5 Jan 2001) is labeled as wave I, the retreat to 0.8352 (6 Jul 2001) is wave II and the rally to 1.3670 (31 Dec 2004) is wave III. Wave IV from there ended at 1.1640 (15 Nov 2005), the subsequent upmove to 1.6040 (July 15, 2008) is treated as wave V, the major selloff from the record high of 1.6040 to 1.2329 (October 27, 2008) signals a reversal has taken place with (I) leg ended at 1.2329 and once (II) ended at 1.5145, wave (III) itself is an extended move with I: 1.1876 and complex wave II ended at 1.4902, wave III has commenced with wave 1 and 2 ended at 1.2042 and 1.3993 respectively, wave 3 of III is now unfolding for weakness towards parity.