Sample Category Title
Elliott Wave View: FTSE Extending Higher
Short Term Elliott Wave view in FTSE suggests the rally from 4/20 low (7096.6) is unfolding as a zigzag Elliott Wave structure where Minute wave ((a)) ended at 7302.57 and Minute wave ((b)) ended at 7197.28. Subdivision of Minute wave ((a)) unfolded as an impulse where Minuttte wave (i) ended at 7134.53, Minutte wave (ii) ended at 7104.22, Minutte wave (iii) ended at 7290.82, Minutte wave (iv) ended at 7262.32, and Minutte wave (v) of ((a)) ended at 7302.57. The Index then pullback and ended Minute wave ((b)) at 7197.28
Minute wave ((c)) unfolded as an ending diagonal where Minutte wave (i) ended at 7280.7, Minutte wave (ii) ended at 7222.81, Minutte wave (iii) ended at 7460.20, and Minutte wave (iv) ended at 7435.64. Index has reached 1.618 extension of the Minute ((a)) – ((b)) and thus cycle from 4/20 low is mature and we are calling Minor wave 1 completed at 7533.7. Minor wave 2 decline from there is proposed complete at 7389.26. The Index has since resumed the rally higher and near term, while pullbacks stay above 7389.26, and more importantly above 7096.6, expect FTSE to extend higher. A break above Minor wave 1 at 7533.7 is needed to confirm the next leg higher has started. Until then, a double correction in Minor wave 2 can’t be ruled out. We don’t like selling the proposed pullback.
If FTSE breaks below 7389.26, this suggests the Index is still correcting within Minor wave 2 as a 7 swing structure and this would open extension to the downside to the next 100% – 123.6% in 7 swing. In the event that this happens, the Index remains favored to continue the rally higher again after the 7 swing correction is completed as far as pivot at 7096.6 low remains intact.
FTSE 1 Hour Elliott Wave Chart
All Aboard The Euro Train
All aboard the Euro train
Equity investors for the most part investors remained chiefly on the sidelines with no major data releases with few disruptive headlines with the S&P nudging higher at the close and all but filled last Wednesday market gap.But there was animated action on the currency markets when dealers focalized on the Euro. And losing no time, traders rushed to top side expose after Angela Merkel told a Berlin audience that the strong Euro makes German products cheaper, implying euro was too weak due to ECB monetary policy and as investors continue to brood about the political developments in the US and thereby shying away from buying the dollar.
Despite the political overhang, the general market temperament suggests that that investors are killing on on the outcomes of the ECB meeting and what the FOMC has in store for the markets. Currently, markets are pricing in a ~70% probability of a rate hike in June but only 60% for one more rate hike in 2017. If it becomes clear that the FOMC are keen to move on interest rates beyond June, there remains some decent scope for year end Fed repricing which should prop the dollar. IN the meantime, I suspect the markets will continue to be hostage to shifting headlines
Thankfully there’s been a pleasant reprieve for the Comey/Trump headlines, but the melodrama is expected to pick up after Memorial Day ( US) and Spring Bank Holiday ( UK) when Trump returns to Washington after his first official trip abroad.
Euro
The overhang from weak US economic data and the ComeyTrump saga has dealers shunning the greenback which continues to promote demand for the Euro. Merkel’s comments added fuel to this fire in a market that is fully entrenched in buy the dip mode. After touching an intraday high above 1.1260, short term traders took profit as the FOMC side of the calculus has yet to play out. With minutes on Wednesday and a plethora of Fed speakers still to come. Regardless, with the market playing the Euro from the long side, last week’s aggressive breakout suggests a test of 1.1300 is in the offing.As markets are looking for any excuse to load up on Euro’s
Japanese Yen
While yesterday’s UsdJpy sell off after another NK missile test is short lived, But Yen traders continue to eye the Korean geopolitical landscape and correctly so. North Korea appears dead set on launching its first intercontinental ballistic as they continue to make technological advancements within their missile regime. But for the time being with US political tension easing, and despite little reason to sell Yen, the market still views selling USDJPY at current levels as low-risk reward trade ahead of the FOMC. Rather they the prefer to move into EURJPY which offers the path of least resistance on short JPY.
Australian Dollar
It’s a huge week for commodity currencies heading into May OPEC meeting Metal and Energy markets continued to trade positively with wTI trading north of 50.00 per barrel as the markets is convinced r the nine-month extension to go through, while reports are even suggesting even deeper cuts. With the Aussie basing last week after easing in June US rate hike probability and a bounce in Iron ore with OPEC looming price action and momentum suggest we push toward the 7500 level. But there is potential for a catchup move on a clear break.
Gold Gains As Fed Speakers In Focus
Gold has moved higher at the start of the week. In Monday's North American session, spot gold is trading at $1262.45 an ounce. There are no economic releases out of the US on Monday. The markets are keeping an eye on the Federal Reserve, as four FOMC members will be making appearances. On Tuesday, the US releases New Home Sales.
When the US dollar is in trouble, safe-haven gold is often the beneficiary. This was the case last week, as the political chaos which gripped the Trump administration last week took a toll on the dollar. Gold responded with strong gains of 2.2% and reached its highest levels in 3 weeks. Nervous investors ditched US-denominated assets in favor of gold and other safe-haven assets, and the trend could continue if the crisis continues. Last week, Trump's administration was rocked by reports that he had asked former FBI director James Comey to end an investigation into connections between Russia and the Trump campaign team during the US election. If these accusations are true, Trump could be charged with committing obstruction of justice. Trump couldn't pack fast enough for his first official trip overseas, and he has been warmly received in Saudi Arabia and Israel. With Democrats smelling blood and the noxious term of 'impeachment' being thrown around, Trump may face a chilly reception in Congress when he returns from his trip abroad.
Trump Sticks to Script on Saudi Visit
A lack of fundamental data on Monday has given the markets an opportunity to focus on the Federal Reserve, with four FOMC members delivering speeches during the day. The Fed is expected to announce a rate hike at its June 14 meeting, but the markets are having a tough time pricing in a rate hike, as the odds of a hike have been constantly changing. Just one month ago, a rate hike was priced in at 50%. The odds have jumped higher in May but continue to show movement. Currently, the markets have priced in a hike at 78%, up from 73% on Friday. If the likelihood of a June move continue to fluctuate, gold prices could follow suit, as gold prices are inversely linked to interest rate moves.
OPEC Nears Deal
Saudi Arabia's oil minister made a trip to Iraq Monday and shored up support for a 9-month quota extension. On Monday, the kiwi was the top performer while the pound lagged. A speech from the Fed's Brainard later could be telling. There are 5 Premium trades currently open.
Saudi's Al-Falih traveled to Iraq amidst reports that Baghdad, Oman and Kuwait only wanted a six month extension to OPEC quotas. His plan worked and late in the day, Iraqi officials said they were on board.
What's puzzling is that Iraq has been one of the worst violators of the initial production levels as it seeks to recover lost ground due to war. Al-Falih was confident a nine-month deal is coming so that could move the discussion towards deeper cuts in what's a possible upside risk on Thursday when the decision is due.
The wildcard remains Iran. Leaders there have been less-enthusiastic about cuts and the government wants to regain market share. On the topic of oil, the Fed's Kaplan talked about US share on Monday and he was highly optimistic about the amount of investment and potential yield from technological improvements in US shale. He also hinted that breakeven points are coming down. A huge risk for 2018 is that US supply continues to climb and it forces OPEC to pump flat-out.
On monetary policy, Kaplan's comments where characterized as typically-hawkish by the newswires but it was a mischaracterization. Indeed he said he still favors 2 more hikes this year but he repeatedly warned that inflation numbers had raised warning signs and that he will be watching closely.
At the moment, the Fed calendar until the June 3 blackout is quiet in terms of heavyweights. That's likely to change as talks are added but at the moment, the only Fed governor on the schedule is Brainard, who speaks at 2330 GMT today. She's a dove but s also one of the first policymakers who tipped the March hike. If she drops any hawkish hints, it could send the dollar skyward.
Yen Steady, Markets Looks for Clues for FOMC
USD/JPY is showing little movement at the start of the week. In Monday's North American session, the pair is trading at the 111 line. On the release front, Japan's trade surplus narrowed to JPY 0.10 trillion in April, short of the estimate of JPY 0.25 trillion. In the US, we'll hear from four FOMC members, and the markets will be looking for clues as to the Fed's plans with regard to future rate hikes. On Tuesday, the US will publish New Home Sales.
The US dollar posted broad losses last week and the Japanese yen took full advantage, gaining 1.9 percent. The safe-haven yen has become an attractive asset for nervous investors, as the political turmoil which has gripped Washington has soured investors on the stock markets and the greenback. The yen's gains mirror continuing trouble for the Trump administration, which is lurching from crisis to crisis. Last week Trump's administration was rocked by reports that he had asked former FBI director James Comey to end an investigation into connections between Russia and the Trump campaign team during the US election. If these accusations are true, Trump could be charged with committing obstruction of justice. Trump couldn't pack fast enough for his first official trip overseas, as he has been warmly received in Saudi Arabia and Israel. With Democrats smelling a bona fide scandal and the noxious term of "impeachment" being thrown around, Trump may face a chilly reception in Congress when he returns from his trip abroad.
What's next for the Federal Reserve? With no data out of the US or Japan on Monday, the markets will have a chance to focus on the Federal Reserve, with four FOMC members delivering speeches. The Fed has been keeping the markets guessing in recent weeks regarding a rate hike. The central bank is expected to announce a rate hike at its June 14 meeting, but the odds of a hike have shown strong volatility. In late April, a rate hike was priced in at just 50%. The odds jumped higher in May but continue to show movement. Currently, the markets have priced in a hike at 78%, up from 73% on Friday. If the likelihood of a June move continue to fluctuate, the US dollar could also show some movement, as a rate hike will make US-dollar assets more attractive to investors.
Elliott Wave Trade Ideas Performance Update
Not a very good week for us, the choppy movement in sterling tripped most of our stops in GBP/USD and GBP/JPY, however, we were able to enter a long position in EUR/GBP at 0.8530 and our upside target at 0.8630 was just met today.
A long position was also entered in USD/CAD and the position is still holding at the moment.
No position was entered among other currency pairs.
In short, 5 positions were entered last week with total loss of 70 points and the positions are listed below.
17 May : GBP/USD - Short at 1.2920, exited at 1.2970 (- 50 points)
18 May : GBP/JPY - Long at 144.50, exited at 143.90 (- 60 points)
18 May : EUR/GBP - Long at 0.8530, exited at 0.8630 (+ 100 points)
19 May : GBP/USD - Long at 1.2995, exited at 1.2935 (- 60 points)
22 May : USD/CAD - Long at 1.3530,
| AUD EUR/JPY EUR/GBP CAD GBP GBPJPY
Jan - 15 -275 - 35 -120
Feb + 140 -17 - 40 +11
Mar - 20 +115 +132 - 19
Apr + 30 - 40 +120 + 45
May - 55 +100 -65 -60
Jun
Jul
Aug
Sep
Oct
Nov
Dec
Y-T-D + 135 - 232 +117 + 158 -65 - 15
Candlesticks and Ichimoku Trade Ideas Performance Update
We apologize for our poor result last week, all positions entered in EUR/USD, USD/JPY and GBP/USD were stopped, we were basically on the wrong side for the entire week.
In short, 6 positions were entered among all 4 currency pairs with total loss of 175 points and the positions are listed below:
16 May : EUR/USD - Short at 1.1000, exited at 1.1035 (- 35 points)
17 May : USD/JPY - Long at 112.35, exited at 112.00 (- 35 points)
17 May : GBP/USD - Short at 1.2925, exited at 1.2960 (- 35 points)
19 May : GBP/USD - Long at 1.2945, exited at 1.2910 (- 35 points)
19 May : GBP/USD - Short at 1.2990, exited at 1.3025 (- 35 points)
22 May : USD/CHF - Long at 0.9700,
| JPY EUR CHF GBP
Jan + 167 - 85 - 10 + 50
Feb + 200 +150 +93 - 59
Mar -23 -70 -23 - 35
Apr + 65 + 93 + 50 - 40
May - 30 - 35 -140
Jun
Jul
Aug
Sep
Oct
Nov
Dec
Y-T-D + 378 + 48 +110 -224
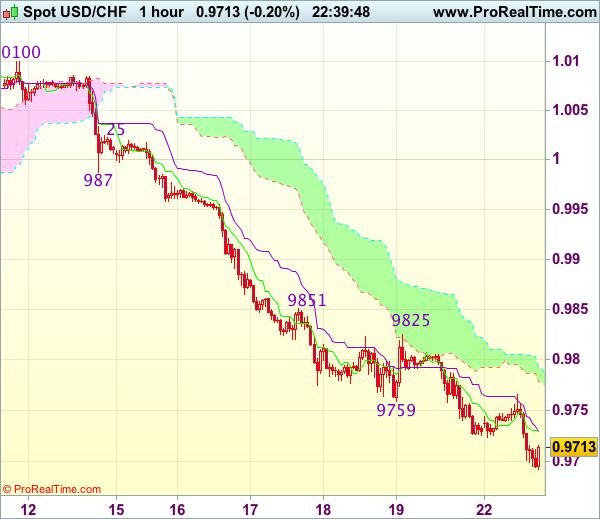
Trade Idea Wrap-up: USD/CHF – Hold long entered at 0.9700
USD/CHF - 0.9734
Most recent candlesticks pattern : N/A
Trend : Near term down
Tenkan-Sen level : 0.9729
Kijun-Sen level : 0.9729
Ichimoku cloud top : 0.9792
Ichimoku cloud bottom : 0.9778
Original strategy :
Bought at 0.9700, Target: 0.9800, Stop: 0.9665
Position : - Long at 0.9700
Target : - 0.9800
Stop : - 0.9665
New strategy :
Hold long entered at 0.9700, Target: 0.9800, Stop: 0.9690
Position : - Long at 0.9700
Target : - 0.9800
Stop : - 0.9690
Although dollar has fallen again after meeting renewed selling interest at 0.9766, loss of downward momentum should prevent sharp fall to repeat and bring subsequent rebound, above said resistance at 0.9766 would bring subsequent bounce to 0.9800 but reckon upside would be limited to 0.9825 and previous resistance at 0.9851 should remain intact, bring another decline later.
In view of this, we are holding on to our long position entered at 0.9700. Below 0.9670-75 would risk weakness to 0.9650 but still reckon downside would be limited to 0.9620-25 and bring another rebound later.
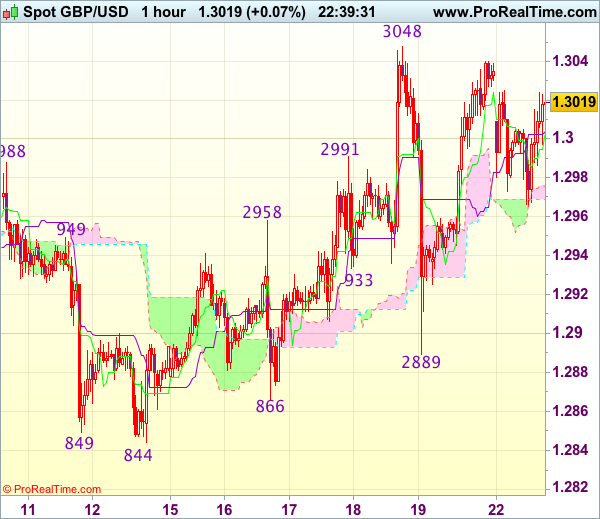
Trade Idea Wrap-up: GBP/USD – Stand aside
GBP/USD - 1.3014
Most recent candlesticks pattern : N/A
Trend : Near term up
Tenkan-Sen level : 1.3004
Kijun-Sen level : 1.3004
Ichimoku cloud top : 1.2974
Ichimoku cloud bottom : 1.2969
New strategy :
Stand aside
Position : -
Target : -
Stop : -
Despite staging a strong rebound from 1.2889 to 1.3040 on Friday, the subsequent retreat after faltering below last week’s high of 1.3048 suggest further choppy trading below this level would be seen and pullback to 1.2950-55 cannot be ruled out, however, reckon downside would be limited to 1.2920-25 and said support at 1.2889 should remain intact, bring another rebound later.
On the upside, only a break of said resistance at 1.3048 would confirm recent upmove has resumed an extend further gain to 1.3075-80 and possibly towards 1.3100-10 later. As near term outlook is mixed, would be prudent to stand aside in the meantime.
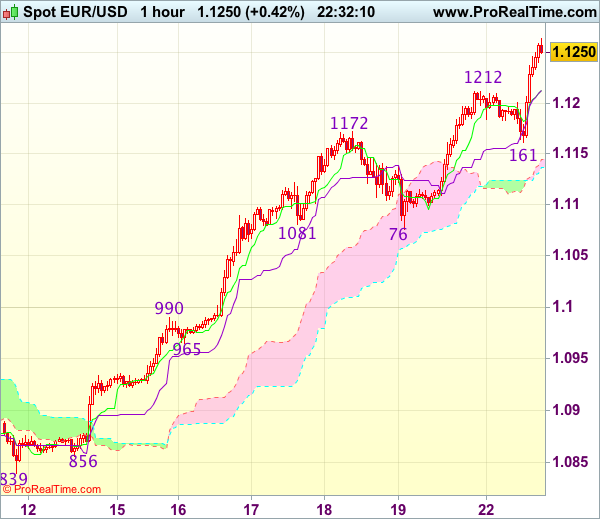
Trade Idea Wrap-up: EUR/USD – Stand aside
EUR/USD - 1.1244
Most recent candlesticks pattern : N/A
Trend : Up
Tenkan-Sen level : 1.1213
Kijun-Sen level : 1.1213
Ichimoku cloud top : 1.1145
Ichimoku cloud bottom : 1.1137
New strategy :
Stand aside
Position : -
Target : -
Stop : -
Although the single currency has surged again after brief pullback to 1.1161 and initial upside bias remains for recent upmove to extend gain to 1.1260-65, reckon upside would be limited to 1.1280-85 (61.8% projection of 1.0839-1.1172 measuring from 1.1076) and loss of near term upward momentum should limit upside to 1.1300-10, risk from there is seen for a retreat later.
In view of this, would not chase this rise here and would be prudent to stand aside in the meantime. Below the Kijun-Sen (now at 1.1206) would bring pullback towards said support at 1.1161 but break there is needed to signal top is formed, bring retracement of recent rise to 1.1125-30 first.