

Sample Category Title
Swiss Franc Trading Higher, Ahead Of Switzerland’s Trade Balance Data For April
For the 24 hours to 23:00 GMT, the USD declined 0% against the CHF and closed at 0.9739.
On macro front, Switzerland's total sight deposits rose to a level of CHF575.5 billion in the week ended 19 May, from a level of CHF575.0 billion in the previous week.
In the Asian session, at GMT0300, the pair is trading at 0.9725, with the USD trading 0.14% lower from yesterday's close.
The pair is expected to find support at 0.9728, and a fall through could take it to the next support level of 0.9716. The pair is expected to find its first resistance at 0.9758, and a rise through could take it to the next resistance level of 0.9776.
The currency pair is showing convergence with its 20 Hr moving average and trading below its 50 Hr moving average.

Canadian Dollar Trading Higher In The Morning Session
For the 24 hours to 23:00 GMT, the USD declined 0.06% against the CAD and closed at 1.3519.
In the Asian session, at GMT0300, the pair is trading at 1.3485, with the USD trading 0.25% lower from yesterday’s close.
The pair is expected to find support at 1.3505, and a fall through could take it to the next support level of 1.349. The pair is expected to find its first resistance at 1.3534, and a rise through could take it to the next resistance level of 1.3548.
With no major economic data in Canada today, investors will now await the Bank of Canada’s (BoC) interest rate decision, due tomorrow, to get further insights.
The currency pair is showing convergence with its 20 Hr moving average and trading below its 50 Hr moving average.

EUR/USD Daily Outlook
Daily Pivots: (S1) 1.1178; (P) 1.1220 (R1) 1.1280; More....
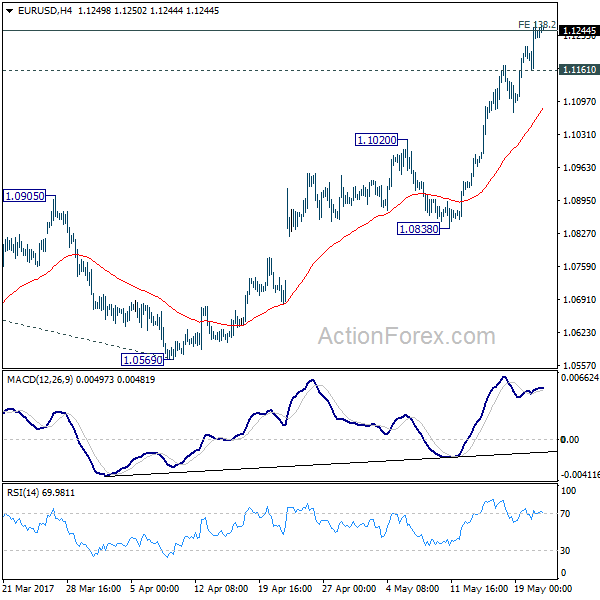
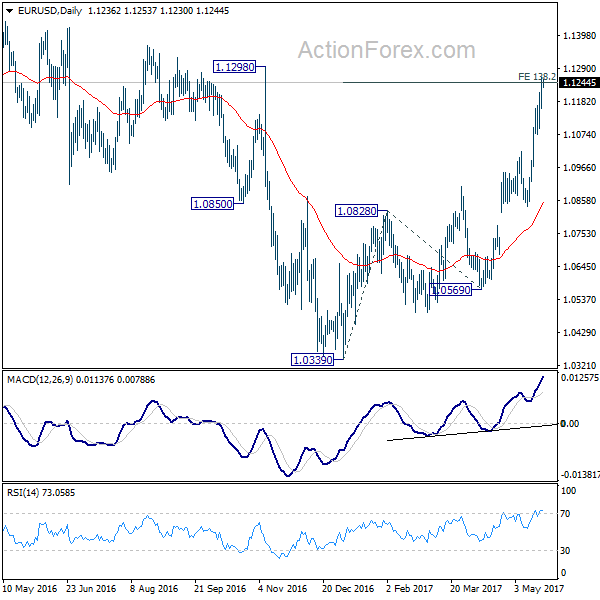
With 1.1161 minor support intact, intraday bias in EUR/USD remains on the upside for further rally. We stay cautious on strong resistance from 1.1245/98 (138.2% projection of 1.0339 to 1.0828 from 1.0569 at 1.1245) resistance zone to limit upside and bring reversal. However, decisive break of 1.1298 will carry larger bullish implication and target 1.1615 resistance next. On the downside, below 1.1161 minor support will turn bias neutral first.
In the bigger picture, the case for medium term reversal continues to build up with EUR/USD now far above 55 week EMA. Also, bullish convergence condition is seen in weekly MACD. Focus will now be on 1.1298 key resistance. Rejection from there will maintain medium term bearishness and would extend the whole down trend from 1.6039 (2008 high). However, firm break of 1.1298 will indicate reversal. In such case, further rally would be seen back to 1.2042 support turned resistance next.
USD/CHF Daily Outlook
Daily Pivots: (S1) 0.9694; (P) 0.9730; (R1) 0.9768; More.....
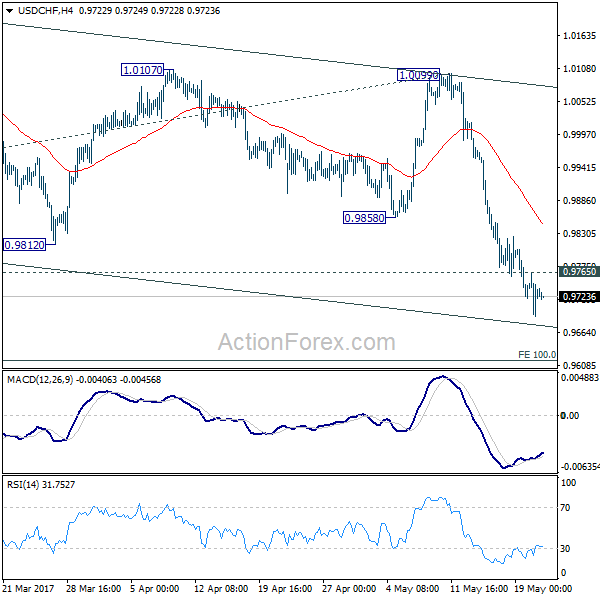
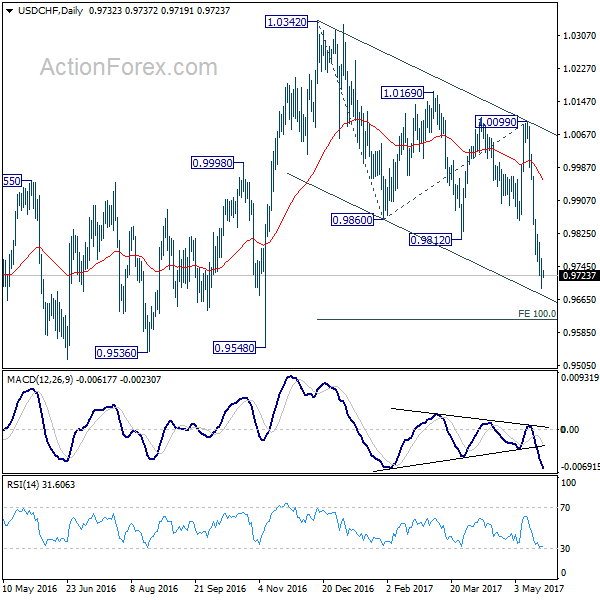
With 0.9765 minor resistance intact, intraday bias in USD/CHF stays on the downside. Current fall from 1.0342 should target 100% projection of 1.0342 to 0.9860 from 1.0099 at 0.9617. We'll start to look for bottoming signal again below there. On the upside, above 0.9765 minor resistance will turn intraday bias neutral again and bring consolidations first, before staging another fall.
In the bigger picture, USD/CHF is bounded in medium term range of 0.9443/1.0342 for the moment. Consolidative trading would likely continue and medium term outlook remains neutral. Break of 1.0342 key resistance is needed to confirm underlying bullish momentum in the pair. Meanwhile, downside attempts should be contained by 0.9443 key support level.
GBP/USD Daily Outlook
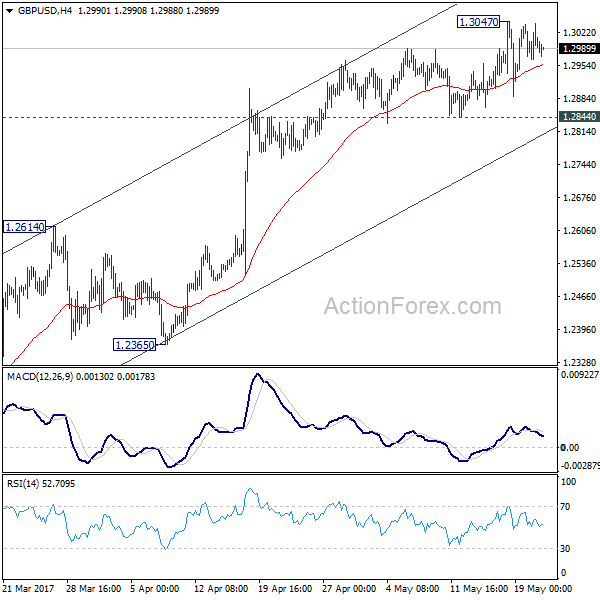
Daily Pivots: (S1) 1.2961; (P) 1.3002; (R1) 1.3039; More...
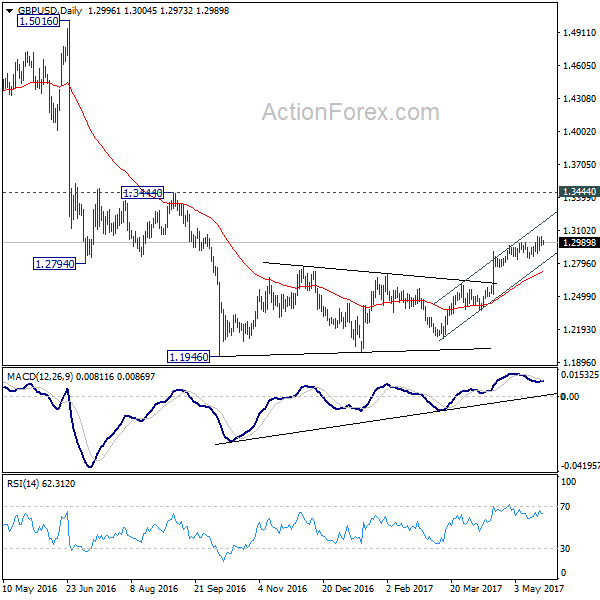
GBP/USD's consolidative pattern from 1.3047 is still extending and intraday bias remains neutral. As long as 1.2844 minor support holds, further rise remains mildly in favor. Nonetheless, as we are still viewing price actions from 1.1946 as a corrective move, we'd expect upside to be limited below 1.3444 resistance to bring near term reversal. On the downside, break of 1.2844 will indicate short term topping and turn bias back to the downside for 1.2614 resistance turned support first.
In the bigger picture, fall from 1.7190 is seen as part of the down trend from 2.1161. There are signs of reversal, like breaking of 55 week EMA, weekly MACD turned positive, and monthly MACD crossed above signal line. But still, break of 1.3444 resistance is need to confirm medium term bottoming. Otherwise, outlook will remains bearish for extend the down trend through 1.1946 low.
USD/JPY Daily Outlook
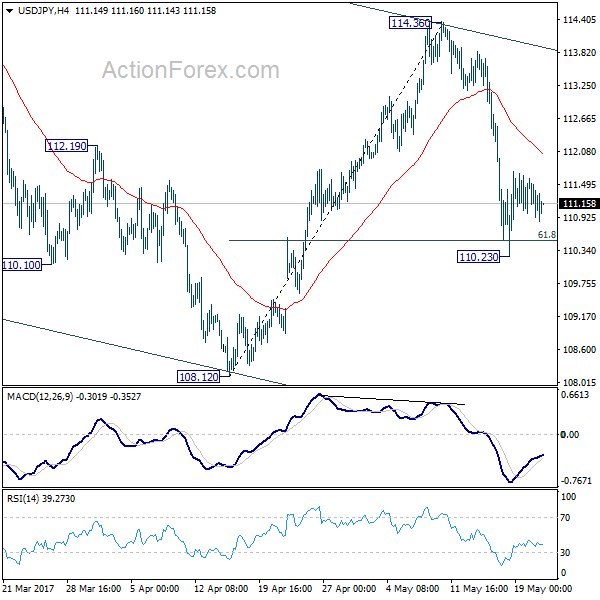
Daily Pivots: (S1) 110.94; (P) 111.27; (R1) 111.62; More...
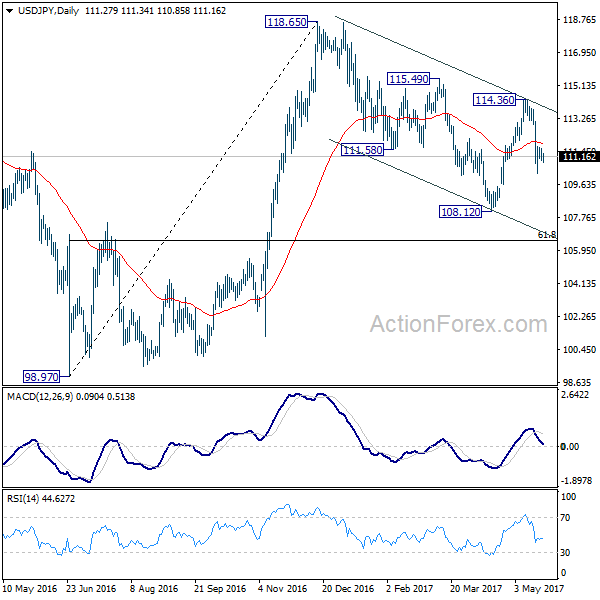
The consolidation from 110.23 is still in progress and intraday bias stays neutral in USD/JPY first. Overall, the development suggests that whole corrective decline from 118.65 is going to extend lower. Below 110.23 turn bias back to the downside and send USD/JPY through 108.12 low. In that case, we'll look for bottoming signal again at 61.8% retracement of 98.97 to 118.65 at 106.48.
In the bigger picture, price actions from 125.85 high are seen as a corrective pattern. It's uncertain whether it's completed yet. But in case of another fall, downside should be contained by 61.8% retracement of 75.56 to 125.85 at 94.77 to bring rebound. Overall, rise from 75.56 is still expected to resume later after the correction from 125.85 completes.
Daily Technical Outlook And Review: EUR/USD, GBP/USD, AUD/USD, USD/CAD, USD/CHF, DOW 30, GOLD
A note on lower timeframe confirming price action...
Waiting for lower timeframe confirmation is our main tool to confirm strength within higher timeframe zones, and has really been the key to our trading success. It takes a little time to understand the subtle nuances, however, as each trade is never the same, but once you master the rhythm so to speak, you will be saved from countless unnecessary losing trades. The following is a list of what we look for:
- A break/retest of supply or demand dependent on which way you're trading.
- A trendline break/retest.
- Buying/selling tails ... essentially we look for a cluster of very obvious spikes off of lower timeframe support and resistance levels within the higher timeframe zone.
- Candlestick patterns. We tend to only stick with pin bars and engulfing bars as these have proven to be the most effective.
We typically search for lower-timeframe confirmation between the M15 and H1 timeframes, since most of our higher-timeframe areas begin with the H4. Stops are usually placed 1-3 pips beyond confirming structures.
EUR/USD
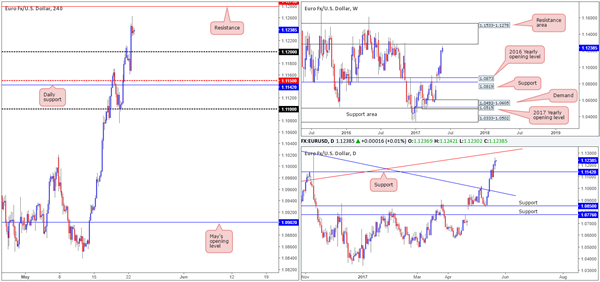
As anticipated, the single currency continued to extend higher during the course of Monday’s segment. Germany's Chancellor Angela Merkel argued that the "too weak" EUR was to blame for the contracting trade surplus in Germany, increasing the demand. The move has, as you can see, brought the H4 candles up to within striking distance of H4 resistance at 1.1279, followed closely by the 1.13 handle. Also of interest here is the fact that this H4 resistance denotes the underside of a weekly resistance area at 1.1278, and in addition to this, we also see a daily trendline resistance etched from the low 1.0711 intersecting nicely with the 1.13 region.
Our suggestions: Given the confluence surrounding the 1.13 neighborhood, our team has expressed interest in shorting the unit here. In the event that a reasonably sized H4 bearish candle forms around 1.13/1.1279 today, preferably a full-bodied candle, we would have little hesitation in selling here. Ideally, stops would be positioned above the candle’s wick and the initial take-profit target is to be set at the nearest H4 demand formed on approach.
Data points to consider: German IFO business climate survey at 9am, Eurozone manufacturing reports between 8-9am. Several FOMC members set to take the stage at different times today.
Levels to watch/live orders:
- Buys: Flat (stop loss: N/A).
- Sells: 1.13/1.1279 ([waiting for a reasonably sized H4 bear candle, preferably a full-bodied candle, to form before pulling the trigger is advised] stop loss: ideally beyond the candle’s wick).
GBP/USD
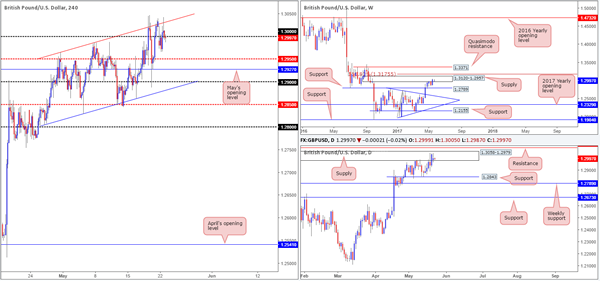
The GBP/USD, as expected, remains trading around the top edge of the ascending channel (low: 1.2804 high: 1.2965) despite closing above this structure on Friday. The large psychological level seen at 1.30, however, is proving to be a bit troublesome for the bears at the moment. With that being said though, a reasonable attempt to push lower from 1.30 was seen on Monday, forming a nice bearish rejection candle, but in this instance the bulls had other plans!
Ultimately, the desk believes that the odds of price breaking lower are high. This comes from seeing weekly price lurking within the walls of a supply base drawn from 1.3120-1.2957 and daily action continuing to trade around supply seen within the said weekly supply at 1.3058-1.2979.
Our suggestions: Similar to Monday’s report, 1.30 will be KEY in deciding direction. A rejection off this line will likely imply the bulls are going to attempt to break above the said higher-timeframe areas, and a violation of this number would likely lead to a move down to the H4 mid-level support at 1.2950, and possibly beyond. Personally, even with a solid rejection off 1.30 today, we would not be keen buyers in light of the bigger picture. Selling below 1.30 on the other hand could be a possibility if price were to retest the underside of this number and form a lower-timeframe sell signal (see the top of this report), targeting the H4 mid-level resistance at 1.2950 as an initial take-profit target.
Data points to consider: UK Inflation hearings at 10am. Several FOMC members set to take the stage at different times today.
Levels to watch/live orders:
- Buys: Flat (stop loss: N/A).
- Sells: Watch for H4 price to engulf 1.30 and then look to trade any retest seen thereafter ([waiting for a lower-timeframe sell signal to form following the retest is advised] stop loss: dependent on where one confirms this level).
AUD/USD
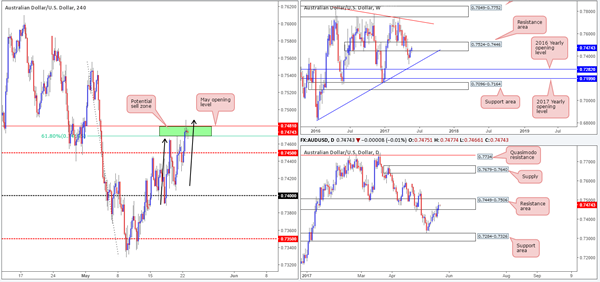
For those who read Monday’s report on the Aussie you may recall our desk highlighting the 0.7481/0.7470 neighborhood as a potential sell zone (green area). Our reasons for liking this area were due to the following:
Located within a weekly resistance area at 0.7524-0.7446.
Positioned within a daily resistance area (plotted within the said weekly zone) at 0.7449-0.7506.
May’s opening level at 0.7481 (denotes the top edge of the sell zone) was likely to produce a reaction.
And finally, the market’s overall trend is currently pointing south.
We also went on to say that traders should expect a fakeout through this zone. This is due to the H4 AB=CD approach taken from the low 0.7388 (see black arrows).
As you can see, this has played out as expected, and the bears have demonstrated some interest here following the fakeout. On the basis of our above notes, and the H4 selling wick formed on the fakeout, we are now short this market at 0.7475, with our stop tucked just above the wick at 0.7490. Ultimately, we’re looking for price to tap the H4 mid-level support at 0.7450 before taking partial profits and reducing risk.
Data points to consider: Several FOMC members set to take the stage at different times today.
Levels to watch/live orders:
- Buys: Flat (stop loss: N/A).
- Sells: 0.7475 ([pending order] stop loss: 0.7490).
USD/CAD
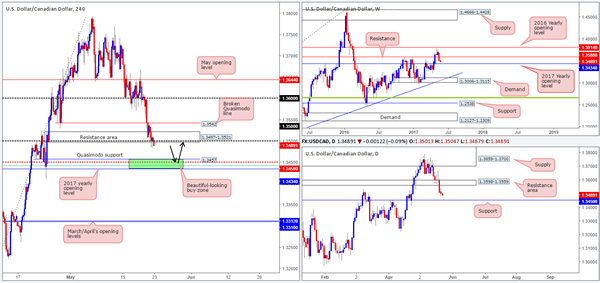
In recent sessions, we saw the USD/CAD respond to the H4 demand base coming in at 1.3497-1.3521. However, as we anticipated, this area did not produce much to get excited about. The reason for this, in our opinion, is due to the far more appealing H4 buy (green) zone formed between 1.3434/1.3457. Comprised of a H4 Quasimodo support at 1.3457, a H4 61.8% Fib support at 1.3441 taken from the low 1.3223 (green line), a H4 mid-level support at 1.3450 which also happens to represent daily support and the 2017 yearly opening level seen on the weekly chart at 1.3434.
Our suggestions: Given the confluence surrounding 1.3434/1.3457, our team has placed a pending buy order around the top edge of this zone at 1.3458. Our stop has been conservatively set just beyond the 24th April low at 1.3410 around 1.3408. Ultimately, the first take-profit zone is going to be somewhere nearby the 1.35 neighborhood.
Data points to consider: Several FOMC members set to take the stage at different times today.
Levels to watch/live orders:
- Buys: 1.3458 ([pending order] stop loss: 1.3408).
- Sells: Flat (stop loss: N/A).
USD/CHF
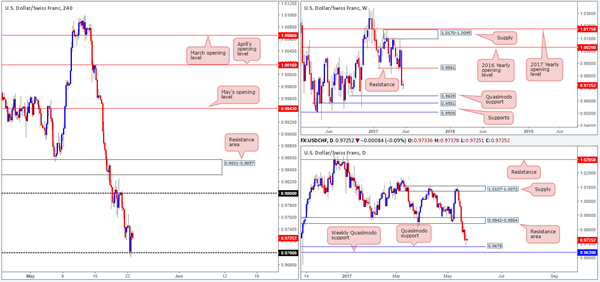
As can be seen from the H4 chart this morning, the 0.97 handle elbowed its way into the spotlight during yesterday’s segment and has held beautifully as a support. For all you faithful followers out there, you may recall us mentioning that between the 0.97 number and the daily Quasimodo support at 0.9678, this could be an ideal area to enter long from. However, we also emphasized the importance of waiting for an additional confirming H4 bullish rotation candle to form. This was simply to avoid being faked on a push down to the weekly Quasimodo support at 0.9639.
H4 bulls, as you can see, printed a healthy bullish candle off the 0.97 level yesterday. As much as we were tempted to buy the market following this, the candle was just too big for our liking. The stop loss, if one were to trade conservatively, would have been required to be set below the said daily Quasimodo! This severely impacts risk/reward as the take-profit target is the 0.98 barrier.
Our suggestions: Personally, we’re going to wait and see if H4 price can retest 0.9678/0.97 today. Only this time, we’d like to see it fake yesterday’s low and then print a H4 bullish candle, preferably a full-bodied candle. This would be an ideal signal to enter long from.
Data points to consider: Several FOMC members set to take the stage at different times today.
Levels to watch/live orders:
- Buys: 0.9678/0.97 region ([waiting for a reasonably sized H4 bull candle, preferably a full-bodied candle, to form before pulling the trigger is advised] stop loss: ideally beyond the candle’s tail).
- Sells: Flat (stop loss: N/A).
DOW 30
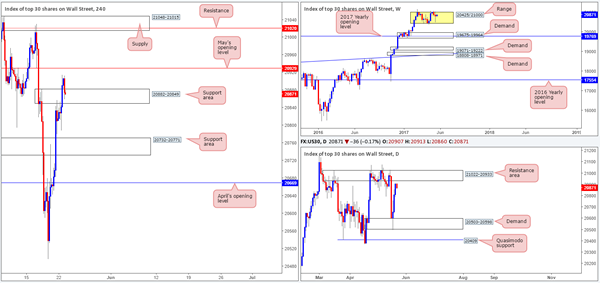
US equities continued to climb higher on Monday and resulted in price driving through a H4 supply zone coming in at 20882-20849, which, right now, is being retested as a support area. Should this zone hold firm, the next upside target from here is May’s opening base line at 20929.
Over on the weekly chart, the only salient point we can glean from this timeframe is the index appears to be chiseling out a consolidation around record highs of 21170 between 20425/21000. Moving down to the daily timeframe, however, we can see that the unit is trading within shouting distance of a resistance area pegged at 21022-20933.
Our suggestions: Buying this index from the current H4 support area is possible if you’re happy with taking full profits at May’s opening level. This is because this line is situated a few points beneath the underside of the daily resistance area mentioned above! For an entry to be permitted, we would advise waiting for a lower-timeframe confirming signal to form (see the top of this report) before making a play.
Data points to consider: Several FOMC members set to take the stage at different times today.
Levels to watch/live orders:
- Buys: 20882-20849 ([waiting for a lower-timeframe buy signal to form before pulling the trigger is advised] stop loss: dependent on where one confirms the area).
- Sells: Flat (stop loss: N/A).
GOLD
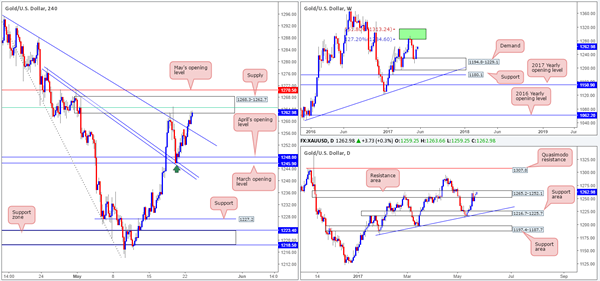
In recent trading, the price of gold advanced and is now seen teasing the underside of a H4 supply zone drawn from 1268.3-1262.7. Also noteworthy is our long position taken on Thursday from 1249.2 is very close to reaching its second and final take-profit target: the H4 61.8% Fib resistance at 1264.5 (green line) extended from the high 1295.4 seen planted within the said H4 supply.
As for potential setups going forward, we’re at somewhat of a technical crossroads at the moment. On the weekly chart, the yellow metal aggressively recovered from demand at 1194.8-1229.1 during last week’s segment. The move broke a four-week bearish phase, and could potentially drag this market back up to the two weekly Fibonacci extensions 161.8/127.2% at 1313.7/1285.2 taken from the low 1188.1 (green zone) sometime this week.
Before the bulls can form an extension, nevertheless, offers placed around the daily resistance area drawn from 1265.2-1252.1 will need to be consumed. A decisive (daily) close beyond this zone would likely confirm further buying up to not only the 1313.7/1285.2 area seen on the weekly chart, but also quite possibly the daily Quasimodo resistance level seen at 1307.8.
Our suggestions: Yes, shorts could be a possibility from within the current H4 supply, but we’re really not happy with this given the position of price on the weekly chart right now. So, with that in mind, we’re going to continue running with our current position until the take profit is achieved, and then assess structure going into tomorrow’s open.
Levels to watch/live orders:
- Buys: 1249.2 ([live] stop loss: breakeven).
- Sells: Flat (stop loss: N/A).
AUD/USD Daily Outlook
Daily Pivots: (S1) 0.7440; (P) 0.7464; (R1) 0.7498; More...
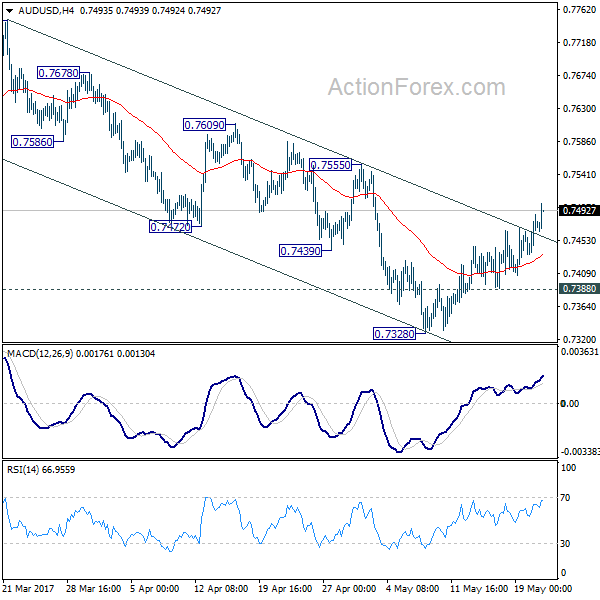
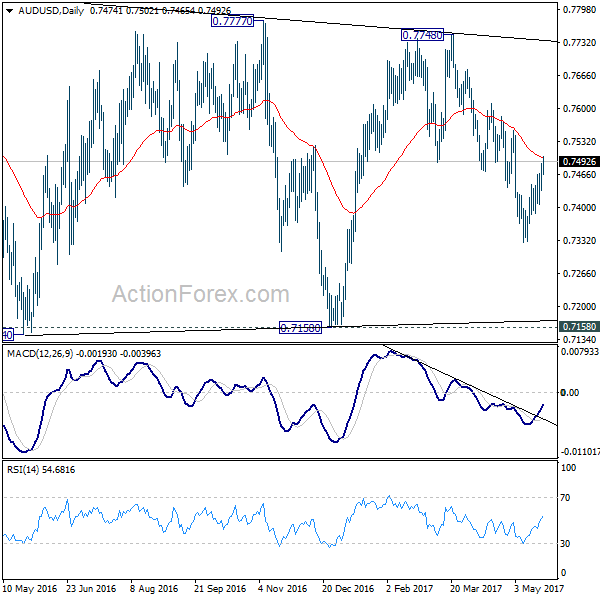
AUD/USD's recovery from 0.7328 extends higher today. The break of near term falling channel is seen as the first sign of near term reversal. But it's staying below 0.7555 resistance so far and intraday bias remains neutral first. On the downside, below 0.7388 minor support will turn bias to the downside for 0.7328. Break there will extend the decline from 0.7748 to 0.7144/7158 support zone. However, firm break of 0.7555 will argue that fall from 0.7748 is completed and turn bias back to the upside.
In the bigger picture, we're still treating price actions from 0.6826 low as a corrective pattern. And, as long as 38.2% retracement of 0.9504 to 0.6826 at 0.7849 holds, long term down trend from 1.1079 is expected to resume sooner or later. Break of 0.6826 low will target 0.6008 key support level. However, firm break of 0.7849 will indicate that rise from 0.6826 is developing into a medium term rebound, rather than a sideway pattern. In such case, stronger rise should be seen to 55 month EMA (now at 0.8115) and above.
European Open Briefing: The British Pound Came Under Pressure
Global Markets:
- Asian stock markets: Nikkei down 0.10 %, Shanghai Composite lost 0.15 %, Hang Seng rose 0.15 %, ASX 200 fell 0.05 %
- Commodities: Gold at $1262 (+0.05 %), Silver at $17.16 (-0.15 %), WTI Oil at $50.90 (-0.40 %), Brent Oil at $53.65 (-0.40 %)
- Rates: US 10-year yield at 2.24, UK 10-year yield at 1.08, German 10-year yield at 0.40
News & Data
- Australia ANZ Roy Morgan Consumer Confidence 15-May: 110.5 (prev 109.4)
- Japan Nikkei Manufacturing PMI May P: 52.0 (prev 52.7)
- PBoC Fixes USDCNY Reference Rate At 6.8661 (prev fix 6.8849 prev close 6.8892)
- Pound sags vs yen after Manchester blast, euro at six-month highs – RTRS
Markets Update:
The British Pound came under pressure following an explosion at a concert in Manchester (UK). 19 people have died, and over 50 were injured. The police are currently treating this as terrorist incident. GBP/USD fell from 1.30 to 1.2973.
Risk appetite decreased in the stock markets as well, with most Asian indices down on the day. Gold was in demand in Asia, but is still struggling with resistance ahead of $1265. Should it break above it, a rally towards $1290 seems likely.
The Euro remains strong. Comments from German Chancellor Merkel that the currency was too weak boosted it additionally. While the charts are suggesting overbought conditions, EUR/USD is not showing any signs of weakness yet. Resistance now lies at 1.13, while support is seen at 1.1220 and 1.1180.
The Australian and New Zealand Dollar are bid again as commodities are recovering. AUD/USD broke above 0.7470 resistance and NZD/USD rose above 0.70. The next key levels to watch are 0.7450 and 0.7040/50 respectively.
Upcoming Events:
- 07:00 BST – Swiss Trade Balance
- 07:00 BST – German GDP
- 08:00 BST – French Manufacturing PMI
- 08:00 BST – French Services PMI
- 08:30 BST – German Manufacturing PMI
- 08:30 BST – German Services PMI
- 09:00 BST – Euro Zone Manufacturing PMI
- 09:00 BST – Euro Zone Services PMI
- 09:00 BST – German IFO Business Expectations
- 09:00 BST – German IFO Current Assessment
- 09:00 BST – German IFO Business Climate
- 10:00 BST – UK Inflation Report Hearings
- 14:45 BTS – US Services PMI
- 14:45 BST – US Manufacturing PMI
- 15:00 BST – US New Home Sales
- 15:00 BST – US Richmond Manufacturing Index
- 20:15 BST – FOMC Member Kashkari speaks
- 22:00 BST – FOMC Member Harker speaks
NZDUSD Gets Ready To Challenge Trend Line
Key Points:
- NZDUSD reaches key reversal point and declining trend line.
- 0.70 handle represents a critical inflexion point.
- Watch for a pullback towards the 69 cent handle in the coming days.
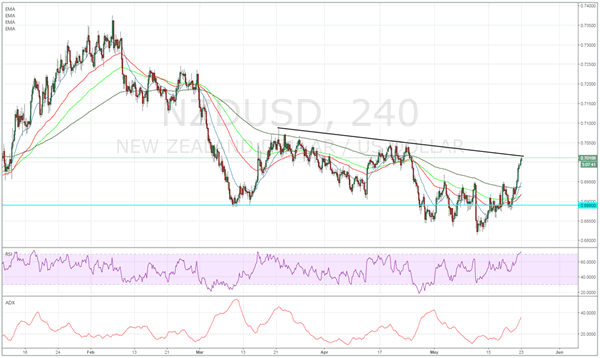
The Kiwi Dollar has faced some sharp swings over the past few weeks as the pair has reacted to a range of changing U.S. Dollar sentiment. Subsequently, the pair has largely rallied over the last trading session and finally reached the declining trend line. However, it remains to be seen if the pair can retain its current level and potentially rise above the key 70 cent handle.
In fact, taking stock of the 4-hour chart is particularly illuminating and actually demonstrates the strong rally that price action has undertaken over the past few days. However, the technical indicators are suggesting that momentum might actually be stalling for the bullish pair. In particular, the RSI Oscillator has now ticked into overbought territory which suggests that a pullback might be on the cards in the coming days.
In addition, price action is facing some stiff resistance around the 70 cent handle, which has been a key reversal point in the past. The level has been seen as a psychological zone of resistance and the market will be watching the handle closely for any signs of a change in trend. In fact, given the historical validity of the declining trend line, any further gains will in all probability be limited.
Fundamentally, the Kiwi Dollar is also potentially over valued given that inflationary pressures and GDP gains are still within the recovery phase. Additionally, the only economic indicator largely supporting strong growth is the global dairy trade numbers, which have continued to improve over the past few months. Additionally, the U.S. economic data continues to point to tightening within the labour market which is likely to lead to monetary policy action from the Fed in the coming months. Subsequently, there are plenty of reasons to suggest that we might see additional moves to the short side in the coming weeks.
Ultimately, the most likely scenario for the pair in the coming session is an abject failure to breach the declining trend line and then a steady depreciation against the greenback. This is further supported by the various oscillators’ overbought status and the need for a period of moderation or a pullback to relieve the pressure. Subsequently, keep a close watch for a failure around the 70 cent handle and then a steady move lower back towards support around the 0.6900 mark.