
Sample Category Title
USD/CAD Daily Outlook
Daily Pivots: (S1) 1.3477; (P) 1.3508; (R1) 1.3533; More....
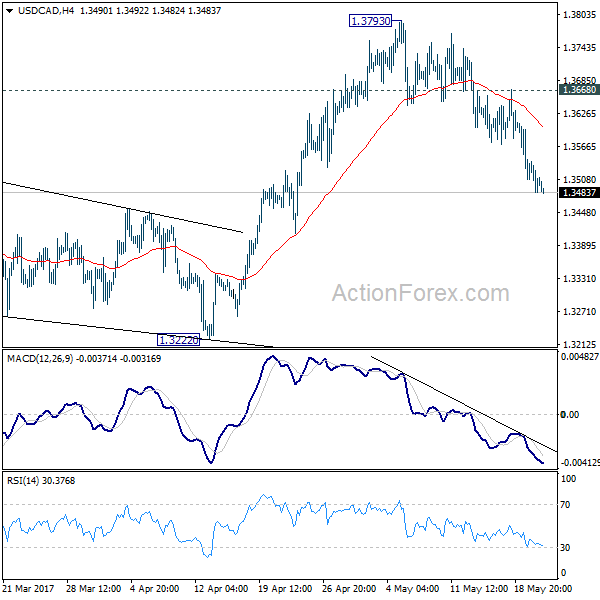
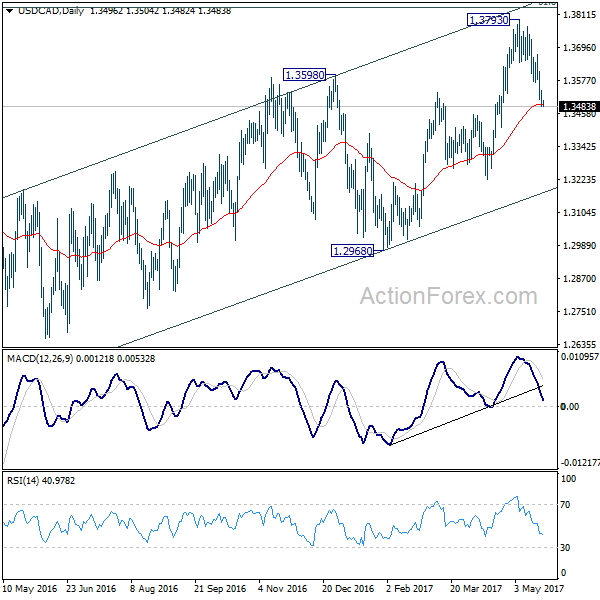
Intraday bias in USD/CAD remains on the downside as fall from 1.3793 continues. Current decline should target 1.3222 support next. As noted before, corrective rally from 1.2460 could have finished ahead of 1.3838 fibonacci level. Break of 1.3222 will affirm this case and target 1.2968 key support level for confirmation. On the upside, break of 1.3668 minor resistance is needed to indicate completion of the fall from 1.3793. Otherwise, outlook will remain cautiously bearish in case of recovery.
In the bigger picture, price actions from 1.4689 medium term top are seen as a correction pattern. The first leg has completed at 1.2460. Rise from 1.2460 is seen as the second leg and would end at around 61.8% retracement of 1.4689 to 1.2460 at 1.3838. Break of 1.3222 should indicate the start of the third leg while further break of 1.2968 should confirm. Nonetheless, sustained trading above 1.3838 would pave the way to retest 1.4689 high.
Is Silver’s Rally Running Short On Momentum?
Key Points:
- Silver prices could be about to hit a near-term peak.
- Overarching technical bias remains rather bearish despite the recent rally.
- We could sink back below the 17.000 handle during the subsequent decline.
Silver prices have been recovering strongly over the past few sessions and have now reached the near-term peak that was forecasted for the metal a short while ago. However, given the fact that Trump is on the loose internationally and calls for his impeachment remain fresh, we may have to delve back into the technical forecast to ensure a revision of our expectations is not warranted just yet.
Firstly, it is relatively clear on the below chart that buying pressure is about to face some notable technical hurdles in the coming days, despite the apparent underlying shift in sentiment for silver. In particular, the presence of the 38.2% Fibonacci level and a historical zone of resistance around the 17.224 handle will be giving the bulls pause for thought which is in line with our earlier forecasts
However, something that wasn't clear last time was just where the 100 day EMA would be situated and what role it might play in capping upside potential. At the movement, we actually have a little more room to move before this average begins to seriously exert some selling pressure on the metal. As a result, we may see some more bullish momentum moving ahead that could mean gains extend up to around the 17.400 handle.
Nevertheless, despite the apparent need for an upward revision of our near-term high, we still expect to see the metal enter a bearish phase within a week or so. This is largely due to the overall configuration of the EMA's which remains highly bearish. However, the stochastics also shouldn't be ignored as they are deeply overbought as a result of the past few sessions of strong buying activity.
From a more fundamental perspective, Trump's international engagements and the fallout from the Russian investigation are generally expected to generate some negative market sentiment this week. This will almost certainly buoy silver prices which would be in line with the upwards revision of our near-term high but it might also work against the subsequently forecasted slide. As a result, keep half an eye on the news feed as Trump's antics may slow silver potential decline to a crawl.
Ultimately, whilst we might see a bit more buying coming down the line, we are still expecting to hit a near-term peak for silver prices in the coming week or so. Additionally, we expect to see the metal move into decline fairly shortly after – even with Trump posing a bit of threat to this forecast.
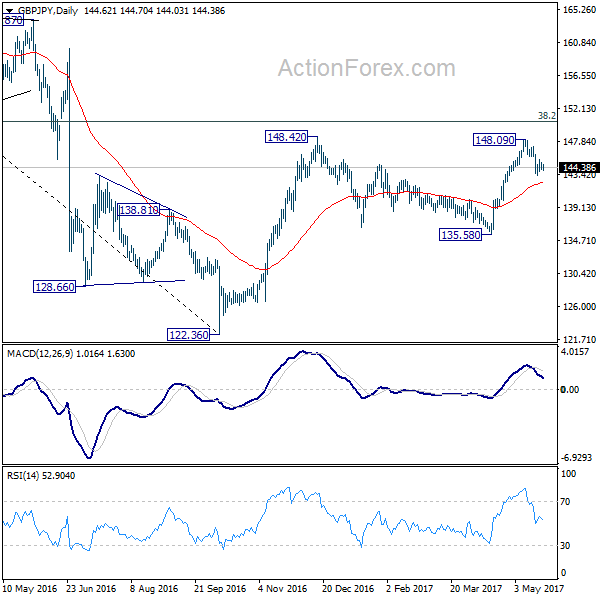
GBP/JPY Daily Outlook
Daily Pivots: (S1) 144.17; (P) 144.62; (R1) 145.13; More....
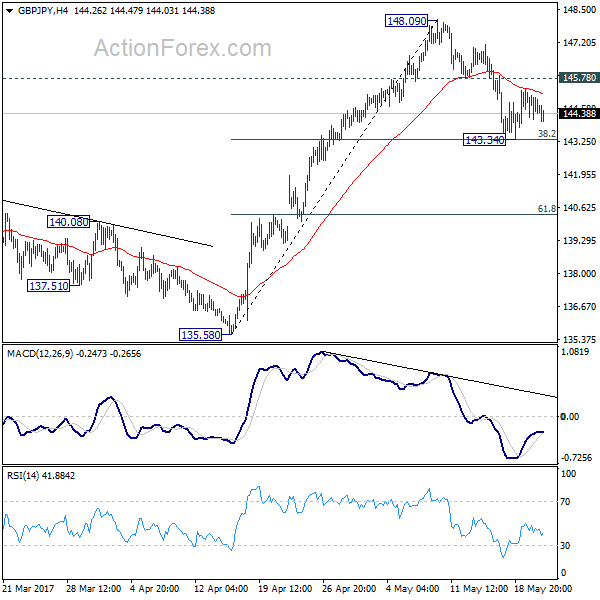
Intraday bias in GBP/JPY remains neutral for the moment. The corrective pattern from 148.09 short term top could extend. On the upside, above 145.78 will turn bias back to the upside for retesting 148.09 first. Meanwhile, break of 143.34 will extend the pull back from 148.09 to 61.8% retracement at 140.35. Overall, we'd still expect the rise from 122.36 to resume after pull back from 148.09 completes. Break of 148.09 will target 150.42 long term fibonacci level first.
In the bigger picture, based on current momentum, rise from 122.36 bottom should be developing into a medium term move. Break of 38.2% retracement of 195.86 to 122.36 at 150.42 should pave the way to 61.8% retracement at 167.78. This will now be the favored case as long as 135.58 support holds.
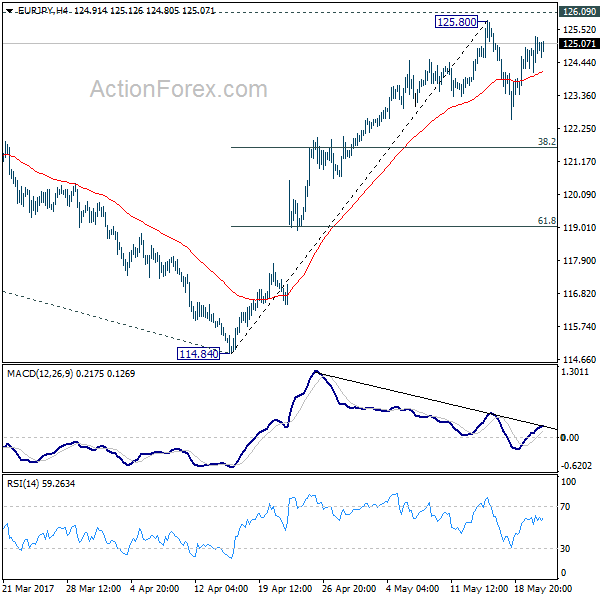
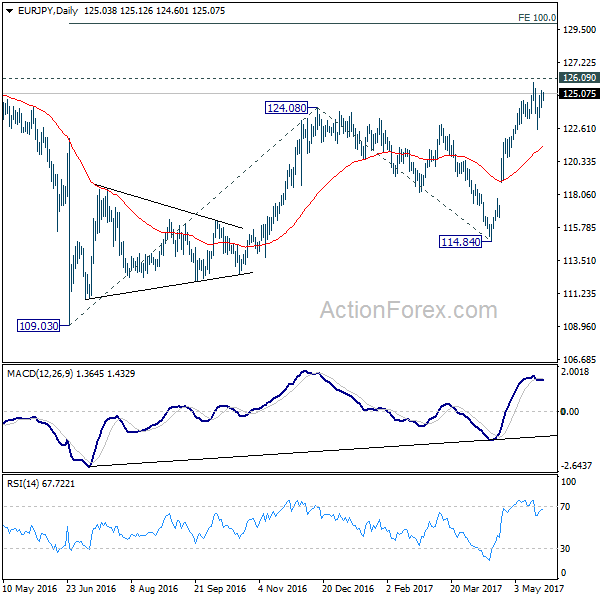
EUR/JPY Daily Outlook
Daily Pivots: (S1) 124.35; (P) 124.82; (R1) 125.53; More...
EUR/JPY's consolidation from 125.80 is still in progress and intraday bias remains neutral. Another fall could be seen but downside should be contained by 38.2% retracement of 114.84 to 125.80 at 121.61 to bring rise resumption. We're staying mildly bullish in the cross. And, break of 126.09 key resistance will extend the whole rebound from 109.03 to 100% projection of 109.03 to 124.08 from 114.84 at 129.89.
In the bigger picture, focus is back on 126.09 support turned resistance. Decisive break there will confirm completion of the down trend from 149.76. And in such case, rise from 109.20 is at the same degree and should target 141.04 resistance and above. Meanwhile, rejection from 126.09 and break of 114.84 will extend the fall from 149.76 through 109.20 low.
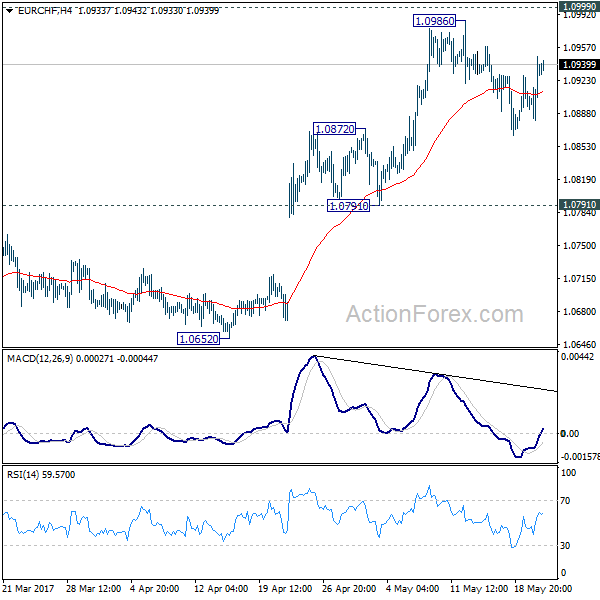
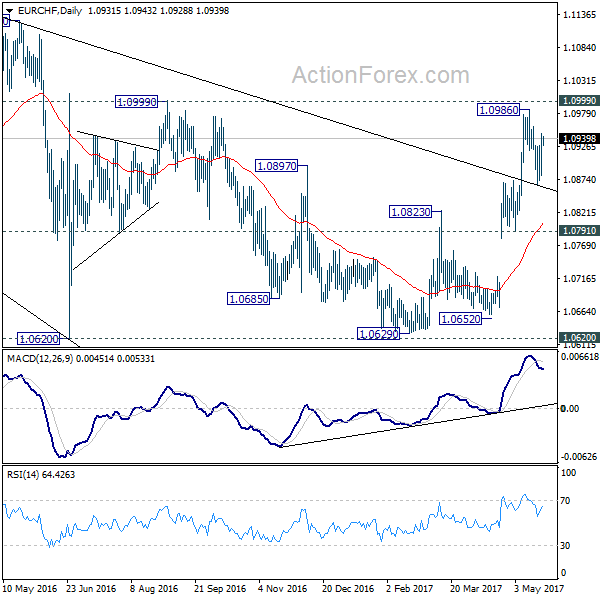
EUR/CHF Daily Outlook
Daily Pivots: (S1) 1.0897; (P) 1.0922; (R1) 1.0964; More...
EUR/CHF is staying in the consolidation pattern from 1.0986 and intraday bias remains neutral for the moment. In case of another fall, downside is expected to be contained by 1.0791/0872 support zone to bring rise resumption. As noted before, the consolidative pattern from 1.1198 should be completed. Firm break of 1.0999 resistance will pave the way for a retest on 1.1198 high.
In the bigger picture, the price actions from 1.1198 are seen as a corrective move. Current strong rebound is raising the chance that it's completed after defending 38.2% retracement of 0.9771 to 1.1198 at 1.0653. Decisive break of 1.0999 resistance will target a test on 1.1198 high. For now, this will be the preferred case as long as 1.0791 support holds.
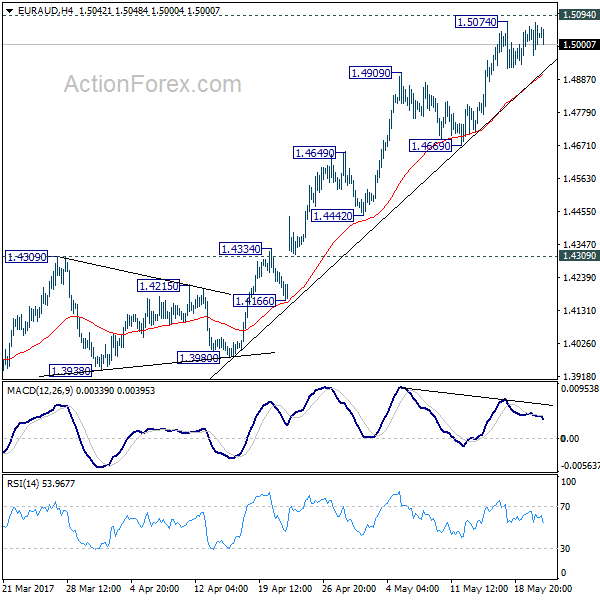
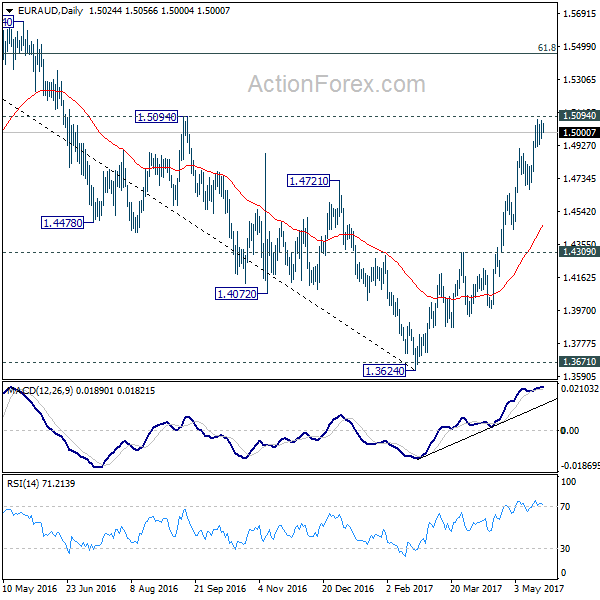
EUR/AUD Daily Outlook
Daily Pivots: (S1) 1.4974; (P) 1.5023; (R1) 1.5080; More...
Consolidation from 1.5074 is still in progress and intraday bias remains neutral first. In case of another fall, downside of retreat should be contained above 1.4669 support and bring rise resumption. We're holding on to the bullish view that the medium term trend has reversed. Break of 1.5094 resistance will extend the rally from 1.3624 to next medium term fibonacci level at 1.5455. However, considering bearish divergence condition in 4 hour MACD, break of 1.4669 will confirm short term topping and bring deeper pull back, possibly to 55 day EMA (now at 1.4469).
In the bigger picture, price actions from 1.6587 medium term top are viewed as a corrective pattern. Such correction should be completed at 1.3624 after defending 1.3671 key support. Rise from 1.3642 is now expected to target 61.8% retracement of 1.6587 to 1.3624 at 1.5455 and above. In any case, outlook will now stay cautiously bullish as long as 1.4309 resistance turned support holds.
Daily Technical Analysis: EUR/USD Bullish Price Action Challenges Rising Wedge At 1.1250
Currency pair EUR/USD
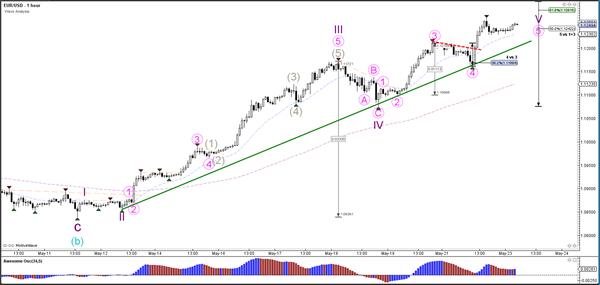
The EUR/USD is showing a bullish continuation within wave 5 (purple), which could complete a wave C (blue). The angle of the support (green) and resistance (red) trend lines are showing a rising wedge reversal chart pattern. However, considering the bullish price action the EUR/USD could test 1.13 first and break either way: above resistance or below support. A break above 1.13 invalidates the wave 2 (green) correction.
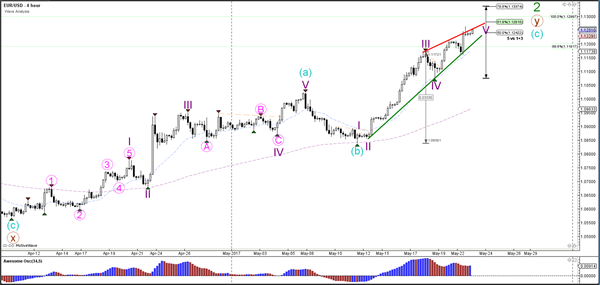
The EUR/USD bounced at the 38.2% Fibonacci level of wave 4 (pink) and then broke above the resistance trend line (dotted red). A new 5 wave (pink) formation is most likely occurring within wave 5 (purple).
Currency pair USD/JPY
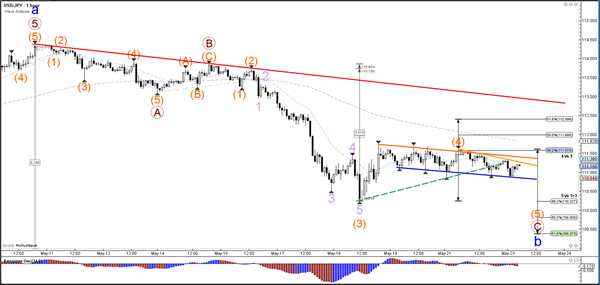
The USD/JPY bearish break below the support trend line (dotted green) could indicate a bearish continuation towards the next Fibonacci level which is the 78.6% at 109.50. However, a break below the support line connecting the candle bottoms might be needed before price can move down significantly.
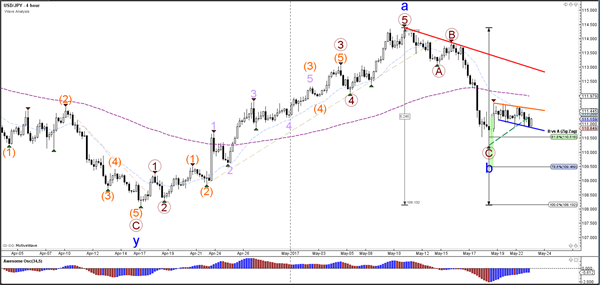
The USD/JPY is building a potential wave 4 (orange) correction and a wave 5 (orange) continuation before completing wave C (brown).
Currency pair GBP/USD
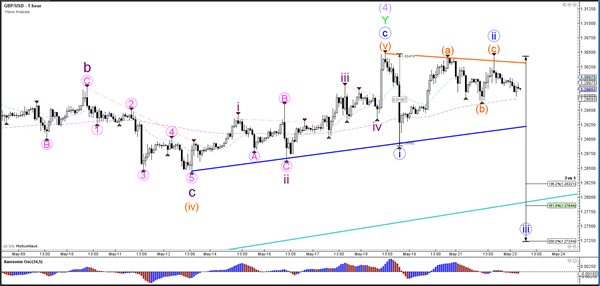
The GBP/USD could be building a wave 1-2 (grey) but this depends on whether price is able to break below the channel support (green/blue). A break above the orange trend line indicates the invalidation of wave 2 and the potential for an uptrend continuation.
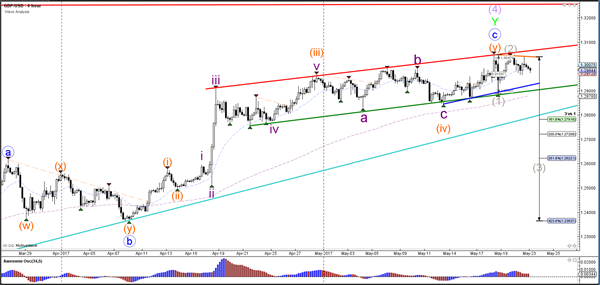
The GBP/USD break above the resistance (orange) invalidates wave 2 (grey) whereas a break below the support (blue) could indicate a bearish breakout.
EUR/GBP Daily Outlook
Daily Pivots: (S1) 0.8612; (P) 0.8631; (R1) 0.8664; More...
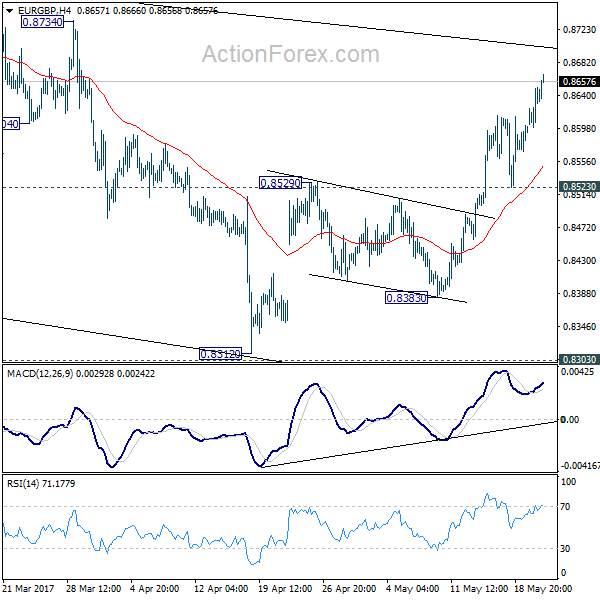
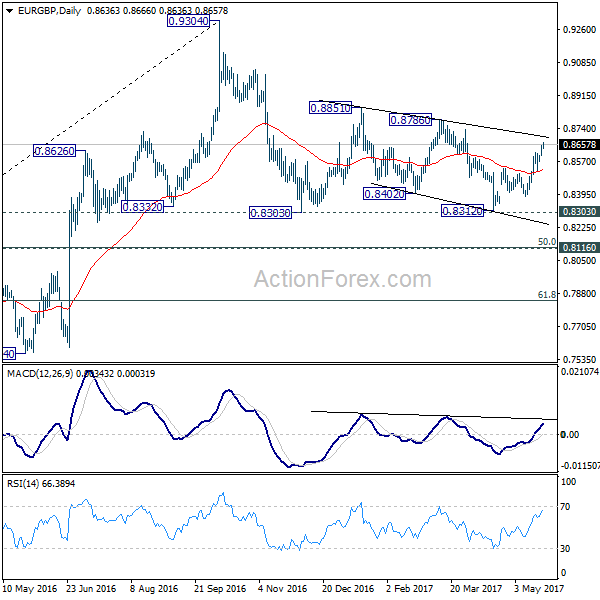
Intraday bias in EUR/GBP remains on the upside as current rise from 0.8132 extends to as high as 0.8660 so far. Further rally is expected to be seen to 0.8786 resistance next. Note again that price actions 0.9304 are viewed as a medium term corrective pattern that is extending. Break of 0.8786 would now pave the way to retest 0.9304 high. For now, break of 0.8523 support is needed to indicate completion of the rebound form 0.8312. Otherwise, near term outlook will remain mildly bullish in case of retreat.
In the bigger picture, price actions from 0.9304 are viewed as a medium term corrective pattern. In case of deeper fall, we'd expect strong support from 0.8116 cluster support (50% retracement of 0.6935 to 0.9304 at 0.8120) to contain downside. Rise from 0.6935 (2015 low) will resume at a later stage to 0.9799 (2008 high). However, sustained break of 0.8116 could bring deeper decline to next key support level at 0.7564 before the correction completes.
Euro Maintains Gain Against Dollar and British Pound, PMIs and IFO Watched
Euro stays firm against Dollar and Sterling in Asian session but is losing some momentum against commodity currencies. Strength of the common currency is built upon optimism on Eurozone's economic outlook. And Euro will look into a string of data for further strength today, including PMIs and German IFO business climate. Meanwhile, Sterling stays as the weakest major currency as markets UK election and Brexit negotiation with EU are both approaching. Dollar, on the hand, stays soft too and didn't follow the rebound in stocks and yield. US President Donald Trump's first budget will also be a major focus today but it's unlikely to be inspirational.
Pounds stays weak as May halt election campaign
Sterling continues to trade as the weakest major currency for the week as markets are already starting to get cautious ahead of the election next month. Prime Minister Theresa May halted her campaign after suspected terrorist attack in Manchester. May was criticized as having a U-turn on one of her key policies, a now called "dementia tax" on elderly people. It was originally widely expected that the Conservatives would have a landslide victory in the election on June 8. But latest poll, which showed only a lead of 9 pts over Labour, suggested that the margin was not as strong as it's thought to be. And that would potentially give May a much weaker hand in Brexit negotiation.
EU is "ready and well-prepared" for Brexit talk
EU's Brexit negotiator Michel Barnier said that the EU has agreed on its Brexit negotiating stance and he hoped that the first round of talk would begin in the week of June 19. Barnier said that "from the day the UK decided to leave, the EU has gone through an intense preparatory process," and, "we are ready and well-prepared." The "negotiating directives" were agreed unanimously at a meeting of 27 EU ministers yesterday. Here are some highlights of the 18 page document:
- UK will leave EU on March 30, 2019 unless EU27 agrees unanimously to extend the talks
- Status of EU citizens is the top priority and the Brexit agreement must ensure "effective, enforceable, non-discriminatory and comprehensive guarantees" for the 4.7m people and their families affected.
- EU and UK have to agree on a "single financial settlement" covering EU budget and UK contributions to European Investment Bank and other common funds. But there was no amount mentioned.
- On the island of Ireland, EU would hope to avoid a hard border while respective its legal order.
- EU emphasizes future UK governments can be held to account for failing to uphold the Brexit agreement. And EU proposes "an institutional structure to ensure an effective enforcement of the commitments" and refers to the importance of the European Court of Justice.
Euro supported by Merkel's comments
Speaking in Berlin, German Chancellor Angela Merkel noted that the Euro is too weak, evidenced by the country's strong trade surplus. She attributed the single currency's weakness to ECB's ultra--accommodative monetary policy. Separately, Bundesbank President Jens Weidmann suggested that domestic price pressures were currently 'muted', but reiterated his forecast that they would increase "with the continued economic upswing and the gradual decline in unemployment in the Eurozone".
Dallas Fed Kaplan reiterated "gradual and patient" rate path
In US, Dallas Fed President Robert Kaplan retained his view over a "gradual and patient" path on rates. While describing the recent dataflow as "disappointing", he reaffirmed that it is "an appropriate baseline case for the near-term path of the federal funds rate". On inflation, Kaplan noted that the "progress toward our 2% inflation goal has been slow and, at times, uneven". Yet, he noted patience is needed "in critically assessing upcoming data to evaluate whether we are continuing to make progress in reaching our inflation objective".
Fed Governor Lael Brainard said that policy makers "aren't seeing much progress on core inflation". Instead, "if anything the last few months we've seen some stalling out of core inflation." And, she urged Fed officials to look deeper into the employment market and see how different demographic groups are doing. She emphasized that "understanding these barriers and efforts to address them is vital in assessing maximum employment as well as potential growth." While Brainard didn't touch on monetary policy directly, her comments suggested that she's not totally convinced by a more hawkish path.
Looking head...
US President Donald Trump's administration will deliver the first full budget today. According to the budget documents from the White House, the US economy is projected to grow at 3% in 2021 and continue at that pace afterwards. That's a pace never seen since 2005 and is significantly higher than the Congressional Budget Office's 1.9% potential. US will also release PMI manufacturing and services, as well as new home sales.
Earlier in European session, Eurozone, Germany and France PMI manufacturing and services will be featured. Germany will also release Q1 GDP final and Ifo business climate. Swiss will release trade balance while UK will release CBI reported sales.
EUR/GBP Daily Outlook
Daily Pivots: (S1) 0.8612; (P) 0.8631; (R1) 0.8664; More...
Intraday bias in EUR/GBP remains on the upside as current rise from 0.8132 extends to as high as 0.8660 so far. Further rally is expected to be seen to 0.8786 resistance next. Note again that price actions 0.9304 are viewed as a medium term corrective pattern that is extending. Break of 0.8786 would now pave the way to retest 0.9304 high. For now, break of 0.8523 support is needed to indicate completion of the rebound form 0.8312. Otherwise, near term outlook will remain mildly bullish in case of retreat.
In the bigger picture, price actions from 0.9304 are viewed as a medium term corrective pattern. In case of deeper fall, we'd expect strong support from 0.8116 cluster support (50% retracement of 0.6935 to 0.9304 at 0.8120) to contain downside. Rise from 0.6935 (2015 low) will resume at a later stage to 0.9799 (2008 high). However, sustained break of 0.8116 could bring deeper decline to next key support level at 0.7564 before the correction completes.
Economic Indicators Update
| GMT | Ccy | Events | Actual | Forecast | Previous | Revised |
|---|---|---|---|---|---|---|
| 04:30 | JPY | All Industry Activity Index M/M Mar | -0.50% | 0.70% | ||
| 06:00 | CHF | Trade Balance (CHF) Apr | 3.10B | |||
| 06:00 | EUR | German GDP Q/Q Q1 F | 0.60% | 0.60% | ||
| 07:00 | EUR | France Manufacturing PMI May P | 55.2 | 55.1 | ||
| 07:00 | EUR | France Services PMI May P | 56.7 | 56.7 | ||
| 07:30 | EUR | Germany Manufacturing PMI May P | 58 | 58.2 | ||
| 07:30 | EUR | Germany Services PMI May P | 55.5 | 55.4 | ||
| 08:00 | EUR | Eurozone Manufacturing PMI May P | 56.5 | 56.7 | ||
| 08:00 | EUR | Eurozone Services PMI May P | 56.4 | 56.4 | ||
| 08:00 | EUR | German IFO - Business Climate May | 113.1 | 112.9 | ||
| 08:00 | EUR | German IFO - Expectations May | 105.4 | 105.2 | ||
| 08:00 | EUR | German IFO - Current Assessment May | 121 | 121.1 | ||
| 08:30 | GBP | Public Sector Net Borrowing (GBP) Apr | 8.0b | 4.4b | ||
| 10:00 | GBP | CBI Realized Sales May | 10 | 38 | ||
| 12:30 | CAD | Wholesale Sales M/M Mar | 1.00% | -0.20% | ||
| 13:45 | USD | US Manufacturing PMI May P | 53.1 | 52.8 | ||
| 13:45 | USD | US Services PMI May P | 53.2 | 53.1 | ||
| 14:00 | USD | New Home Sales Apr | 610K | 621K |
Market Morning Briefing: Dollar Index (96.89) Remains Extremely Weak
STOCKS
Dow (20894.83, +0.43%) and Dax (12619.46, -0.15%) are almost stable trading slightly lower than the previous close. Dow is testing decent support just below current levels and could either bounce back or continue to trade sideways in the near term while Dax has come off from important resistance and could have some more room on the downside before any reversal is seen. A fall towards 12400-12300 is possible in the near term in Dax while Dow may try to move up towards resistance at 21000-21200. Both looks bearish for the medium term.
Shanghai (3072.46, -0.10%) is in a perfect channel visible on the 3-day and weekly candle charts. The channel support has held well and could help Shanghai bounce back towards 3200 in the next couple of weeks. While support near 3000 holds, we could negate bearishness for the near term.
Nikkei (19653.96, -0.12%) looks bearish while resistance at 20000 holds. If not an immediate fall, the index could trade sideways within the 19400-20000 region before moving down.
Nifty (9438.25, +0.11%) is holding well above 9350 support but at the same time is not able to move above 9530 just now. Some more sideways consolidation is possible for the next couple of sessions before some directional clarity is visible.
COMMODITIES
While Dollar Index (96.78) is well on its course towards 96 with no sign of strength yet, Bullion has strengthened against Dollar yesterday. Gold (1262) and Silver (17.16) are trading well above their crucial support at 1247 and 16.93 and trading at their respective highs. But we would like to be on selling side while gold is trading below 1280 and silver below 17.50 levels due to their short term overbought condition.
Copper (2.58) has found resistance at 2.62 levels. Only above 2.62, higher resistances of 2.68-72 can come into consideration. In the medium term 2.55 are going to be a strong support now but a close below that could open up 2.44-35 levels as well.
We have been tracking the resistance of 54.20 in Brent and 51.20 in WTI for the last few days and they have held, driving the energy pack down as expected. Both Brent (53.60) and WTI (5.73) have already lost approx 20 pips in the opening hour and the chances of more sideways movement in the range of 52.50-51.20 for Brent and 49.17-51.20 for WTI are stronger now. Both Brent and WTI are overbought in short term time frame thus chances of a fall towards their respective supports can’t be ruled out.
FOREX
Dollar Index (96.89) remains extremely weak as it gets closer to our target/support of 96.50-00 which is expected to be met this week. On the other hand, a strong Euro (1.1249) is not far away from our initial target/resistance of 1.1300. If any profit booking is seen in Euro either near 1.1300-30 or near the higher long term resistance of 1.1400-50, then corresponding short covering can be expected in Dollar near 96.50 or 96.00. Better to watch them as a pair at this point.
Dollar Yen (111.18) shows no intention to make any significant move as it continues to trade sideways in the range of 110-112 which may extend for the rest of the week.
Pound (1.2984) is in an interesting position as the trend remains up but the upward momentum is still lacking. The chances of a sudden sharp rise to 1.3200 can’t be ruled out while the probability of further sideways consolidation in the range of 1.2850-1.3050 remains in consideration too. Wait for clarity but no bearish scenario can be considered while above 1.2850.
Aussie (0.7494) is testing the resistance of 0.7500 above which the downside target of 0.7300 will be negated and higher upside targets of 0.7550-0.7600 may open up.
Dollar Rupee (64.55) broke below 64.50 but the intraday bounce from the interim support of 64.42 and closing above 64.50 raises suspicion about the bearish scenario. Any bounce to 64.67-72 may rob all clarity and bidirectional possibilities may be revived. We prefer to wait for clear signals.
INTEREST RATES
The US yields could remain near current levels in the coming sessions with a preference of upside in the near term. Overall yields look bullish for the medium term.
The UK-US (-1.16%) has come off slightly but the previous resistance could now act as an important support which could possibly indicate an upside for the yield spread in the medium term. If that happens, we could turn bullish for Pound in the longer run.
The German-US 10 Yr (-1.85%) is headed towards resistance near -1.75% and while it moves up, Euro could test 1.13 or higher in the medium term.