
Sample Category Title
Trade Idea : EUR/USD – Stand aside
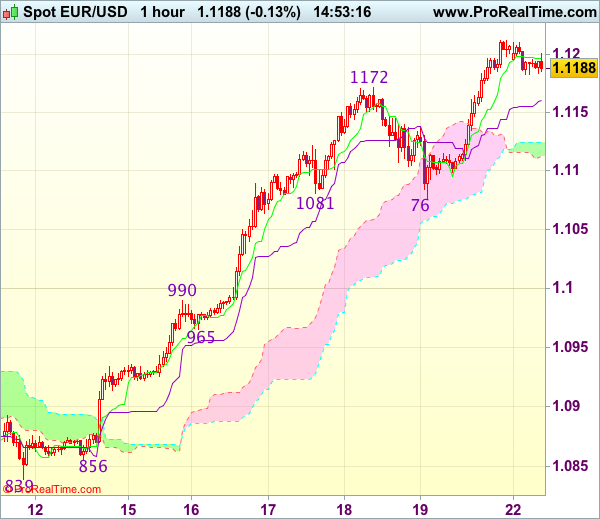
EUR/USD - 1.1186
Most recent candlesticks pattern : N/A
Trend : Up
Tenkan-Sen level : 1.1195
Kijun-Sen level : 1.1161
Ichimoku cloud top : 1.1124
Ichimoku cloud bottom : 1.1113
New strategy :
Stand aside
Position : -
Target : -
Stop : -
As the single currency has eased after rising to 1.1212 last week, suggesting consolidation below this level would be seen and pullback to the Kijun-Sen (now at 1.1161) is likely, below there would bring minor correction towards the upper Kumo (now at 1.1124, however, reckon downside would be limited to 1.1100 and bring another rise later, above said resistance would extend gain to 1.1240-45 (50% projection of 1.0839-1.1172 measuring from 1.1076) but loss of momentum should limit upside and reckon 1.1280-85 (61.8% projection) would hold from here, risk from there is seen for a retreat later.
In view of this, would not chase this rise here and would be prudent to stand aside in the meantime. Below the the lower Kumo (now at 1.1113) would suggest top is possibly formed, risk correction to 1.1076 support first, however, break there is needed to add credence to this view.
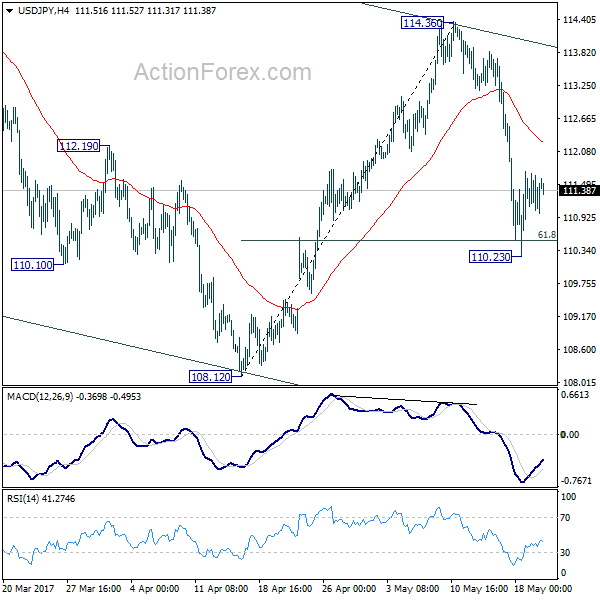
Trade Idea : USD/JPY – Sell at 112.05
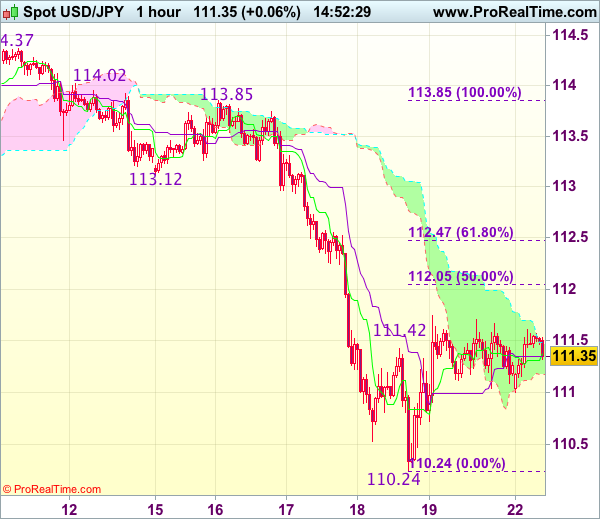
USD/JPY - 111.39
Most recent candlesticks pattern : N/A
Trend : Near term down
Tenkan-Sen level : 111.38
Kijun-Sen level : 111.35
Ichimoku cloud top : 111.49
Ichimoku cloud bottom : 111.18
Original strategy :
Sell at 112.05, Target: 110.85, Stop: 112.40
Position : -
Target : -
Stop : -
New strategy :
Sell at 112.05, Target: 110.85, Stop: 112.40
Position : -
Target : -
Stop : -
As the greenback found support at 110.24 last week and rebounded, retaining our view that further consolidation above this level would be seen and corrective bounce to 112.00-05 (50% Fibonacci retracement of 113.85-110.24) cannot be ruled out, however, reckon upside would be limited and bring another decline later, below 110.70-75 would suggest the rebound from 110.24 has ended, bring retest of this level first.
In view of this, would be prudent to sell dollar on further subsequent recovery as 112.05-10 should limit upside and bring another decline. Above 112.35-40 would defer and signal low is formed instead, risk a stronger rebound to 112.65-70.
EUR/USD Daily Outlook
Daily Pivots: (S1) 1.1130; (P) 1.1171 (R1) 1.1246; More....
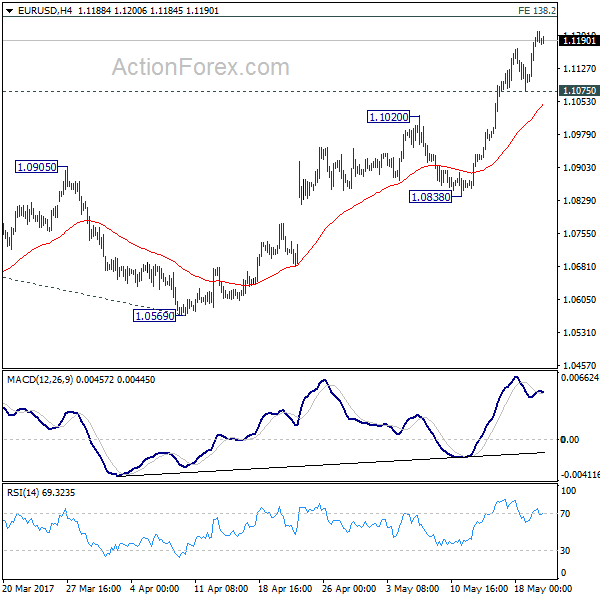
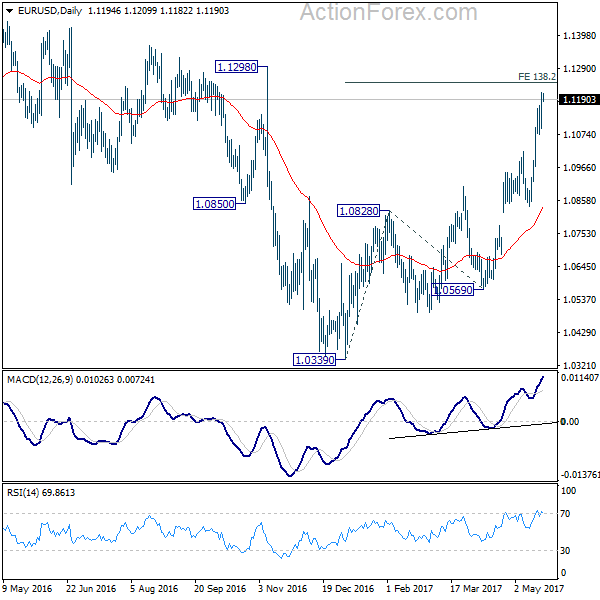
Intraday bias in EUR/USD remains on the upside for the moment. Current rise would target 138.2% projection of 1.0339 to 1.0828 from 1.0569 at 1.1245, which is close to 1.1298 key resistance. We'll stay cautious on strong resistance from 1.1245/98 to limit upside and bring reversal. Break of 1.1075 minor support will turn bias back to the downside for 1.0838 support. However, sustained break of 1.1298 will carry larger bullish implications.
In the bigger picture, the case for medium term reversal continues to build up with EUR/USD now far above 55 week EMA. Also, bullish convergence condition is seen in weekly MACD. Focus will now be on 1.1298 key resistance. Rejection from there will maintain medium term bearishness and would extend the whole down trend from 1.6039 (2008 high). However, firm break of 1.1298 will indicate reversal. In such case, further rally would be seen back to 1.2042 support turned resistance next.
GBP/USD Daily Outlook
Daily Pivots: (S1) 1.2952; (P) 1.2995; (R1) 1.3075; More...
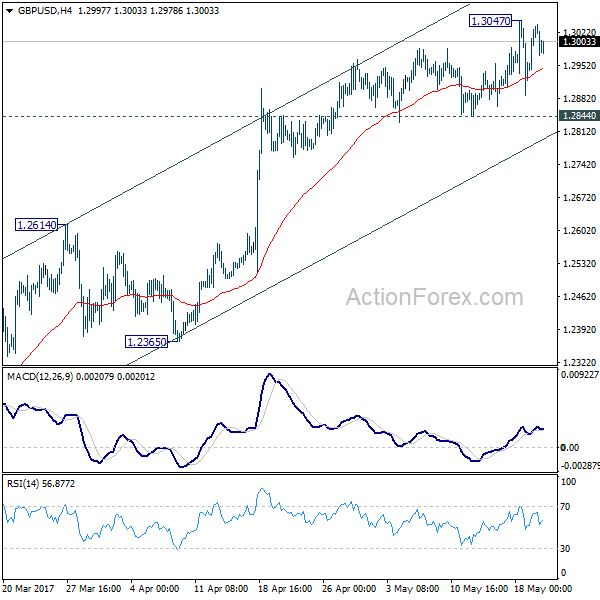
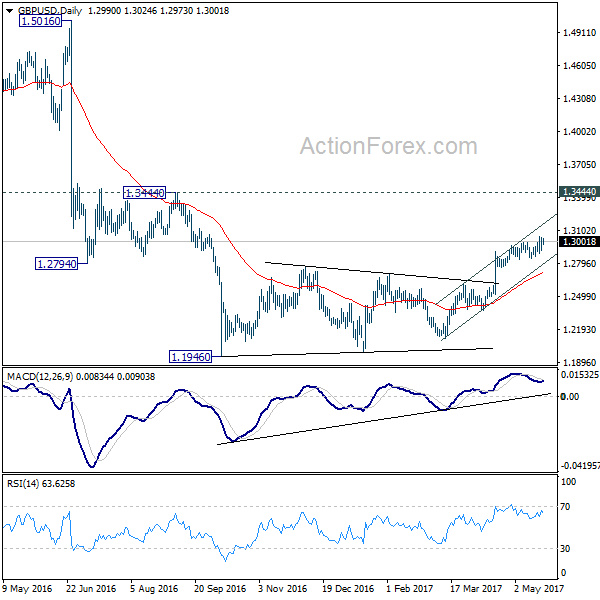
Intraday bias in GBP/USD remains neutral for the moment. with 1.2844 minor support intact, further rise is mildly in favor. However, as we are still viewing price actions from 1.1946 as a corrective move, we'd expect upside to be limited below 1.3444 resistance to bring near term reversal. On the downside, break of 1.2844 will indicate short term topping and turn bias back to the downside for 1.2614 resistance turned support first.
In the bigger picture, fall from 1.7190 is seen as part of the down trend from 2.1161. There are signs of reversal, like breaking of 55 week EMA, weekly MACD turned positive, and monthly MACD crossed above signal line. But still, break of 1.3444 resistance is need to confirm medium term bottoming. Otherwise, outlook will remains bearish for extend the down trend through 1.1946 low.
USD/CHF Daily Outlook
Daily Pivots: (S1) 0.9694; (P) 0.9749; (R1) 0.9778; More.....
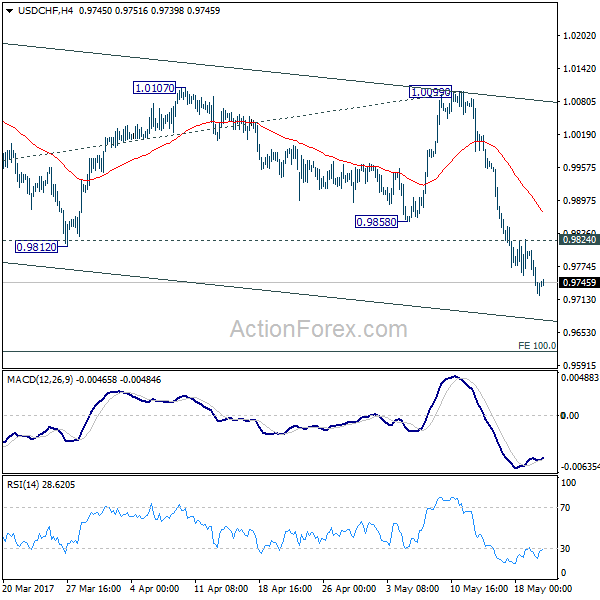
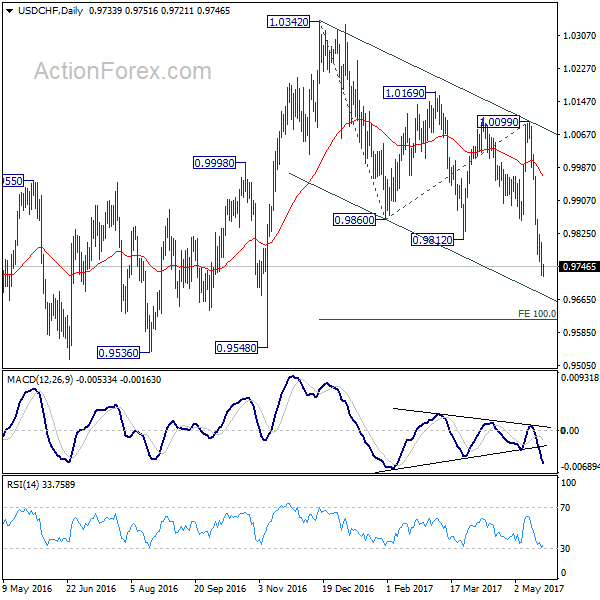
Intraday bias in USD/CHF remains on the downside for the moment. Current fall from 1.0342 should now target 100% projection of 1.0342 to 0.9860 from 1.0099 at 0.9617. We'll start to look for bottoming signal again below there. On the upside, above 0.9824 minor resistance will turn intraday bias neutral again and bring consolidations first, before staging another fall.
In the bigger picture, USD/CHF is bounded in medium term range of 0.9443/1.0342 for the moment. Consolidative trading would likely continue and medium term outlook remains neutral. Break of 1.0342 key resistance is needed to confirm underlying bullish momentum in the pair. Meanwhile, downside attempts should be contained by 0.9443 key support level.
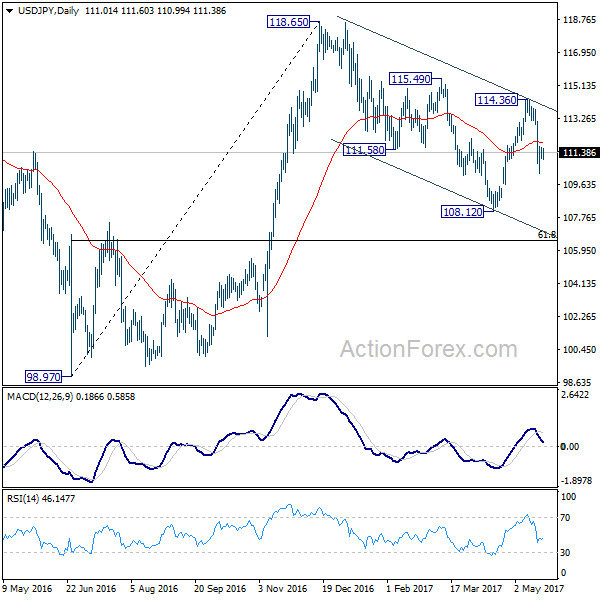
USD/JPY Daily Outlook
Daily Pivots: (S1) 110.95; (P) 111.32; (R1) 111.62; More...
Intraday bias in USD/JPY remains neutral for consolidation above 110.23 temporary low. Overall, the development suggests that whole corrective decline from 118.65 is going to extend lower. Below 110.23 turn bias back to the downside and send USD/JPY through 108.12 low. In that case, we'll look for bottoming signal again at 61.8% retracement of 98.97 to 118.65 at 106.48.
In the bigger picture, price actions from 125.85 high are seen as a corrective pattern. It's uncertain whether it's completed yet. But in case of another fall, downside should be contained by 61.8% retracement of 75.56 to 125.85 at 94.77 to bring rebound. Overall, rise from 75.56 is still expected to resume later after the correction from 125.85 completes.
Daily Technical Analysis: EURUSD, GBPUSD, USDJPY, USDCHF
EURUSD
The EURUSD had a bullish momentum last week topped at 1.1211. The bias is bullish in nearest term testing 1.1300 – 1.1350 area. Immediate support is seen around 1.1175 – 1.1150. A clear break below that area could trigger further bearish pullback testing 1.1080 but overall I remain bullish and any downside pullback should be seen as a good opportunity to buy. On the upside, a clear break and daily close above 1.1350 could trigger further bullish pressure testing 1.1600 region this week (weekly EMA 200).
GBPUSD
The GBPUSD had a bullish momentum last week topped at 1.3047. Price gaps lower earlier today opened at 1.2997 and hit 1.2973. The bias is neutral in nearest term but overall I remain bullish. Immediate support is seen around 1.2970. A clear break below that area could trigger further bearish pressure testing 1.2945 and the trend line support (see my H1 chart below) located around 1.2900 region which is a good place to buy with a tight stop loss. On the upside, a clear break and daily close above 1.3050 would expose 1.3185 region.
USDJPY
The USDJPY had a bearish momentum last week bottomed at 110.23 but closed higher at 111.25 and hit 111.60 earlier today in Asian session. The bias is bullish in nearest term testing 112.00 and the trend line resistance as you can see on my H4 chart below, which is a good place to sell targeting 108.13 area with a tight stop loss above the trend line resistance. Immediate support is seen around 111.00. A clear break below that area could lead price to neutral zone in nearest term testing 110.50 or lower. On the upside, a clear break back above the trend line resistance would activate my wait and see mode as direction would become unclear.
USDCHF
The USDCHF had a bearish momentum last week bottomed at 0.9725. The bias is bearish in nearest term testing 0.9650 area as a part of the false breakout bearish scenario as you can see on my H4 chart below. Immediate resistance is seen around 0.9750. A clear break above that area could lead price to neutral zone in nearest term testing 0.9813/55 resistance area which is a good place to sell with a tight stop loss.
USD/CAD Daily Outlook
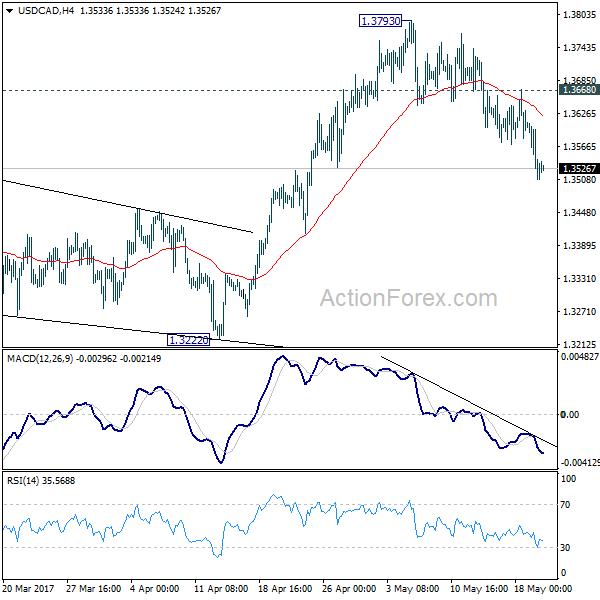
Daily Pivots: (S1) 1.3474; (P) 1.3542; (R1) 1.3577; More....
Intraday bias in USD/CAD remains on the downside for the moment. Rise from 1.2968 should be completed at 1.3793, ahead of 1.3838 key fibonacci resistance. Deeper fall would be seen for 1.3222 support next. Also, the corrective rally from 1.2460 could have finished too, ahead of 1.3838 fibonacci level. Break of 1.3222 will affirm this case and target 1.2968 key support level for confirmation. On the upside, break of 1.3668 minor resistance is needed to indicate completion of the fall from 1.3793. Otherwise, outlook will remain cautiously bearish in case of recovery.
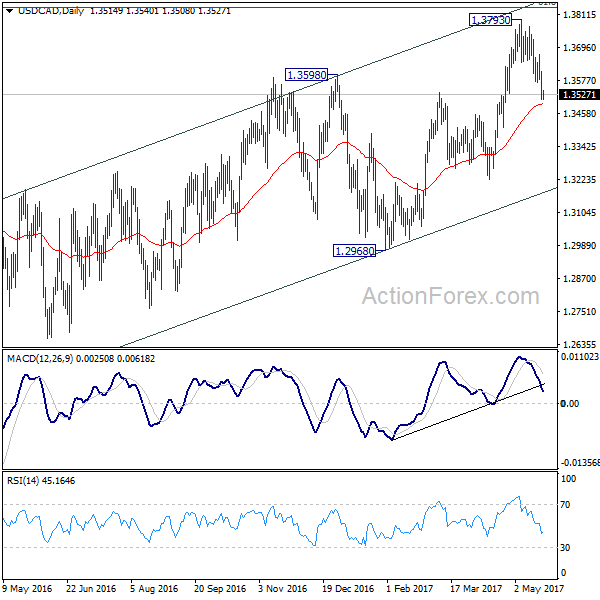
In the bigger picture, price actions from 1.4689 medium term top are seen as a correction pattern. The first leg has completed at 1.2460. Rise from 1.2460 is seen as the second leg and would end at around 61.8% retracement of 1.4689 to 1.2460 at 1.3838. Break of 1.3222 should indicate the start of the third leg while further break of 1.2968 should confirm. Nonetheless, sustained trading above 1.3838 would pave the way to retest 1.4689 high.
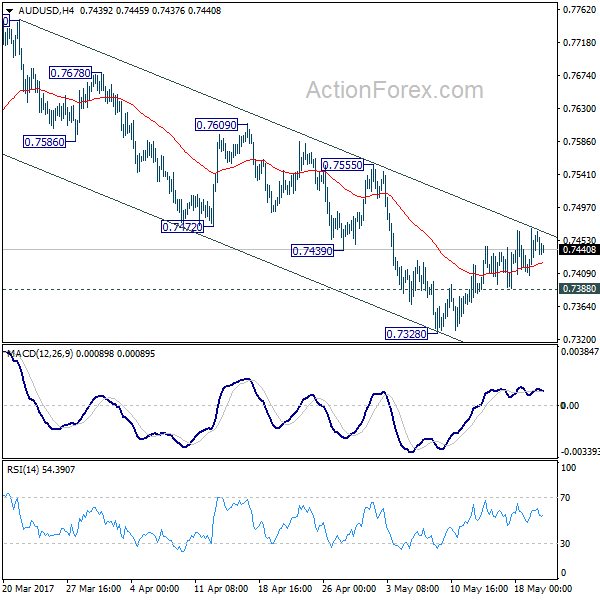
AUD/USD Daily Outlook
Daily Pivots: (S1) 0.7417; (P) 0.7443; (R1) 0.7480; More...
AUD/USD's corrective recovery is still in progress and could extend higher. But upside is expected to be limited below 0.7555 resistance to bring fall resumption. Below 0.7388 minor support will turn bias to the downside. Break of 0.7328 will extend the decline from 0.7748 to 0.7144/7158 support zone. However, firm break of 0.7555 will argue that fall from 0.7748 is completed and turn bias back to the upside.
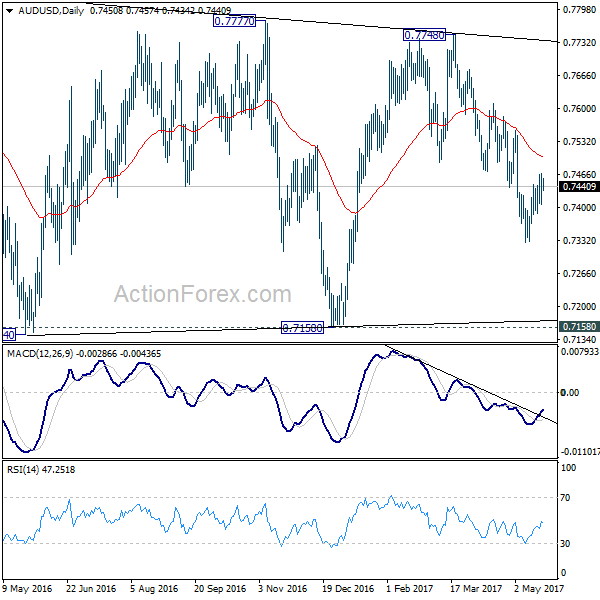
In the bigger picture, we're still treating price actions from 0.6826 low as a corrective pattern. And, as long as 38.2% retracement of 0.9504 to 0.6826 at 0.7849 holds, long term down trend from 1.1079 is expected to resume sooner or later. Break of 0.6826 low will target 0.6008 key support level. However, firm break of 0.7849 will indicate that rise from 0.6826 is developing into a medium term rebound, rather than a sideway pattern. In such case, stronger rise should be seen to 55 month EMA (now at 0.8115) and above.
Dollar Recovers With Weak Momentum in Quiet Session
Dollar recovers broadly in a quiet Asian session today but momentum is very week so far. The economic calendar is rather light today and trading might remain subdued. Nonetheless, volatility could build up again as the week goes with some key events scheduled. The list includes US budget proposal, FOMC minutes, BoC rate decision, Eurozone sentiment data, OPEC meeting, etc. While for now, some consolidations could be seen, the greenback will more likely extend recent fall ahead, than not. In other markets, Gold retreats mildly but is staying solid above 1250 handle. WTI crude oil extends recent rise and is on course for 53.76/55.24 resistance zone.
Trump to deliver first budget proposal on Tuesday
US President Donald Trump will deliver his first major budget proposal on Tuesday. It's reported there is a proposal for balancing the federal budget within 10 year through steep cuts to safety net and discretionary spending. One of the key point to note is possibly the massive USD 800b cut over 10 years on Medicaid. The Congressional Budget Office has estimated that this could impact healthcare benefits of 10 million low-income Americans over the decade. And, the inclusion of Medicaid cut is seen as significant by some analysts because there are clear rejections on it from a number of Senate Republicans. While the House has voted to cut Medicaid funding, Senate Republicans have already indicated that they would start from scratch. Such inclusion could further enlarge the division between Trump and some Republicans at the time of political turmoil in Washington.
CEBR: Brexit could cost GBP 36b annually
In UK, an analysis conducted by the Centre of Economic Business Research (CEBR) for the Open Britain organization noted that the lost of EU single market in services after Brexit could cost UK companies up to GBP 36b annually. The reported pointed out that "about a third of the losses from single market withdrawal result from lost businesses in financial services." The impact could be particularly negative on financial services, telecommunications and transport. It elaborated that "the free movement of services can also be seen to directly touch on immigration if people are coming to the UK to offer their services as self-employed individuals or if firms exercise their mobility rights while wanting to carry their workforce over." And, the overall impact on UK's GDP would be between 1.4% and 2.0%, equivalent to GBP 25b to GBP 36b a year.
OPEC to agree on production cut extension
Oil prices continue to surge ahead of an OPEC meeting this Thursday. Saudi Arabia's energy minister Khalid al-Falih said "everybody I talked to... expressed support and enthusiasm to join in this direction" of extending the product cut agreement by a further nine months til next March. And, he's optimistic that continuation with the same level of cuts, plus eventually adding one or two small producers, if they wish to join, will be more than adequate to bring the five-year balance to where they need to be by the end of the first quarter 2018." WTI crude oil is trading at 50.8 at the time writing, up 0.9% comparing to last week's close. Recent rebound in WTI is expected to extend further to 53.76/55.24 resistance zone in near term.
In this week's calendar...
Released today, UK Rightmove house price rose 1.2% mom in May. Looking ahead, FOMC minutes and BoC rate decisions will be the main focuses this week. Markets will look into FOMC minutes on hints to solidify the expectations of a June hike. BoC will very likely keep monetary policies unchanged. In additional to that, Euro will look into Eurozone PMIs and Germany Ifo for further affirmation of improvements in economy. UK inflation report hearing will also be watched. Here are some highlights for the week ahead"
- Tuesday: Japan all industries index; Swiss trade balance; Eurozone PMIs; German Ifo; UK inflation report hearings, public sector net borrowing; Canada wholesale sales; US PMIs, new home sales
- Wednesday; New Zealand trade balance; German Gfk consumer sentiment; BoC rate decision, FOMC minutes, US existing home sales
- Thursday: UK GDP revision, BBA mortgage approvals; US jobless claims, trade balance, wholesale inventories
- Friday: Japan CPI; US durable goods orders, GDP revision, U of Michigan sentiment
AUD/USD Daily Outlook
Daily Pivots: (S1) 0.7417; (P) 0.7443; (R1) 0.7480; More...
AUD/USD's corrective recovery is still in progress and could extend higher. But upside is expected to be limited below 0.7555 resistance to bring fall resumption. Below 0.7388 minor support will turn bias to the downside. Break of 0.7328 will extend the decline from 0.7748 to 0.7144/7158 support zone. However, firm break of 0.7555 will argue that fall from 0.7748 is completed and turn bias back to the upside.
In the bigger picture, we're still treating price actions from 0.6826 low as a corrective pattern. And, as long as 38.2% retracement of 0.9504 to 0.6826 at 0.7849 holds, long term down trend from 1.1079 is expected to resume sooner or later. Break of 0.6826 low will target 0.6008 key support level. However, firm break of 0.7849 will indicate that rise from 0.6826 is developing into a medium term rebound, rather than a sideway pattern. In such case, stronger rise should be seen to 55 month EMA (now at 0.8115) and above.
Economic Indicators Update
| GMT | Ccy | Events | Actual | Forecast | Previous | Revised |
|---|---|---|---|---|---|---|
| 23:01 | GBP | Rightmove House Prices M/M May | 1.20% | 1.10% | ||
| 23:50 | JPY | Trade Balance (JPY) Apr | 0.10T | 0.25T | 0.17T | 0.11T |
| 13:00 | CNY | Conference Board Leading Index Apr | 0.90% | |||
| 14:00 | USD | Fed's Harker Speaks in New York | ||||
| 14:30 | USD | Fed's Kashkari Speaks |