Sample Category Title
GOLD Strong Selling Pressures, SILVER Important Selling Pressures, CRUDE OIL Targeting Support At 47.01.
GOLD Strong selling pressures.
Gold continues its decline after the yellow metal has faded near the hourly resistance at 1295 (18/04/2017 high). Hourly support located at 1260 (26/04/2017 low) has been broken. The road is wide-open for further decline.
In the long-term, the technical structure suggests that there is a growing upside momentum. A break of 1392 (17/03/2014) is necessary ton confirm it, A major support can be found at 1045 (05/02/2010 low).
SILVER Important selling pressures.
Silver continues its decline. Strong support given at 16.82 (15/03/2017 low) has been broken. Strong resistance is given at a distance at 19.00 (09/11/2017 high). Expected to see continued bearish pressures until at least $16.
In the long-term, the death cross indicates that further downsides are very likely. Resistance is located at 25.11 (28/08/2013 high). Strong support can be found at 11.75 (20/04/2009).
CRUDE OIL Targeting support at 47.01.
Crude oil is trading lower towards key support given at 47.01 (22/01/2017 low). Resistance for a short-term bounce can be found at 50.71 (old support) and 53.70 (12/04/2017 high).
In the long-term, crude oil has recovered after its sharp decline last year. However, we consider that further weakness are very likely. Strong support lies at 24.82 (13/11/2002) while resistance can now be found at 55.24 (03/01/2017 high).
EUR/JPY On Its Way Towards Resistance At 123.31, EUR/GBP Trading Sideways, EUR/CHF Ready For A New Leg Lower.
EUR/JPY On its way towards resistance at 123.31.
EUR/JPY's buying pressures are there. Key resistance area given around 122.00 has been broken. Strong resistance stands at 123.31 (27/01/0217 high). Major support is given at 114.90 (18/04/2017low). Expected to see further increase.
In the longer term, the technical structure validates a medium-term succession of lower highs and lower lows. As a result, the resistance at 149.78 (08/12/2014 high) has likely marked the end of the rise that started in July 2012. Strong support at 94.12 (24/07/2012 low) looks nonetheless far away.
EUR/GBP Trading sideways.
EUR/GBP is trading mixed. The technical structure remains negative as long as the resistance at 0.8530 (25/04/2017 low) holds. Expected to show continued weakness until support given at 0.8304 (05/12/2017 low).
In the long-term, the pair has largely recovered from recent lows in 2015. The technical structure suggests a growing upside momentum. The pair is trading above from its 200 DMA. Strong resistance can be found at 0.9500 psychological level.
EUR/CHF Ready for a new leg lower.
EUR/CHF's selling pressures are increasing. Despite the sharp increase and the recent bullish breakout which is very likely psychological, we believe that the medium-term pattern suggests us to see at some point renewed bearish pressures towards key support that can be found at 1.0623 (24/06/2016 low).
In the longer term, the technical structure is mixed. Resistance can be found at 1.1200 (04/02/2015 high). Yet,the ECB's QE programme is likely to cause persistent selling pressures on the euro, which should weigh on EUR/CHF. Supports can be found at 1.0184 (28/01/2015 low) and 1.0082 (27/01/2015 low).
USD/CHF Gaining Short-Term Bullish Momentum, USD/CAD Consolidating Above 1.3700, AUD/USD Bearish Trend.
USD/CHF Gaining short-term bullish momentum.
USD/CHF starts to trade higher. Yet, the volatility is getting higher. The short-term technical structure is turning positive as long as prices remain above hourly support at 0.9856 (23/04/2017 high).
In the long-term, the pair is still trading in range since 2011 despite some turmoil when the SNB unpegged the CHF. Key support can be found 0.8986 (30/01/2015 low). The technical structure favours nonetheless a long term bullish bias since the unpeg in January 2015.
USD/CAD Consolidating above 1.3700.
USD/CAD stands above 1.3700. The pair keeps on pushing higher. Hourly support can be found at 1.3411 (24/04/2017 high) then 1.3353 (20/01/2017 high). Expected to show continued bullish pressures as long as the pair remains above 1.3530 (27/04/2017 low).
In the longer term, there is a golden cross with the 50 dma crossing the 200 dma indicating further upside pressures. Strong resistance is given at 1.4690 (22/01/2016 high). Long-term support can be found at 1.2461 (16/03/2015 low).
AUD/USD Bearish trend.
AUD/USD is trading below 0.7500. As long as prices remain below the resistance at 0.7608 (17/04/2017 high), the short-term technical structure is negative. Key resistance stands at 0.7681 (30/03/2017 high). Expected to show further weakness.
In the long-term, we are waiting for further signs that the current downtrend is ending. Key supports stand at 0.6009 (31/10/2008 low) . A break of the key resistance at 0.8295 (15/01/2015 high) is needed to invalidate our long-term bearish view.
EUR/USD Trading Sideways, GBP/USD Weakening, USD/JPY Breaking Resistance At 112.20.
EUR/USD Trading sideways.
EUR/USD is trading mixed. Hourly support is given at 1.0852 (27/04/2017 low) then 1.0682 (21/04/2017 base). Stronger support can be found at 1.0494 (22/02/2017 low). Hourly resistance is given at 1.0951 (26/04/2017 high). Expected to show another leg higher towards 1.10.
In the longer term, the death cross late October indicated a further bearish bias. The pair has broken key support given at 1.0458 (16/03/2015 low). Key resistance holds at 1.1714 (24/08/2015 high). Expected to head towards parity.
GBP/USD Weakening.
GBP/USD is consolidating lower. Hourly resistance can be found at 1.2966 (30/04/2017 high). Hourly support can be found at 1.2757 (21/04/2017 low). An unlikely break of this support would indicate further weakness.
The long-term technical pattern is even more negative since the Brexit vote has paved the way for further decline. Long-term support given at 1.0520 (01/03/85) represents a decent target. Long-term resistance is given at 1.5018 (24/06/2015) and would indicate a long-term reversal in the negative trend. Yet, it is very unlikely at the moment
USD/JPY Breaking resistance at 112.20.
USD/JPY keeps on pushing higher since the pair given at 112.20 (31/03/2017 high) has been broken. Hourly support can be found at 110.88 (26/04/2017 low). Stronger support is ocated at 108.13 (17/04/2017 low). Other key supports lie at a distant 106.04 (11/11/2016 low). Expected to show continued bullish pressures.
We favor a long-term bearish bias. Support is now given at 96.57 (10/08/2013 low). A gradual rise towards the major resistance at 135.15 (01/02/2002 high) seems absolutely unlikely. Expected to decline further support at 93.79 (13/06/2013 low).
EM Currencies Tumble As Commodity Prices Slide
EM currencies in the doldrums ahead of NFP and French election
Emerging markets currencies tumbled on Thursday amid a sharp correction in commodity prices and mounting expectations of a June Fed rate hike. The West Texas Intermediate hit $47.31 a barrel this morning while its counterpart from the North Sea fell to $50.26 amid supply glut worries. In China, the price of iron ore fell as much as 8% overnight, before trimming losses at around -5%, amid concerns over weak demand. Iron ore futures for delivery in September on the Dalian Commodity Exchange slid to CNY 499 a metricton.
The South African rand was the worst performing currencies this morning as it tumbled 0.60% against the greenback. The rand retraced more than half of last month’s gains as the country’s unstable political landscape takes centre stage once again. The anti-Zuma sentiment is mounting in the country and international investors definitely do not like it. USD/ZAR has broken the 13.3294 resistance (Fibonacci 38.2% on March-April rally) and is currently heading for the following one at 13.6316 (200dma), if broken the road is wide open towards 13.9578 (high from April 10). We therefore maintain our negative view on the currency and wait for a period of stabilization before betting on a correction.
Earnings growth helps support valuation
Equity markets were well behaved after the FOMC meeting closing slightly lower after pullback. The fact was there was nothing really ground breaking nor indication that rate path would be steep enough to derail current risk rally. US earning season is nearly over any so far the results have been extremely positive. Of the 300 companies reporting 75% have signaled positive growth earnings (even stagnant Apple reported earnings growth while buyers waited for iPhone 8). Upside surprises came from cyclical sectors such as consumer discretionary, industrials and materials but consumer staples and defensive earning were flat. Rise in gasoline prices in 1Q lowered household free cash, support by sluggish retail sales constricted earnings growth.
Steepening of the US yeild curve should benefit financials moving forward. Real estate sector is likely to be most vulnerable by rising interest rates. Should earning growth continued at this pace, calls of overvalution become more complicated. In the ultra short term we could see a minor bearish consolidation ahead of the French elections.
Fed Remains On Hold, Views Growth Slowdown As ‘Transitory’
The FOMC kept its policy unchanged yesterday, while the statement accompanying the decision was little changed from previously, maintaining a neutral tone. Perhaps the most important point was that policymakers view the Q1 slowdown in GDP as transitory, implying they expect growth to regain speed in Q2.
Indeed, the Atlanta Fed GDPNow model is currently pointing to a strong rebound in Q2. In a sense, the Fed reassured investors that there is no reason to worry about the soft Q1, while the Atlanta Fed model adds some validity to that view. Therefore, the probability for a June hike rose slightly after the decision and consequently, the dollar gained somewhat.
Moving forward, we believe that the market may start paying extra attention to US economic releases, as they could prove the main catalyst of whether the Fed will indeed proceed with its next rate increase in summer months. Given the Committee's data dependence, investors are now likely to turn their gaze to tomorrow's employment data for April. A strong report is needed for the greenback to extend its post-FOMC gains.
USD/JPY traded higher on the Fed decision, breaking above the resistance (now turned into support) of 112.35 (S1). Nevertheless, the positive leg was stopped by the 112.90 (R1) resistance level and the downside resistance line taken from the peak of the 3rd of January. Absent any shock, we expect the pair to continue oscillating near that resistance zone, waiting for tomorrow's employment data. A solid report could encourage the bulls to overcome that zone and perhaps initially aim for our next resistance of 113.50 (R2).
UK local elections to set the tone for the General Election?
In the UK, the main event will be local elections. Even though these usually pass unnoticed, investors may look to these results as a gauge of whether Theresa May and the Conservatives are indeed as far ahead as the General Election polls indicate.
Currently, polls suggest that the Conservatives are by far the most popular party, with roughly 46% of the total vote. If they gather less support than that today, this could generate concerns that PM May could fail to gather the majority she is seeking in order to strengthen her negotiating hand. Something like that may cause sterling to give back some of its latest gains. On the other hand, a strong showing by the Conservatives could suggest that the polls are indeed correct, and thereby cause GBP to extend its gains.
GBP/USD slid yesterday following the Fed signals, to hit support slightly above the key support obstacle of 1.2850 (S1). We think that today's elections could prove the trigger of whether the rate will rebound from that zone, or break back below it. In case the market decides not to respond to today's results, we expect the rate to oscillate around the key 1.2850 level, awaiting for tomorrow's US jobs data.
As for the rest of today's highlights:
During the European day, the Norges Bank rate decision will be in the spotlight and the forecast is for the Bank to remain on hold once again. Since the last gathering, data showed that inflation slowed further. Even though we don't expect an actual rate cut due to the financial stability risks involved, we expect the tone of the accompanying statement to remain very dovish, in which case NOK could stay under selling pressure.
As for the economic data, the UK services PMI for April is expected to have declined, but given that the manufacturing and construction indices defied similar expectations and instead surged, we see the risks surrounding that forecast as skewed to the upside. In case of a positive surprise, GBP could come under renewed buying interest.
In the US, the nation's trade deficit is expected to have widened further in March. We also get the preliminary labor costs index for Q1 and initial jobless claims for the week ended on the 28th of April. Factory orders for March are due out as well.
As for the speakers, we have two on the agenda: ECB President Mario Draghi and Executive Board member Sabine Lautenschlager. We think that market attention will probably be on Draghi's remarks, for any hints as to whether the Bank is likely to shift to a more optimistic bias at its upcoming meetings.
USD/JPY
Support: 112.35 (S1), 111.90 (S2), 111.40 (S3)
Resistance: 112.90 (R1), 113.50 (R2), 114.50 (R3)
GBP/USD
Support: 1.2770 (S1), 1.2700 (S2), 1.2615 (S3)
Resistance: 1.2950 (R1), 1.3000 (R2), 1.3050 (R3)
EUR/USD Analysis: Retreats Below 1.09 Mark
'Investors in the currency options market are less worried about the outcome of the French election run-off than they were before the first round.' – Vassilis Karamanis, Bloomberg
Pair's Outlook
Due to the hawkish announcement by the Fed on Wednesday, the common European currency was trading below the 1.09 mark against the US Dollar on Thursday morning. The pair seemed to have rebounded against the support, which is provided by the weekly PP at 1.0890 level. If the situation does not change and a surge persists, the currency exchange rate will reach the weekly R1, which is located at the 1.0958 level. On the other hand, the pair might decline to the support cluster below it that begins at the 1.0835 level.
Traders' Sentiment
Traders remain bearish, as 59% of open positions are short on Thursday. Meanwhile, 52% of trader set up orders are to sell the Euro.
GBP/USD Analysis: Abandons Previously Tested Area
'Looking at a longer timeframe modelling of the Pound's fair-value, ING say the GBP/EUR exchange rate is now materially undervalued' – Gary Howes (based on PoundSterlingLive)
Pair's Outlook
GBP/USD opened red on the daily chart Thursday morning, setting a downside target at 1.2829 in sight. The area is represented by the daily S1 and is most likely to be up for solid tests today. Because of the proximity to the area, the cross might lack general volatility today in order to respect the area. In case of severe downside volatility around 15:30 GMT when the US unemployment claims data comes out, 1.2762 might be the level more likely to cut the movement with more demand at 1.2729. Upside risks are currently limited to 1.2898.
Traders' Sentiment
There are 50% of traders holding short positions today (previously 52%), whereas 56% of all pending orders are to acquire the Pound.
NZD/USD Candlesticks and Ichimoku Analysis
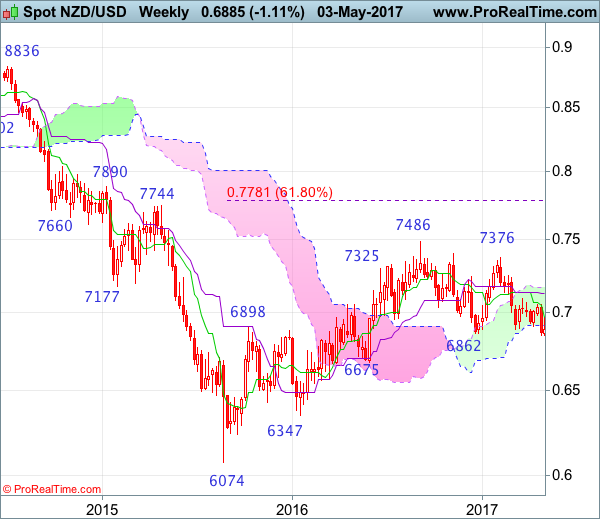
Weekly
• Last Candlesticks pattern: Shooting star
• Time of formation: 5 Sep 2016
• Trend bias: Down
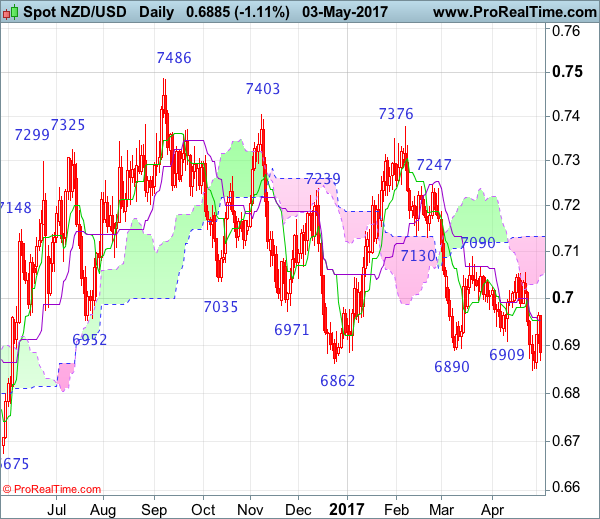
Daily
• Last Candlesticks pattern: Hammer
• Time of formation: 14 Mar 2017
• Trend bias: Near term up
NZD/USD – 0.6974
Kiwi resumed recent decline from 0.7376 and has remained under pressure, suggesting the fall from there is still in progress, hence further decline to 0.6780 (50% Fibonacci retracement of 0.6074-0.7486) would be seen, however, near term oversold condition should prevent sharp fall below 0.6700 and reckon 0.6675 support would hold from here, price should stay well above 0.6610-15 (61.8% Fibonacci retracement), risk from there is seen for a rebound to take place later.
On the upside, although initial recovery to 0.6915-20 cannot be ruled out, reckon resistance at 0.6969 would limit upside and price should falter below 0.7000, bring another decline later. Only above resistance at 0.7056 would suggest low is possibly formed instead, bring a stronger rebound to indicated resistance at 0.7090, a daily close above there would provide confirmation, bring at least a retracement of recent decline from 0.7376 to the upper Kumo (now at 0.7133), however, break there is needed to retain bullishness and encourage for further subsequent rise to 0.7185-90 but resistance at 0.7247 should remain intact.
Recommendation: Stand aside for this week.
On the weekly chart, as kiwi ran into renewed selling interest just around the Tenkan-Sen and has slipped again this week, suggesting recent fall from 0.7486 top is still in progress for further weakness to 0.6780 (50% Fibonacci retracement of 0.6074-0.7486) and later towards previous chart support at 0.6675, however, reckon downside would be limited to 0.6610-15 (61.8% Fibonacci retracement) and price should stay above 0.6550, bring rebound later.
On the upside, expect recovery to be limited to the Tenkan-Sen (now at 0.6969) and bring another decline later to aforesaid downside target. Above last week’s high at 0.7056 would abort and suggest low is formed instead, bring test of the Kijun-Sen (now at 0.7126), then towards the upper Kumo (now at 0.7171) but resistance at 0.7247 should remain intact and price should falter well below 0.7300, bring further broad consolidation later.
USD/JPY Analysis: Turning Point
'The dollar stood at 112.765 yen JPY=, slightly higher than Wednesday and at its strongest level since March 20. ' – Nichola Saminather (based on Reuters)
Pair's Outlook
USD/JPY put an end to the strong climb that had been extended towards the upper boundary of the senior channel that has prevailed since mid-December 2016 with a small red candle on Thursday morning. Risks for our base scenario lie below, meaning that today is most likely to be a turning point in the motion as a break above 112.84 is very unlikely. The first level to the downside rests at 112.35 and is an appropriate target for today. In case the cross continues to stick to the upper bound of the channel, we might see some more upside potential in the future.
Traders' Sentiment
Market sentiment is relatively neutral, as 57% of all open positions are short and the remaining 53% are long. At the same time, the number of orders to buy the Buck slipped from 49% to 48%.