

Sample Category Title
USD/JPY Analysis: Turning Point
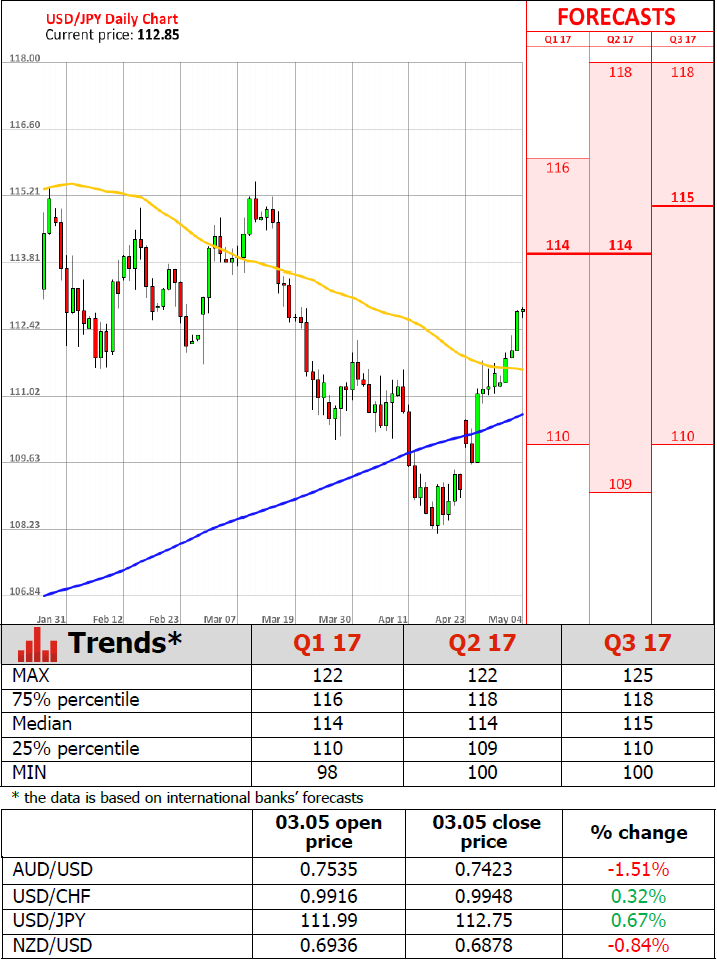
'The dollar stood at 112.765 yen JPY=, slightly higher than Wednesday and at its strongest level since March 20. ' – Nichola Saminather (based on Reuters)
Pair's Outlook
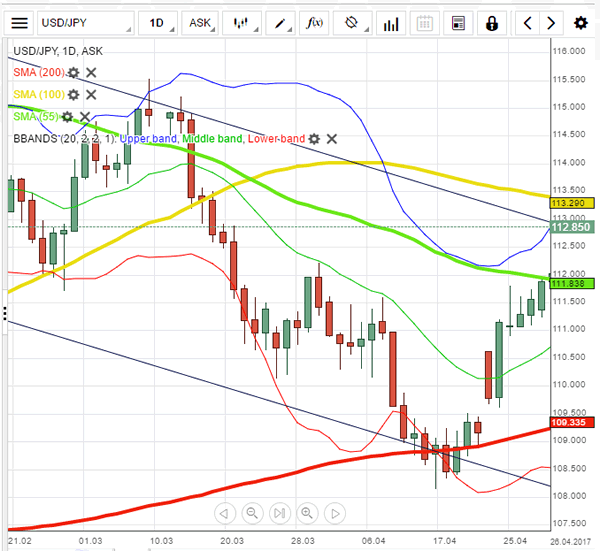
USD/JPY put an end to the strong climb that had been extended towards the upper boundary of the senior channel that has prevailed since mid-December 2016 with a small red candle on Thursday morning. Risks for our base scenario lie below, meaning that today is most likely to be a turning point in the motion as a break above 112.84 is very unlikely. The first level to the downside rests at 112.35 and is an appropriate target for today. In case the cross continues to stick to the upper bound of the channel, we might see some more upside potential in the future.
Traders' Sentiment
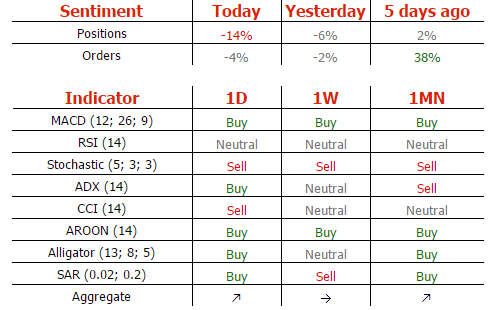
Market sentiment is relatively neutral, as 57% of all open positions are short and the remaining 53% are long. At the same time, the number of orders to buy the Buck slipped from 49% to 48%.
Gold Analysis: Reaches Long Term Trend Line
'The Fed concluded its two-day meeting with a bullish statement that downplayed weak first-quarter economic growth.' – Marcy Nicholson and Zandi Shabalala, Reuters
Pair's Outlook
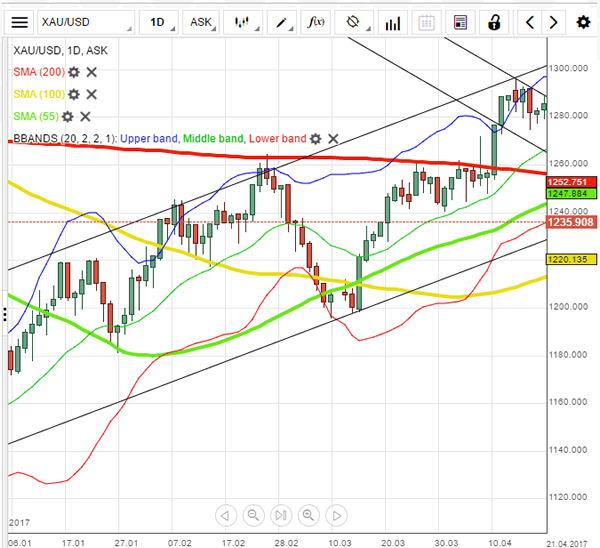
As the FOMC published their statement, the yellow metal's price declined and passed two significant support clusters. The fall stopped exactly at the lower trend line of the long term ascending channel pattern. Initially this move was expected to occur later. On Thursday morning the commodity price was squeezed in between the trend line and a resistance cluster just above the 1,240 level. However, it is most likely that the resistance cluster will be broken and the metal will begin to approach the 1,250 mark.
Traders' Sentiment
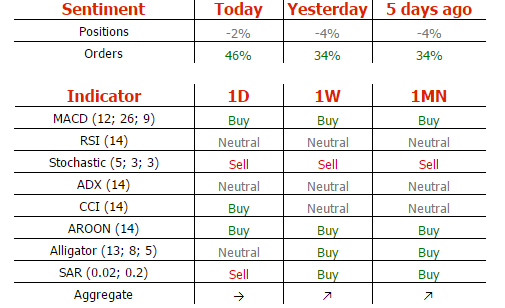
SWFX market sentiment is almost neutral, as 51% of open positions are short. However, 73% of trader set up orders are to buy the metal.
Fed Remains On Rate Hike Path, Services Activity Hits 57.5, Private Sector Creates 177K Jobs In April
'This glass-half-full statement leaves the door wide open to a June hike, provided, of course, that the recent data letdowns are indeed transitory.' - Michael Feroli, JPMorgan Chase & Co.
As markets expected, the US Federal Reserve left its monetary policy unchanged at its meeting on Thursday. However, policymakers signalled that 'the path of gradual tightening' remained in play despite an economic slowdown registered in the March quarter. Although the Fed did not provide any clues on the timing of the next interest rate hike. Nevertheless, according to market forecasts, the next hike will likely appear in June. Solid inflation growth and the strong labour market pleased policymakers and offset sluggish economic growth. The next Fed meeting will take place on June 13-14 in Washington. Other data released on Wednesday showed that US services activity rose more than expected in April. The ISM reported its PMI for the nation's services sector came in at 57.5, up from the previous month's 55.2. In the meantime, markets anticipated a slight increase to 56.1 points in April. Earlier that day, ADP reported that US companies created 177K new jobs last month, roughly in line with forecasts. Meanwhile, March's gain of 263K new positions was revised down to 255K.
British Construction Activity Rises More Than Expected Last Month
'April's survey reveals a positive start to the second quarter of 2017, with a robust upturn in civil engineering activity helping to boost the construction industry.' — Tim Moore, Markit
British construction activity hit its four-month high last month, suggesting that the economy began a slow recovery after a sluggish start. Markit/CIPS reported on Wednesday that its Purchasing Managers' Index for the UK construction sector came in at 53.1 in April, up from the preceding month's 52.2, while analysts anticipated a slight decrease to 52.1 in the reported month. Activity in the civil engineering sub-sector rose at the fastest pace in more than a year and growth in the house-building sub-sector reached a four-month high. The latest PMI surveys are set to provide significant support to the UK Prime Minister Theresa May ahead of the June 8 National Election. Moreover, the PMIs are expected to please the Bank of England, which is due to meet next week. However, today's release of the Markit Services PMI will provide a better picture of the current economic situation in the country, the services sector contributes around 70% to the nation's GDP. Wednesday's data showed that new orders and output both rose at the fastest pace of this year, whereas unemployment advanced at the strongest pace since May 2016.
Technical Outlook: AUDUSD Extends Weakness After Wednesday’s 1.5% Fall, Targets At 0.7386/29 In Focus
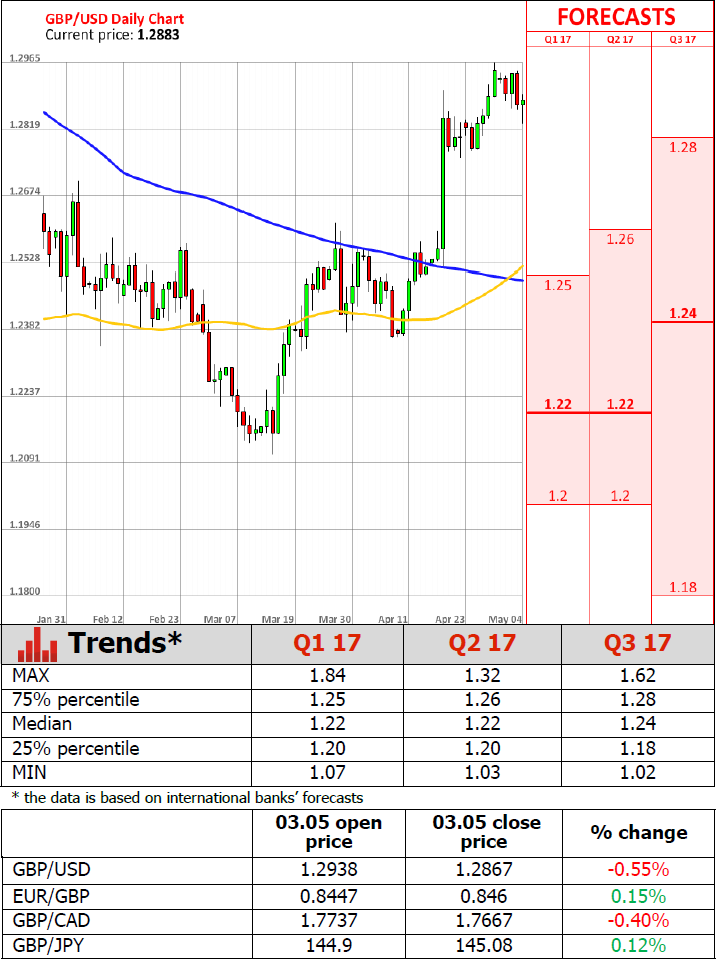
The Aussie remains under strong pressure and extended weakness on Thursday and hit fresh multi-month low at 0.7392 (the lowest since 11 Jan), pressured by trade balance data from Australia and Services PMI from China.
Australian trade balance narrowed in March, compared to the forecast, while Chinese Caixin Services PMI also missed the forecast.
The pair fell sharply on Wednesday, losing around 1.5% for the day on the biggest one-day fall since 09 November.
Loss of previous low and key support at 0.7438 has increased strong downside pressure from firmly bearish technical studies, as the pair is now pressuring next important support at 0.7386 (Fibo 61.8% of 0.7163/0.7747 ascend.
Wednesday's long bearish candle weighs heavily on the market, with the pair looking for break below 0.7386 for potential attack at another key support at 0.7329 (weekly cloud base).
Broken former low at 0.7438 now offers immediate resistance, with falling daily Tenkan-sen (currently at 0.7487) expected to cap upside attempts.
Res: 0.7438, 0.7487, 0.7535, 0.7554
Sup: 0.7386, 0.7329, 0.7298, 0.7271
Technical Outlook: USDJPY – Post-Fed Bullish Extension Cracks Daily Cloud Top
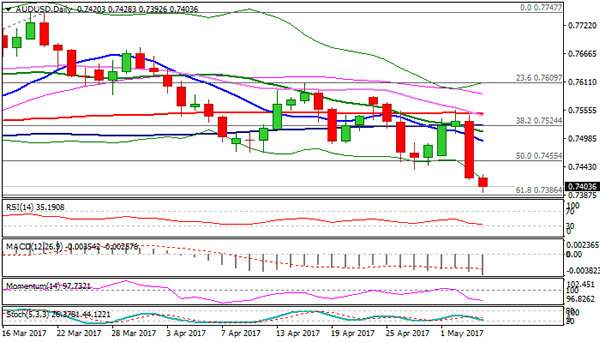
The dollar surged after Fed on Wednesday, gaining 0.68% for the day and closed above 112.67 (Fibo 61.8% of 115.49/108.11 descend) which was strong bullish signal. Bulls extended on Thursday and cracked daily cloud top (112.85), coming ticks ahead of next strong barriers at 112.92/113.00 (falling trendline connecting 118.59/115.49 tops/psychological barrier). Strong bullish setup of daily technical studies is supportive and so far ignores strongly overbought conditions of slow stochastic. Close daily cloud top will generate bullish signal for further upside action through falling 100SMA (113.23) for extension towards 113.75 (Fibo 76.4%). However, corrective easing could be anticipated in the near-term with solid supports at 112.14 (daily cloud base) and 111.80 (broken weekly Tenkan-sen) expected to ideally contain correction.
Res: 113.00, 113.23, 113.53, 113.75
Sup: 112.64, 112.14, 111.80, 111.36
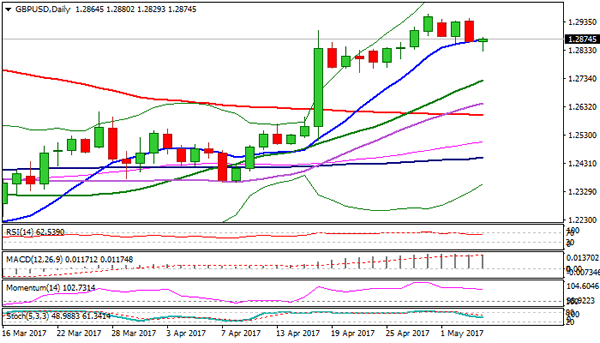
Technical Outlook: GBPUSD Cracked Key Supports But Without Clear Break Lower So Far, Hawkish Fed And Brexit Fears Weigh
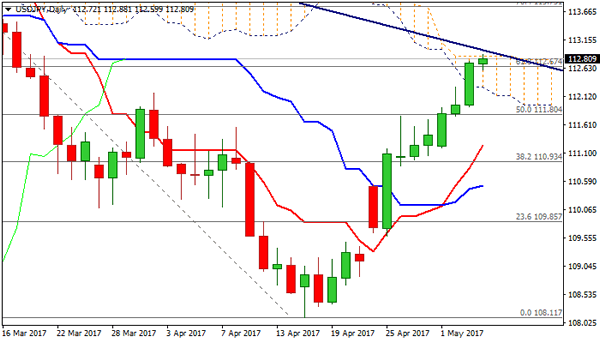
Cable closed firmly in red on Wednesday and extended dips below key supports at 1.2866/67 (daily Tenkan-sen / 10SMA), driven lower by hawkish FED and rising Brexit fears.
Although there was no clear break lower so far (dip to the session low at 1.2829 was quickly reversed as thick 4-hr cloud continues to underpin), bearish signal has been generated on Wednesday's Bearish Engulfing which may trigger stronger easing.
Close below Tenkan-sen / 10SMA would be seen as additional negative signal for extended correction towards next key supports at 1.2770/55 (lows of former consolidation) and 1.2725 (rising 20SMA).
Conversely, bounce back above 1.2900 handle would ease immediate downside pressure, while return above past three days highs at 1.2940 is needed to neutralize and re-focus barriers at 1.2963 and 1.3.
Res: 1.2900, 1.2945, 1.2963, 1.3000
Sup: 1.2829, 1.2800, 1.2770, 1.2755
AUD/USD Candlesticks and Ichimoku Analysis
Weekly
• Last Candlesticks pattern: Shooting doji
• Time of formation: 20 Feb 2017
• Trend bias: Sideways
Daily
• Last Candlesticks pattern: Bearish engulfing pattern
• Time of formation: 21 Mar 2017
• Trend bias: Near term down
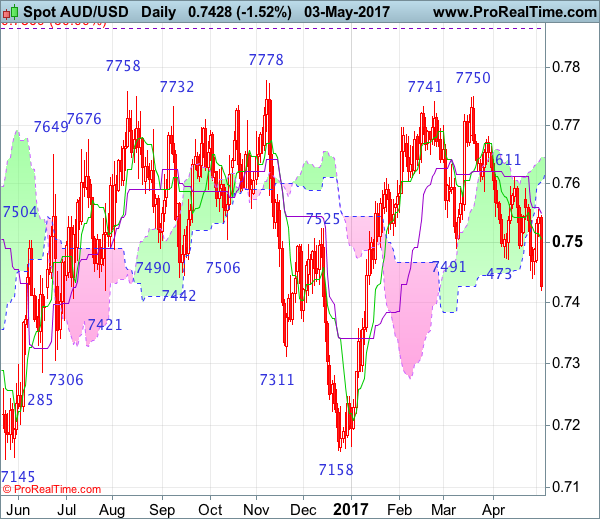
Although aussie recovered initially this week, renewed selling interest emerged at 0.7556 and the pair has fallen again, adding credence to our bearish view for the decline from 0.7750 to bring at least a strong retracement of the rise from 0.7158, hence further weakness to 0.7380-85 (61.8% Fibonacci retracement of 0.7158-0.7750), then towards 0.7300-10, however, near term oversold condition should prevent sharp fall below 0.7250-60 and price should stay well above support at 0.7158.
On the upside, expect recovery to be limited to 0.7440 and the Tenkan-Sen (now at 0.7493) should remain intact, bring another decline to aforesaid downside targets. Above the Kijun-Sen (now at 0.7537) would risk test of said resistance at 0.7556 but a daily close above there is needed to signal low is formed instead, risk a stronger rebound to resistance at 0.7592 and possibly test of the upper Kumo (now at 0.7645) but resistance at 0.7680 should cap upside.
Recommendation: Hold short entered at 0.7570 for 0.7390 with stop above 0.7495.
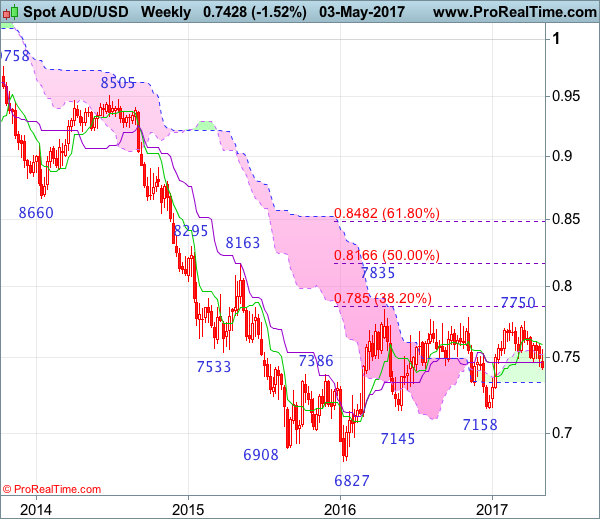
On the weekly chart, as aussie met renewed selling interest at 0.7556 earlier this week and has slipped again, another black candlestick looks set to be formed this week, retaining our bearish view that the rebound from 0.7158 has ended at 0.7750, bearishness remains for the fall from there to extend further decline to 0.7380-85 (61.8% Fibonacci retracement of 0.7158-0.7750), however, reckon downside would be limited to 0.7290-00 and 0.7230 would hold from here, bring rebound later.
On the upside, although initial recovery to 0.7440-50 cannot be ruled out, reckon 0.7495-00 would hold and bring another decline. Above 0.7556 (this week’s high) would defer and risk test of the Tenkan-Sen (now at 0.7572) but price should falter below resistance at 0.7611, bring another decline later. Only break of 0.7611 would abort and suggest low is formed instead, bring further gain towards resistance at 0.7680 but a sustained breach above this level is needed to signal the retreat from 0.7750 has ended, bring another bounce towards this level.
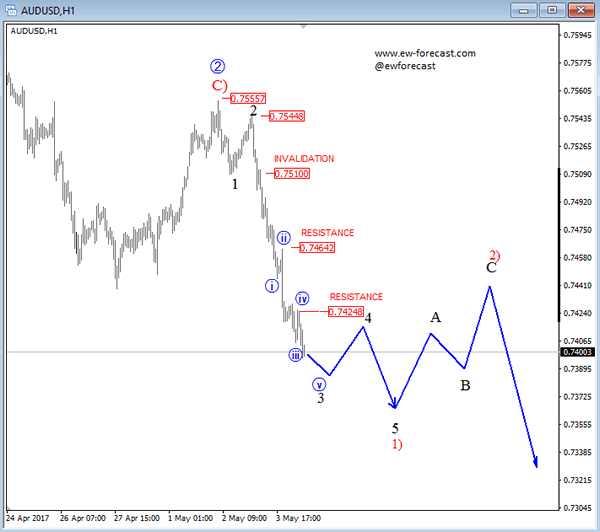
AUDUSD Trading Sharply Lower Today, Setbacks May Occur!
The USD is seen slightly higher against the EUR and GBP, and much more higher against commodity currencies, NZD and AUD in particular after the Federal Reserve's hawkish policy statement. Stocks are seen in bullish mode still, while gold fell sharply lower towards 1230 area. So as long this will be the case, we think that commodity currencies will stay under pressure and even extend weakness if 10 year US notes will break lower based on the Elliott Wave structure.
Our focus today is on AUDUSD where pair shows a bearish price action with an aggressive sell of from 0.75448 that looks like an extended wave 3. Fourth wave bounce may be seen in the near-term that can stop at one of resistance levels before weakness extends even lower in wave 1).
AUDUSD, 1H
How Will Non-Farm Payroll Affect June Rate Hike ?
The FOMC kept rates on hold on Wednesday which was in line with market expectations. The FOMC stated that the weak Q1 GDD is transitory and business investment firmed. The FOMC left the door open to a June rate hike in the statement.
Per the CME's FedWatch tool, the probability for a June rate hike has increased to 69.1%. The dollar index broke through a significant resistance level at 99.00 taking market to a 2-week high of 99.33. During early European session on Thursday. USD/JPY hit the highest level of 112.88 not seen since March 20.
The strengthening of USD weighed on gold prices with spot gold hitting the lowest level of 1232.92 not seen since March 21.
The crucial US labour market data for April will be released this Friday May 5, at 13:30 BST. It includes non-farm payrolls, unemployment rate and average hourly earnings. Please note that the release of US labour market data will likely cause volatility for USD, USD crosses and commodities.
Although the non-farm payrolls in March was disappointing seeing the slowest growth of 98K (a number not seen since March of last year). The unemployment rate in March of 4.5% was another figure not seen since May 2007. US unemployment has seen a downtrend since 2010 and has stabilised in a range between 4.6% – 5% since early 2016. Wages continue to show an upswing from early 2015. The Fed sees the labour market as close to full employment with Employers having to raise wages to attract workers in a tightening job market.
The ADP employment change released yesterday, regarded as the prediction of NFP, dropped to 177K in April from 255K in March, marking the slowest growth this year. The slowdown in April was mainly caused by declines in job creation in the construction and retail sectors. Conversely, the service and business service sectors saw noticeable job gains.
The average revised figure of non-farm payrolls in the past 6 months has been around 192K which is not far from the 180K estimate for April. The recent US economic data has been weak, such as the non-farm payroll in March, the Q1 GDP and auto sales etc. Therefore, If the upcoming non-farm payrolls is in line with or above 180K, accompanied by an upward revised previous figure, and a stable unemployment rate. then it will likely boost market confidence on the US economy and the probability for a rate hike in June.
Conversely, if the upcoming non-farm payrolls is far below expectations, accompanied by a downward revised previous figure, and a rising unemployment rate. Then it will likely increase market concerns on the economic slowdown and put more stress on the Fed to raise rates in June.
Be aware that, based on prior experience, market trends sometimes reverse within 1-2 hours after the initial move.
Fed Chair Yellen will make a speech at 18:30 BST on Friday at Brown University. The markets will be attentive to any comments she makes about the US economy.