

Sample Category Title
Euro Area Retail Sales For March Released Today
Market movers today
Euro area retail sales for March released today. Following solid monthly increases in both January (0.1%) and February (0.7%) we expect a marginal monthly decline of 0.1% in March.
The important PMI services index for UK is due today and we expect it to be more or less unchanged at 55.0, as suggested by the services confidence indicator.
Following the final TV debate in the French election yesterday, the market will monitor incoming polls to see if it has impacted Macron's strong lead ahead of the second round of the election on Sunday.
We do not expect any new signals from Norges Bank today. It is not long since the previous meeting in March, which included a monetary policy report with updated interest rate projections. Although the bank cont inued to signal a significant chance of a further rate cut, there is lit t le to suggest that the probability has increased since the March meeting.
Selected market news
The Chinese Caixin service PMI fell to 51.5 in April from 52.2 in March thus mirroring the fall in the manufacturing PMI released on Monday. Consequent ly, the composite PMI dropped to 51.2 from 52.1. The data shows that the weaker growth seen in China has hit across both the service and manufacturing sectors.
As expect ed, the Fed's May meeting did not provide substant ial new information. The Fed funds target range was maintained at 0.75-1.00% and there were no changes to the reinvestment policy. Most interestingly is that the Fed thinks the weak GDP growth of 0.7% q/q AR in Q1 was 'likely to be transitory'. The Fed st ill expect s growth to cont inue at a moderate pace leading to further labour market tightening and stabilising inflation around 2%. Near-term risks to the economic out look st ill appears 'roughly balanced'.
63% of the viewers of the final TV debate in the French election yesterday thought Macron was more convincing. Hence, the final debate is unlikely to have significant ly impacted the st rong lead he has enjoyed in opinion polls.
UK's Prime Minist er May, yest erday lashed out at EU officials saying they have issued t hreats against the UK and that the EU negot iating stance has hardened. She added that recent leaks have been deliberately timed to affect election results. Finally, she reiterated that no deal with the EU is bet ter than a bad one.
EIA crude data showed a decline in US crude stocks last week of 900kb last week – a lower figure than the API crude data from Tuesday, which showed a 4.2mb decline. On top of this, the estimate for crude production showed a further rise in crude production last week. The release added to bearish sentiment in the oil market and triggered an immediate negat ive reaction in the oil price.
AUD/USD Daily Outlook
Daily Pivots: (S1) 0.7379; (P) 0.7462; (R1) 0.7506; More...
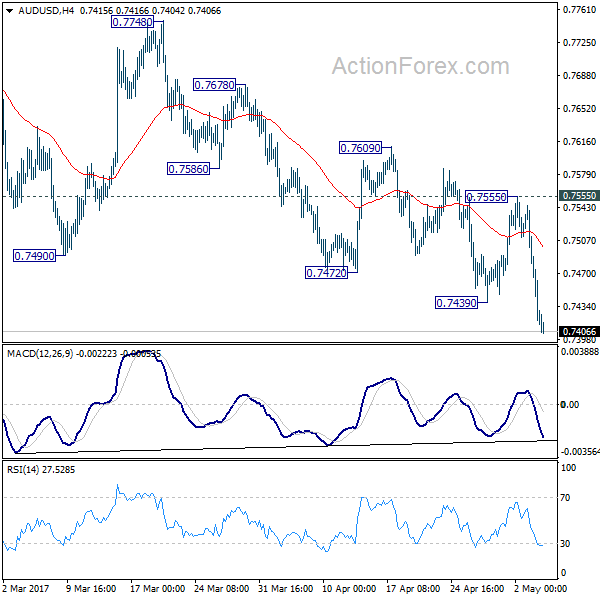
AUD/USD's fall from 0.7158 resumed by taking out 0.7439 and reaches as low as 0.7404 so far. Intraday bias is turned back to the downside for deeper decline. As noted before, rise from 0.7158 has completed at 0.7748 already. Further fall should be seen back to 0.7144/7158 support zone. At this point, there is no clear sign of larger down trend resumption yet. Hence, we'll be cautious on strong support from 0.7144/58 to contain downside and bring rebound. But, break of 0.7555 resistance is now needed to indicate short term bottoming. Otherwise, outlook will remain mildly bearish in case of recovery.
In the bigger picture, we're still treating price actions from 0.6826 low as a correction pattern. And, as long as 38.2% retracement of 0.9504 to 0.6826 at 0.7849 holds, long term down trend from 1.1079 is expected to resume sooner or later. Break of 0.6826 low will target 0.6008 key support level. However, firm break of 0.7849 will indicate that rise from 0.6826 is developing into a medium term rebound, rather than a sideway pattern. In such case, stronger rise should be seen to 55 month EMA (now at 0.8118) and above.
Dollar Edged Up after Uneventful FOMC, Aussie Stays Low on Commodity Weakness
Dollar edged up mildly after a rather uneventful FOMC rate decision. The lift on the greenback was from the fact that Fed tried to talk down Q1's weakness. And there is no change in the expected rate path for Fed as markets are pricing in over 70% chance of a hike in June. But there was nothing for Dollar bulls to cheer neither. Traders will look into non-farm payroll report from US to be released tomorrow. For the moment, focuses remain on the weakness in Japanese Yen and Australian Dollar. In particular, the latter was dragged down to the lowest level since January by the slump in iron ore prices. Iron ore price started tumbling after Chinese Premier Li Keqiang indicated the plan to cut steel capacity. And based on that, Australia's export values would probably continue to fall further ahead and there is more downside potential in the Aussie.
Fed said Q1 weakness "transitory"
As widely anticipated, the FOMC left the target range for the Fed funds rate unchanged at between 0.75- 1.00%. Although the accompanying statement was largely unchanged from the previous month, the implications were important in light of the slowdown in the first quarter. While acknowledging the recent weakness in growth and inflation, policymakers attributed it to 'transitory effects'. The downplaying of 1Q17's disappointments underpinned the Fed's determination to carry on its normalization plan. The FOMC maintained its economic outlook and the gradual rate-hike approach. We continue to expect two more rate hikes this year with one coming in June. More in FOMC Sent Important Rate Hike Hint In An Apparently-Uneventful Meeting.
63% debate viewers said Macron the most convincing
In France, pro-EU centrist Emmanuel Macron emerged as the most convincing one in the final pre-election TV debate with EU-sceptic far-right Marine Le Pen. According to a viewers poll by French broadcaster BFMTV, 63% of viewers voted Macron as the "most convincing" of the pair after the debate. Some analysts called the angry exchange in the debate as extraordinarily violent, bitter and harsh. And Le Pen tried to push Macron to make a mistake but he didn't. According to latest running poll average, Macron is still having 18% lead over Le Pen but that has narrowed mildly. While Macron is widely tipped to be the next French President, some analysts pointed out that Le Pen still have a slim chance of winning if turnout rate happens to be ultra-low. Eyes will now turn to the election this Sunday.
UK PM May accused EU of election interference
In UK, Prime Minister Theresa May accused that "the events of the last few days have shown that - whatever our wishes, and however reasonable the positions of Europe's other leaders - there are some in Brussels who do not want these talks to succeed." And she complained that "Britain's negotiating position in Europe has been misrepresented in the continental press. The European Commission's negotiating stance has hardened. Threats against Britain have been issued by European politicians and officials. All of these acts have been deliberately timed to affect the result of the general election that will take place on 8 June."
Meanwhile, its reported that the so called "divorce" bill for Brexit is raised to EUR 100b for UK. EU's chief Brexit negotiator Michel Barnier declined to "give any figures today" as "I can't because I don't know what the figures are." But he noted that "I cannot accept that term: blank cheque. There was never any question of asking the UK to give us a blank cheque. That would not be serious. All we're asking for is that the accounts to be cleared for the honoring commitments the U.K. has entered."
RBA Lowe: Surge in household debt lowered economy's resilience
In Australia, RBA Governor Philip Lowe said that "recent increase in household debt relative to our incomes has made the economy less resilient to future shocks." And he warned that in response to an economic shock, "an otherwise manageable downturn could be turned into something more serious." Regarding interest rate, he said that "at some point, interest rates in Australia will increase." However, he also emphasized that "this is not a signal about the near-term outlook for interest rates in Australia but rather a reminder that over time we could expect interest rates to rise, not least because of global developments."
On the data front...
Australia trade surplus narrowed to AUD 3.11b in March. China Caixin PMI services dropped to 51.5 in April. Eurozone will release services PMI and retail sales. UK will also release services PMI, mortgage approvals and M4. US will release trade balance, non-farm productivity, jobless claims an factory orders. Canada will release trade balance too.
AUD/USD Daily Outlook
Daily Pivots: (S1) 0.7379; (P) 0.7462; (R1) 0.7506; More...
AUD/USD's fall from 0.7158 resumed by taking out 0.7439 and reaches as low as 0.7404 so far. Intraday bias is turned back to the downside for deeper decline. As noted before, rise from 0.7158 has completed at 0.7748 already. Further fall should be seen back to 0.7144/7158 support zone. At this point, there is no clear sign of larger down trend resumption yet. Hence, we'll be cautious on strong support from 0.7144/58 to contain downside and bring rebound. But, break of 0.7555 resistance is now needed to indicate short term bottoming. Otherwise, outlook will remain mildly bearish in case of recovery.
In the bigger picture, we're still treating price actions from 0.6826 low as a correction pattern. And, as long as 38.2% retracement of 0.9504 to 0.6826 at 0.7849 holds, long term down trend from 1.1079 is expected to resume sooner or later. Break of 0.6826 low will target 0.6008 key support level. However, firm break of 0.7849 will indicate that rise from 0.6826 is developing into a medium term rebound, rather than a sideway pattern. In such case, stronger rise should be seen to 55 month EMA (now at 0.8118) and above.
Economic Indicators Update
| GMT | Ccy | Events | Actual | Forecast | Previous | Revised |
|---|---|---|---|---|---|---|
| 1:30 | AUD | Trade Balance (AUD) Mar | 3.11B | 3.33B | 3.57B | |
| 1:45 | CNY | Caixin China PMI Services Apr | 51.5 | 52.6 | 52.2 | |
| 5:45 | CHF | SECO Consumer Confidence Apr | 3 | -3 | ||
| 7:45 | EUR | Italy Services PMI Apr | 53.7 | 52.9 | ||
| 7:50 | EUR | France Services PMI Apr F | 57.7 | 57.7 | ||
| 7:55 | EUR | Germany Services PMI Apr F | 54.7 | 54.7 | ||
| 8:00 | EUR | Eurozone Services PMI Apr F | 56.2 | 56.2 | ||
| 8:30 | GBP | Services PMI Apr | 54.6 | 55 | ||
| 8:30 | GBP | Mortgage Approvals Mar | 67K | 68K | ||
| 8:30 | GBP | M4 Money Supply M/M Mar | 0.20% | -0.30% | ||
| 9:00 | EUR | Eurozone Retail Sales M/M Mar | 0.10% | 0.70% | ||
| 11:30 | USD | Challenger Job Cuts Y/Y Apr | -2.00% | |||
| 12:30 | CAD | International Merchandise Trade (CAD) Mar | 0.3B | -1.0B | ||
| 12:30 | USD | Non-Farm Productivity Q1 P | 0.00% | 1.30% | ||
| 12:30 | USD | Unit Labor Costs Q1 P | 2.60% | 1.70% | ||
| 12:30 | USD | Trade Balance Mar | -44.9B | -43.6B | ||
| 12:30 | USD | Initial Jobless Claims (29 APR) | 246K | 257K | ||
| 14:00 | USD | Factory Orders Mar | 0.60% | 1.00% | ||
| 14:30 | USD | Natural Gas Storage | 74B |
Daily Technical Analysis: GBP/USD Retracement Within Bull Flag Chart Pattern
Currency pair GBP/USD
The GBP/USD is building a triangle chart pattern (orange/blue) within the uptrend. A bullish break could see price challenge the 1.30 round level and Fibonacci targets whereas a bearish break could start a larger correction or reversal.
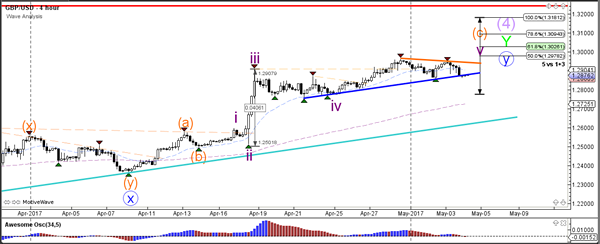
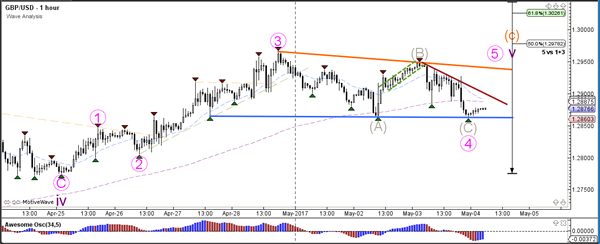
The GBP/USD broke the support of the mini-channel (dotted green lines) and made a larger correction back to the previous bottom (blue) which could be a new bounce or break spot. The channel trend lines (orange/blue) are indicating a bull flag chart pattern (blue lines).
Currency pair EUR/USD
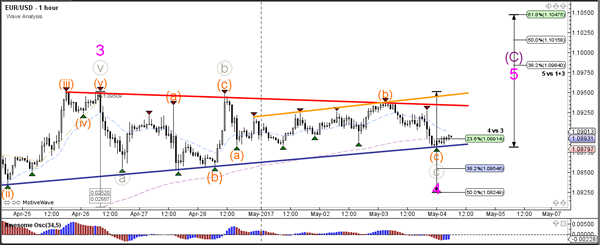
The EUR/USD consolidation pattern remains intact. A break below the support (blue) or above the resistance (red) trend lines is needed before the pattern is broken. A bullish break could indicate a potential uptrend continuation towards the 78.6% Fibonacci level of wave 2 (green) whereas a bearish break could start a reversal and indicate the completion of the ABC zigzag (purple).
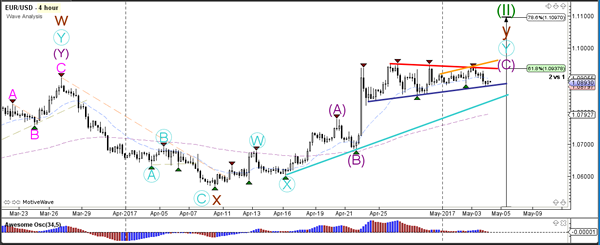
The EUR/USD failed to break above the resistance level (red) yesterday and instead built a wave B (orange) correction within a potential wave 4 (pink). The next targets could the psychological even level at 1.10 and the 61.8% Fib target at 1.1050 if price manages to break resistance (red). The wave 4 (pink) remains valid as long as price stays above the 50% Fibonacci level.
Currency pair USD/JPY
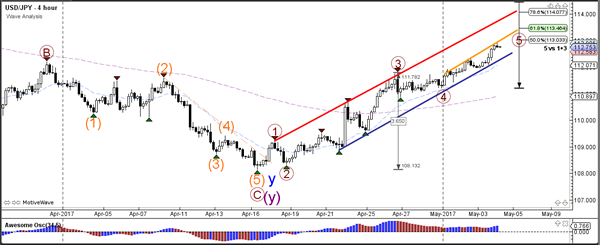
The USD/JPY remains in an uptrend channel (blue/red) and is moving up towards the Fibonacci targets of wave 5 (brown). The channel could break bearishly once the 5th wave (brown) is completed.
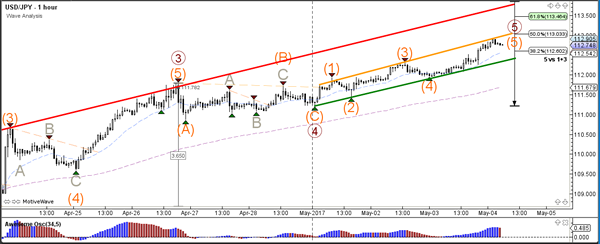
The USD/JPY is probably still in a 5th wave (orange) of a 5th wave (brown) as long as price stays above the support zone (green/blue).
Daily Technical Analysis: EUR/USD Still Supported Above Retail Gap
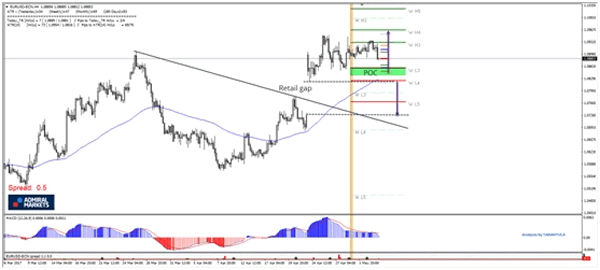
The EUR/USD is still supported above the retail gap which showed straight after Macron won the first round vs Le Pen. Friday is getting close , so we might see profit taking due to Sunday’s final round of presidential elections. 1.0860-45 is POC zone for possible buy trades as the EUR/USD might spike from the zone (W L3, ATR pivot, historical buyers) targeting 1.0930 and 1.0965. A drop below 1.0820 could target 1.0775 and further momentum could also close the retail gap at 1.0730.
Daily Technical Outlook And Review: EUR/USD, GBP/USD, AUD/USD, USD/JPY, USD/CAD, USD/CHF, DOW 30, GOLD
A note on lower timeframe confirming price action...
Waiting for lower timeframe confirmation is our main tool to confirm strength within higher timeframe zones, and has really been the key to our trading success. It takes a little time to understand the subtle nuances, however, as each trade is never the same, but once you master the rhythm so to speak, you will be saved from countless unnecessary losing trades. The following is a list of what we look for:
- A break/retest of supply or demand dependent on which way you're trading.
- A trendline break/retest.
- Buying/selling tails ... essentially we look for a cluster of very obvious spikes off of lower timeframe support and resistance levels within the higher timeframe zone.
- Candlestick patterns. We tend to only stick with pin bars and engulfing bars as these have proven to be the most effective.
EUR/USD
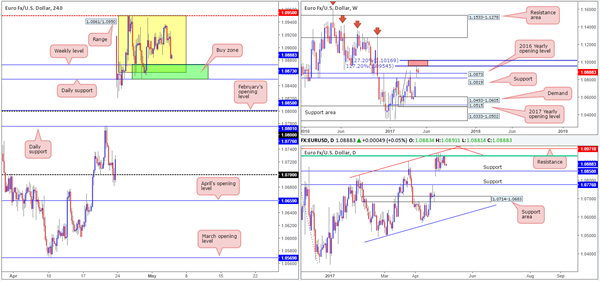
Following a somewhat hawkish FOMC yesterday, the EUR collapsed back below the 1.09 handle as the dollar broke to fresh highs. Despite this recent movement, the pair remains trading within a H4 consolidation fixed between 1.0861/1.0950.
To our way of seeing things, downside is heavily restricted! Not only is the lower edge of the H4 range now in view at 1.0861, there's also the 2016 yearly opening level (weekly chart) at 1.0873 and a daily support at 1.0850 to contend with. Therefore, a decisive close below this range is going to be challenging. As such, a long trade from here is a reasonable possibility.
Our suggestions: Watch for H4 price to form a reasonably sized bullish candle between 1.0850/1.0873 (preferably a full-bodied candle). Should this come to fruition, a buy trade with an initial target objective of 1.09, followed closely by 1.0932 could be an option.
Data points to consider: ECB President Draghi speaks at 5.30pm. US unemployment claims and trade balance at 1.30pm GMT+1.
Levels to watch/live orders:
- Buys: 1.0850/1.0873 ([waiting for a reasonably sized H4 bull candle to form before pulling the trigger is advised] stop loss: ideally beyond the candle's tail).
- Sells: Flat (stop loss: N/A).
GBP/USD
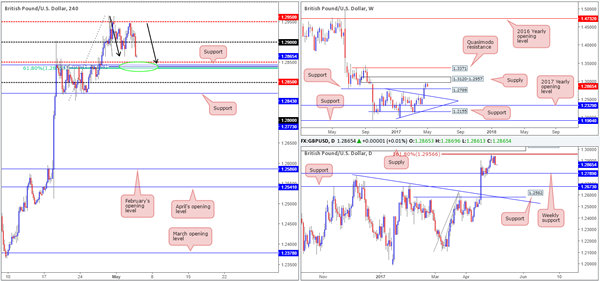
In recent trading, the 1.29 handle was taken out with price managing to reach a low of 1.2865 on the day. With 1.29 out of the picture for the moment this Fed-induced move has brought our attention down to the H4 mid-level support at 1.2850. To make a long story short, we like this region due to the following: a H4 61.8% Fib support at 1.2835, a H4 support at 1.2843 and a 127.2% AB=CD (black arrows) Fib ext. at 1.2838 (taken from the high 1.2965).
While the noted H4 area (1.2835/1.2850) is likely to produce a bounce, traders may also want to take into account that there is a weekly support seen nearby at 1.2789, a few pips below the 1.28 handle. To that end, price may want to test this level before any serious bullish move is seen.
Our suggestions: Given how small the H4 buy zone is at 1.2835/1.2850, we would strongly advise waiting for a lower-timeframe confirming signal to form before committing yourself. This could be either an engulf of supply followed by a retest as demand, a trendline break/retest or simply a collection of lower-timeframe tails seen within the H4 zone. We typically search for lower-timeframe confirmation between the M15 and H1 timeframes, since most of our higher-timeframe areas begin with the H4. Stops are usually placed 1-3 pips beyond confirming structures.
Data points to consider: UK Services PMI at 9.30am. US unemployment claims and trade balance at 1.30pm GMT+1.
Levels to watch/live orders:
- Buys: 1.2850 region ([waiting for a lower-timeframe confirming signal to form before pulling the trigger is advised] stop loss: dependent on where one confirms the area).
- Sells: Flat (stop loss: N/A).
AUD/USD
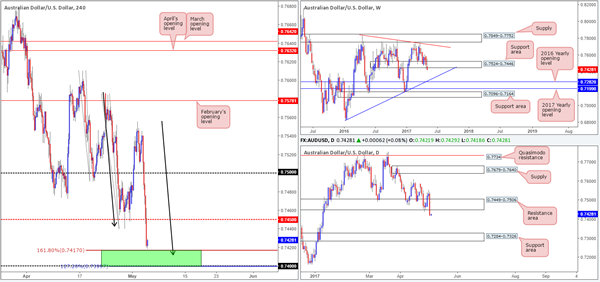
Kicking off this morning's report with a look-see at the weekly chart, the support area at 0.7524-0.7446 is currently under pressure as price is trading beyond its barriers as we write. Providing that the bears remain in the driving seat here, this could pull the commodity currency down to a trendline support etched from the low at 0.6827. Also of interest is the daily support area at 0.7449-0.7506. As you can see, the zone was wiped out in recent trading, which could imply a move down to the support area at 0.7284-0.7326 (converges with the said weekly trendline support) may be on the cards.
Aggravated by recent FOMC talks, H4 price smashed through the mid-level support at 0.7450 during yesterday's US segment, and is now seen within touching distance of a 161.8% Fib ext. at 0.7417 taken from the high 0.7610. Couple this with the nearby 0.74 handle and 127.2% AB=CD Fib ext. at 0.7399 drawn from the high 0.7586, we may have a potential reversal zone on our hands (green rectangle).
Our suggestions: Buying from the H4 green zone may be tempting, but given the recent price movement on the bigger picture (see above), our team is reluctant to commit here as we're ultimately looking to trade in line with higher-timeframe structure. So, unless we happen to see H4 price decisively close beyond 0.74 today, we will be remaining on the sidelines for the time being.
Data points to consider: Australian Trade balance at 2.30am, RBA Gov. Lowe speaks at 4.10am. US unemployment claims and trade balance at 1.30pm GMT+1.
Levels to watch/live orders:
- Buys: Flat (stop loss: N/A).
- Sells: We'll remain flat unless a H4 close is seen below 0.74.
USD/JPY
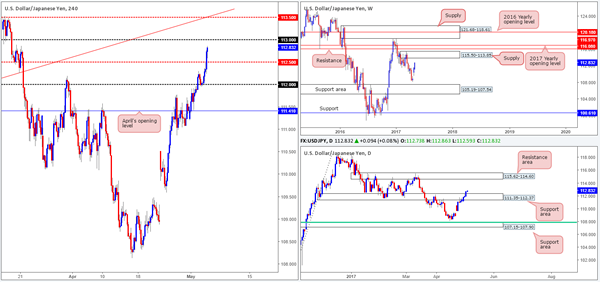
Yesterday's action shows that the US dollar surged north following the FOMC's decision to leave momentary policy unchanged. H4 price ripped through offers around the mid-level resistance at 112.50, and has left the door open for the unit to challenge the 113 handle. While some traders may be looking to fade this psychological boundary, we are not so sure. Over on the daily chart, a resistance area at 111.35-112.37 was recently engulfed and may have opened up the path north to a resistance area at 115.62-114.60. Along the same vein, weekly action shows little resistance until we reach supply at 115.50-113.85.
Our suggestions: A H4 close beyond 113 followed up with a retest and a reasonably sized H4 bullish (preferably full-bodied) candle would, in our humble opinion, be enough evidence to suggest the bulls remain in control and longs are now viable. The first take-profit target from here would be set around the H4 mid-level resistance at 113.50 which happens to converge with a H4 trendline resistance taken from the low 111.68, followed by the underside of weekly supply at 113.85.
Data points to consider: US unemployment claims and trade balance at 1.30pm GMT+1.
Levels to watch/live orders:
- Buys: Watch for H4 price to close above 113 and then look to trade any retest seen thereafter ([waiting for a reasonably sized H4 bullish candle to form following the retest is advised] stop loss: ideally beyond the candle's tail).
- Sells: Flat (stop loss: N/A).
USD/CAD
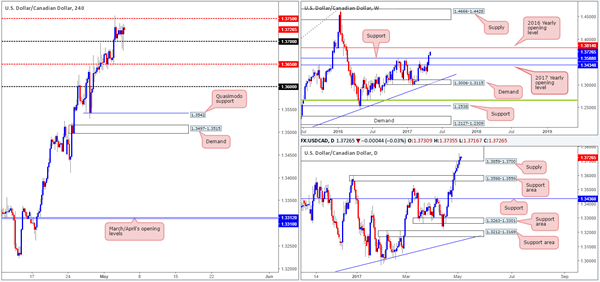
Despite the Fed taking center stage yesterday, albeit offering little surprise, the H4 candles remained confined between the 1.37 handle and the H4 mid-level resistance line at 1.3750. Although daily buyers printed their 9th consecutive bullish candle, our team's bias continues to favor the downside. Our reasoning lies within the higher-timeframe structures. Daily price has recently checked in with a supply zone penciled in at 1.3859-1.3700. And weekly flow looks poised to attack the 2016 yearly opening level at 1.3814, which happens to sit nicely within the upper limits of the said daily supply.
Our suggestions: To our way of seeing things, entering long (medium/long term) is not a viable option at present. Shorts on the other hand, are. However, given our conservative nature, we would not be looking to commit until price has connected with the above noted 2016 yearly opening level (essentially around the 1.38 region). The reason being, as mentioned above, is that this line firmly positioned within the said daily supply and thus allows the trader to conservatively place stops above this area.
Data points to consider: US unemployment claims and trade balance, along with Canadian Trade balance at 1.30pm. Also we have BoC Gov. Poloz speaking at 9.25pm GMT+1.
Levels to watch/live orders:
- Buys: Flat (stop loss: N/A).
- Sells: 1.3814/1.38 region is an ideal place for shorts since this area requires no additional confirmation (stop loss: conservative at 1.3861).
USD/CHF
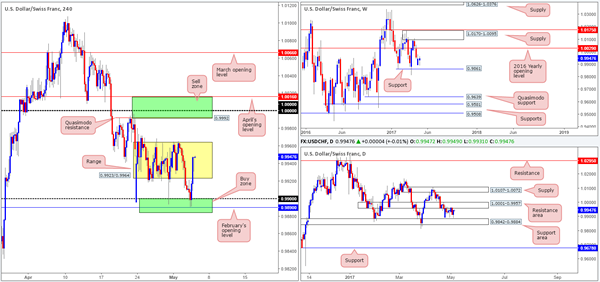
For those who read Wednesday's report on the Swissy you may recall that our team highlighted the 0.9884/0.99 H4 area as a buy zone (green rectangle). It comprised of the 0.99 handle, February's opening level at 0.9890 and the top edge of a daily support area at 0.9842-0.9884. As is evident from the H4 chart this morning, the pair bounced from this area beautifully yesterday, and is now seen trading back within its range at 0.9923/0.9964. So, well done to any of our readers who managed to catch this move!
Going forward, as we see it, there's equal opportunity to trade this pair both long and short today. For shorts, we have the 1.0016/0.9992 region, and for longs, we still believe the above noted H4 buy zone remains worthy of attention. The sell zone consists of April's opening level at 1.0016, parity (1.0000) and a H4 Quasimodo resistance at 0.9992.
In addition to the above, the H4 sell zone is bolstered by a daily resistance area at 1.0001-0.9957, and the H4 buy zone is reinforced by a daily support area coming in at 0.9842-0.9884.
Our suggestions: While both H4 zones have the ability to hold price and potentially produce a trade for us, there are some cautionary points to consider. If we were to take a long from the said H4 area, there's a chance that weekly price could potentially push the market lower to shake hands with support at 0.9861. By the same token, a short from the aforementioned H4 sell zone has a risk of being faked due to the 2016 yearly opening level seen above it at 1.0029 (see weekly chart).
As such, we are advising traders not to trade the above said zones blindly! Wait for additional confirmation either in the form of a H4 candle (preferably a full-bodied candle) or a lower-timeframe buy signal (see the top of this report).
Data points to consider: US unemployment claims and trade balance at 1.30pm GMT+1.
Levels to watch/live orders:
- Buys: 0.9884/0.99 ([waiting for a reasonably sized H4 bull candle to form before pulling the trigger is advised] stop loss: ideally beyond the candle's tail).
- Sells: 1.0016/0.9992 ([waiting for a reasonably sized H4 bear candle to form before pulling the trigger is advised] stop loss: ideally beyond the candle's wick).
DOW 30
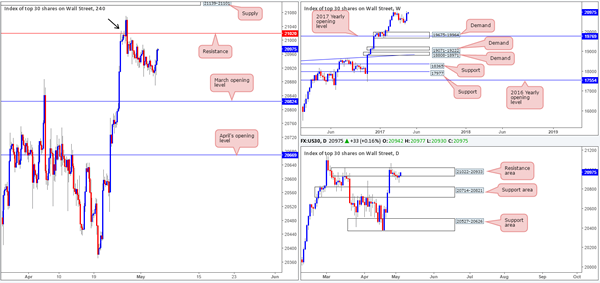
After spending the best part of a week grinding lower from the H4 resistance at 21020, US equities managed to catch a bid yesterday. Fed officials held the benchmark rates steady during yesterday's FOMC meeting, which promoted further buying on the DOW.
However, we are in a little bit of a tricky spot right now as far as the technical picture goes. On the one hand, weekly price looks poised to continue marching that could eventually see the market reach a new record high. On the other hand, daily price remains capped by a resistance area at 21022-20933. In addition to this, the H4 candles shows the resistance mentioned above at 21020 unites beautifully with a Quasimodo left shoulder marked with a black arrow at 21028.
Our suggestions: Trading short from the aforementioned H4 resistance is tempting. With that said, however, we do not favor trading against potential weekly buyers who are likely looking to punch higher. On that account, we will continue to remain flat in this market today and look to reassess our position going into tomorrow's open.
Data points to consider: US unemployment claims and trade balance at 1.30pm GMT+1.
Levels to watch/live orders:
- Buys: Flat (stop loss: N/A).
- Sells: Flat (stop loss: N/A).
GOLD
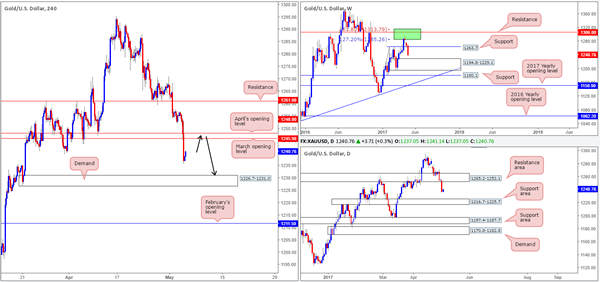
On the back of yesterday's dollar strength, the gold market took a hit to mid-section and lost over $18 in value. If you look on the weekly chart, this has placed the unit within striking distance of demand penciled in at 1194.8-1229.1. Along similar lines, daily flow also looks like it wants to interact with a support area seen at 1216.7-1225.7, which happens to be positioned within the walls of the said weekly demand base.
Jumping across to the H4 chart, both April's opening base line at 1248.0 and March's opening base line at 1245.9 were taken out yesterday, with price reaching a low of 1235.7 on the day. To our way of seeing things, downside is now relatively clear to demand coming in at 1226.7-1231.0. Given this and the higher-timeframe picture (see above), we feel shorts from the 1248.0/1245.9 region (the two said monthly levels) are high probability.
Our suggestions: Seeing as how the 1248.0/1245.9 area is relatively tight, we would advise traders who are looking to short here not to place pending orders. Instead, wait for a reasonably sized H4 bearish candle to form – a full-bodied candle would be ideal – before looking to commit. The take-profit target for this trade should be obvious: the H4 demand base at 1226.7-1231.0, since it sits around the top edge of weekly demand and is located just above the daily support area.
Levels to watch/live orders:
- Buys: Flat (stop loss: N/A).
- Sells: 1248.0/1245.9 ([waiting for a reasonably sized H4 bear candle to form before pulling the trigger is advised] stop loss: ideally beyond the candle's wick).
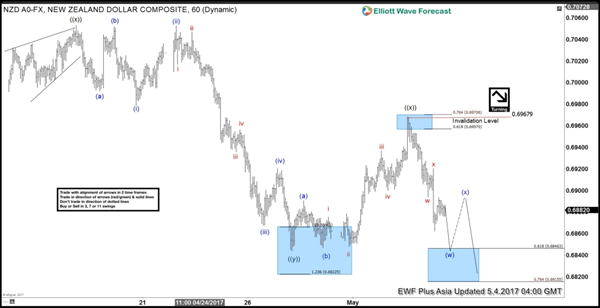
Elliott Wave View: NZDUSD Correction Ended
Revised Elliott Wave view in NZDUSD suggests the decline from 3/21 high (0.709) is unfolding as a triple three Elliott Wave structure where Minute wave ((w)) ended at 0.6905, Minute wave ((x)) ended at 0.7053, Minute wave ((y)) ended at 0.6844 and Minute second wave ((x)) is proposed complete at 0.6968. Minute wave ((z)) is in progress and unfolding as a double three Elliott Wave structure where Minutte wave (w) is expected to complete at 0.6815 – 0.6846 area, then it should bounce in Minutte wave (x) to correct cycle from 5/2 high before pair resumes lower again. We don’t like buying the pair and expect bounces in Minutte wave (x) to find sellers in 3, 7, or 11 swing provided that pivot at 0.6968 high remains intact.
NZDUSD 1 Hour Elliott Wave Chart
European Open Briefing: The Federal Reserve Kept Rates Unchanged
Global Markets:
- Asian stock markets: Shanghai Composite down 0.10 %, Hang Seng fell 0.40 %, ASX 200 lost 0.50 %, Nikkei closed for holiday
- Commodities: Gold at $1241 (-0.60 %), Silver at $16.65 (+0.60 %), WTI Oil at $47.70 (-0.20 %), Brent Oil at $50.70 (-0.20 %)
- Rates: US 10-year yield at 2.32, UK 10-year yield at 1.08, German 10-year yield at 0.34
News & Data
- Australia Trade Balance (AUD) Mar: 3107M (exp 3250M; prev 3574M)
- Australia Exports (MoM) Mar: 2.0% (prev 1.0%)
- Australia Imports (MoM) Mar: 5.0% (prev -5.0%)
- Australia HIA New Home Sales (MoM) Mar: -1.1% (prev 0.2%)
- New Zealand ANZ Job Advertisements (MoM) Apr: 2.8% (prev 1.6%; prev rev 2.0%)
- New Zealand ANZ Commodity Price Index (MoM) Apr: -0.2% (prev 0.4%)
- South Korea BoP Current Account Balance (USD) Mar: 5931.8M (prev 8400.2M)
- PBoC Fixes USDCNY Reference Rate At 6.8957 (prev fix 6.8892 prev close 6.8985)
- Asian stocks retreat, dollar holds near six-week high on hawkish Fed – RTRS
- Fed holds interest rates steady, downplays economic weakness – RTRS
Markets Update:
The Federal Reserve kept rates unchanged, as expected. However, the statement was perceived as more hawkish than expected, as the central bank downplayed weakness in the first-quarter economic growth. This is a hint that a rate hike in June seems quite likely.
The Dollar appreciated post-FOMC, especially against the emerging market currencies. Amongst the major pairs, the commodity currencies felt most of the pressure. AUD/USD fell from 0.7470 to a low of 0.74 in Asia. Further losses to at least 0.73 seem likely in the near-term. Similar price action was seen in NZD/USD, which reversed at 0.6970 yesterday and fell to a low of 0.6870 after the FOMC.
The reaction in EUR and GBP was rather mild. EUR/USD only declined to 1.0880, and then continued with its consolidation. Meanwhile, USD/JPY caught up on momentum. The pair rallied to 112.90 in Asia. A clear break above 113 would suggest that a rally towards 115 could follow.
Upcoming Events:
- 08:45 BST – Italian Services PMI
- 08:50 BST – French Services PMI
- 08:55 BST – German Services PMI
- 09:00 BST – Euro Zone Services PMI
- 09:30 BST – UK Services PMI
- 10:00 BST – Euro Zone Retail Sales
- 13:30 BST – US Trade Balance
- 13:30 BST – Canadian Trade Balance
- 15:00 BST – US Factory Orders
- 17:30 BST – ECB President Draghi speaks
- 21:25 BST – BoC Governor Poloz speaks
Australia’s Trade Surplus Sharply Narrowed In March
For the 24 hours to 23:00 GMT, the AUD declined 1.49% against the USD and closed at 0.7426.
LME Copper prices declined 1.9% or $110.0/MT to $5636.5/MT. Aluminium prices rose 0.4% or $7.0/MT to $1916.0/MT.
In the Asian session, at GMT0300, the pair is trading at 0.7411, with the AUD trading 0.2% lower against the USD from yesterday's close.
Earlier today, data showed that Australia's seasonally adjusted trade surplus narrowed more-than-expected to a level of A$3107.0 million in March, following a revised surplus of A$3657.0 million in the previous month, while market participants had envisaged for a surplus of A$3250.0 million. Further, the nation's HIA new home sales dropped 1.1% on a monthly basis in March. In the prior month, new home sales had recorded a rise of 0.2%.
Meanwhile, the Reserve Bank of Australia's (RBA) Governor, Philip Lowe, stated that surging household debt levels has led the economy in a weaker position to deal with shocks.
Elsewhere, in China, Australia's largest trading partner, the Caixin/Markit services PMI fell to a level of 51.5 in April, expanding at its weakest pace in eleven months, thus casting fresh doubts over the health of the nation's economy. The PMI had registered a reading of 52.2 in the previous month.
The pair is expected to find support at 0.7368, and a fall through could take it to the next support level of 0.7325. The pair is expected to find its first resistance at 0.7489, and a rise through could take it to the next resistance level of 0.7567.
Moving ahead, traders will keep a close watch on the RBA's recent meeting statement coupled with Australia's AiG performance of construction index for April, due to release overnight.
The currency pair is trading below its 20 Hr and 50 Hr moving averages.

Euro-Zone’s Economy Continued To Grow In The First Quarter Of 2017
For the 24 hours to 23:00 GMT, the EUR declined 0.38% against the USD and closed at 1.0888.
On the economic front, the Euro-zone's seasonally adjusted flash gross domestic product (GDP) rose 0.5% on a quarterly basis in the first quarter of 2017, meeting market expectations, thus supporting the notion that the economy is getting back on track again. In the prior quarter, GDP had climbed by a revised 0.5%.
Elsewhere, in Germany, the seasonally adjusted unemployment rate remained steady at 5.8% in April, in line with market expectations.
The greenback traded higher against a basket of currencies after the US Federal Reserve (Fed) left the door open for a June interest rate hike.
The Fed, at its latest monetary policy meeting, opted to leave key interest rate unchanged in a range from 0.75% to 1.0%. In the statement accompanying the decision, the Fed played down weak first-quarter economic growth in US, stating that the recent slowdown was “likely to be transitory” and emphasised the strength of the nation's labour market and consumer spending. Moreover, the central bank characterised inflation as “running close to the central bank's 2.0% target.”
Earlier in the session, the greenback strengthened against its major counterparts, on the back of upbeat US economic data.
The US ISM non-manufacturing PMI advanced more-than-anticipated to a level of 57.5 in April, compared to market consensus for a rise to a level of 55.8 and following a level of 55.2 in the previous month. Also, the nation's final Markit services PMI unexpectedly climbed to a level of 53.1 in April, after recording a drop to a level of 52.5 in the preliminary print and compared to a reading of 52.8 in the previous month.
Other economic data showed that the US private sector employment increased by 177.0K in April, surpassing market expectations of an advance of 175.0K. However, it was the smallest gain since October 2016. The private sector employment had registered a revised gain of 255.0K in the previous month. In contrast, the nation's MBA mortgage applications eased 0.1% in the week ended 28 April 2017. Mortgage applications had risen 2.7% in the prior week.
In the Asian session, at GMT0300, the pair is trading at 1.0891, with the EUR trading slightly higher against the USD from yesterday's close.
The pair is expected to find support at 1.0868, and a fall through could take it to the next support level of 1.0846. The pair is expected to find its first resistance at 1.0924, and a rise through could take it to the next resistance level of 1.0958.
Moving ahead, investors will closely monitor the final print of Markit services PMI for April across the Euro-zone along with the Euro-zone's retail sales data for March, slated to release in a few hours. A speech by the ECB President, due later in the day, will also be eyed by traders. Additionally, the US trade balance, final durable goods orders and factory orders, all for March, set to release later today, will garner significant amount of market attention.
The currency pair is trading below its 20 Hr and 50 Hr moving averages.
