

Sample Category Title
UK’s Construction Sector Growth Surprisingly Hits 4-Month High In April
For the 24 hours to 23:00 GMT, the GBP declined 0.53% against the USD and closed at 1.2868.
Macroeconomic data indicated that activity in Britain's construction sector unexpectedly advanced to a level of 53.1 in April, hitting its highest level in four-months, suggesting that the economy might be recovering a bit, after showing a lacklustre performance at the start of 2017. Market participants anticipated the PMI to drop to a level of 52.0, compared to a level of 52.2 in the previous month.
In the Asian session, at GMT0300, the pair is trading at 1.2876, with the GBP trading 0.06% higher against the USD from yesterday's close.
The pair is expected to find support at 1.2841, and a fall through could take it to the next support level of 1.2806. The pair is expected to find its first resistance at 1.2929, and a rise through could take it to the next resistance level of 1.2982.
Looking ahead, investors will concentrate on UK's Markit services PMI for April accompanied with net consumer credit and mortgage approvals, both for March, slated to release in a few hours.
The currency pair is trading below its 20 Hr and 50 Hr moving averages.

Japanese Yen Trading On A Weaker Footing This Morning
For the 24 hours to 23:00 GMT, the USD rose 0.63% against the JPY and closed at 112.68.
In the Asian session, at GMT0300, the pair is trading at 112.77, with the USD trading 0.08% higher against the JPY from yesterday’s close.
The pair is expected to find support at 112.19, and a fall through could take it to the next support level of 111.61. The pair is expected to find its first resistance at 113.12, and a rise through could take it to the next resistance level of 113.47.
Amid a holiday on account of Greenery day in Japan today, trading trend in the JPY is expected to be determined by global macroeconomic factors.
The currency pair is trading above its 20 Hr and 50 Hr moving averages.

Swiss Franc Trading Marginally Lower, Ahead Of Swiss SECO Consumer Confidence Data
For the 24 hours to 23:00 GMT, the USD rose 0.29% against the CHF and closed at 0.9942.
In the Asian session, at GMT0300, the pair is trading at 0.9944, with the USD trading slightly higher against the CHF from yesterday’s close.
The pair is expected to find support at 0.9905, and a fall through could take it to the next support level of 0.9866. The pair is expected to find its first resistance at 0.9966, and a rise through could take it to the next resistance level of 0.9988.
Going ahead, Switzerland’s SECO consumer confidence index for April, due to release in a while, will be on investors’ radar.
The currency pair is trading above its 20 Hr and 50 Hr moving averages.

Loonie Trading Higher In The Morning Session
For the 24 hours to 23:00 GMT, the USD rose 0.18% against the CAD and closed at 1.3729.
In the Asian session, at GMT0300, the pair is trading at 1.3721, with the USD trading 0.06% lower against the CAD from yesterday’s close.
The pair is expected to find support at 1.3685, and a fall through could take it to the next support level of 1.365. The pair is expected to find its first resistance at 1.3748, and a rise through could take it to the next resistance level of 1.3776.
Ahead in the day, traders will look forward to Canada’s international merchandise trade balance data for March.
The currency pair is showing convergence with its 20 Hr moving average and trading above its 50 Hr moving average.

Foreign Exchange Market Commentary: EUR/USD, USD/JPY, GBP/USD, GOLD, WTI CRUDE, DJIA, FTSE100, DAX
EUR/USD
The EUR/USD pair ended the day again around 1.0900 after one of the most uneventful Fed's monetary policy meeting. The Central Bank left rates unchanged, while acknowledging weakness during the first quarter, but seeing it as 'transitory'. The accompanying statement didn't provide much clues on what or when the Fed will move next, while maintaining the overall positive outlook of the local economy.
In the macroeconomic front, news were soft in Europe, as the preliminary Q1 GDP reading came in as expected at 0.5%, but the producer price index fell by 0.3% in March, against previous 0.0% and worse than the -0.1% expected. In the US however, the ADP employment survey showed that the private sector added 177,000 new jobs in April, in line with market's forecast. Also in the US, the private sector grew at a strong pace according to the official and Markit services PMIs, both surpassing previous months' readings and expectations.
With the Fed out of the picture, market's attention now shifts to the French presidential debate between Marine Le Pen and Emmanuel Macron. The televised debate is expected to last over two hours, and take place after the Asian opening. With latest polls showing centrist candidate Macron taking the lead, there is a good chance that if he stands victorious, the EUR will likely keep on rallying on relief.
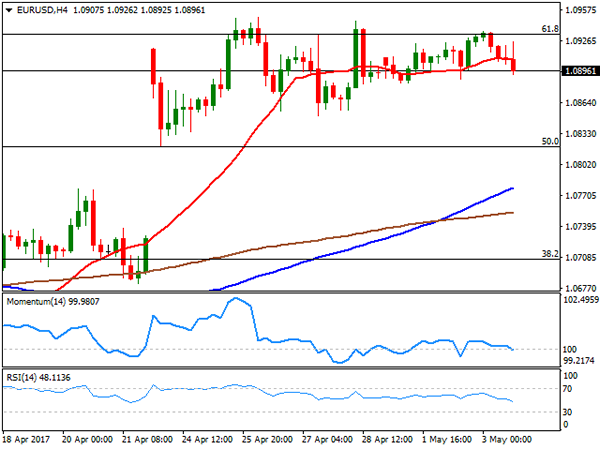
From a technical point of view, the pair retains a neutral stance, given that in the 4 hours chart, the price continues hovering around a directionless 20 SMA, whilst technical indicators head nowhere within neutral territory. The pair needs to clearly break either above 1.0950, or below 1.0820, to gather some directional momentum that could persist into the following sessions.
Support levels: 1.0855 1.0820 1.0785
Resistance levels: 1.0950 1.1000 1.1045
USD/JPY
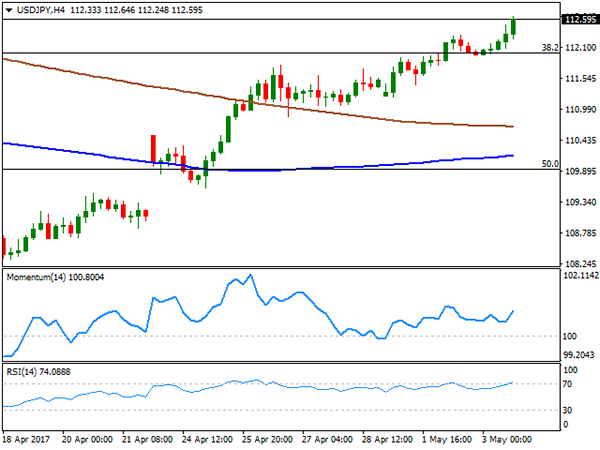
The USD/JPY pair advanced up to 112.64, its highest since March 21st, and settled a few pips below the level, backed by strong US data released earlier on the day and a modest recovery in US Treasury yields. A firm ADP survey, in line with market's expectations, and steady growth in the services sector in the US, kept the pair firm above the 112.00 level at the beginning of the day, while after trading softly for most of session, yields advance following Fed's announcement, with the 10-year benchmark regaining the 2.30% threshold. The pair's advance stalled around 112.60, where it has the 100 DMA. The price has been developing below the indicator ever since mid March, and a firmer recovery above it will likely anticipate a steeper recovery during the upcoming sessions. Short term, the 4 hour chart shows that the RSI indicator holds around 74, while the Momentum indicator also heads north well above its mid-line. Additionally, the 100 SMA keeps advancing below the 200 SMA, both far below the current level.
Support levels: 112.45 112.00 111.60
Resistance levels: 112.90 113.30 113.80
GBP/USD
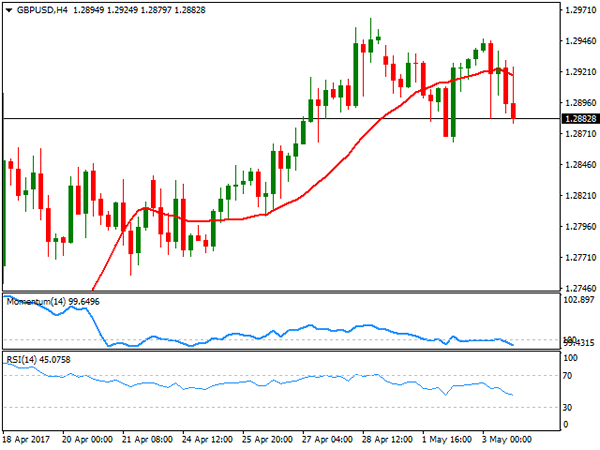
The GBP/USD pair trimmed all of its Tuesday gains and closed the day around its low of 1.2879, as the greenback advanced marginally following the Fed's monetary policy announcement. In fact, the US Central Bank offered little to work with, as it kept rates, and the economic outlook unchanged, without hinting next moves. The Pound traded as high as 1.2947 early London, as the UK Markit Construction PMI reached 53.1 in April, from 52.2 in March. The reading came after strong manufacturing index earlier on the week, and ahead of the Services PMI to be released this Thursday. From a technical point of view, and despite still within a well limited range the GBP/USD upward momentum seems to be fading, as in the daily chart, technical indicators are retreating from overbought territory, heading modestly lower at two-week lows. In the shorter term, and according to the 4 hours chart the pair is biased lower, declining below a flat 20 SMA that offers a dynamic resistance around 1.2930, while technical indicators accelerate south within bearish territory, also at fresh 2-week lows.
Support levels: 1.2880 1.2830 1.2795
Resistance levels: 1.2965 1.3010 1.3060
GOLD
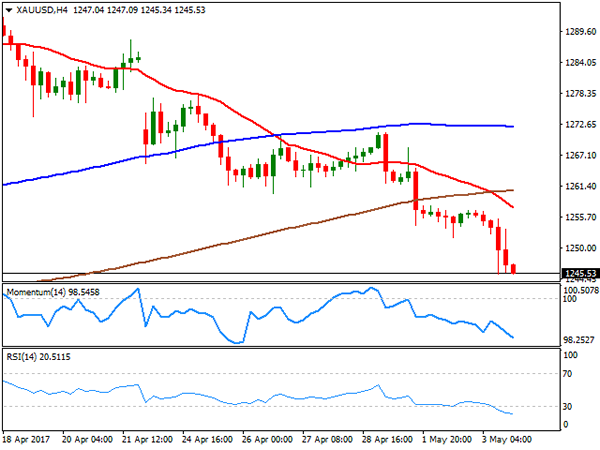
Spot gold settled at $1,245.50 a troy ounce, its lowest settlement since late March, after the US Federal Reserve's monetary policy statement suggested that policymakers are still confident over the economic recovery, and therefore fueling speculation that the year will bring two more rate hikes. Odds for a June move rose slightly above 70% after the statement that anyway provided no clear clues. From a technical point of view, the commodity retains the negative tone seen on previous updates, with the price accelerating further below a now horizontal 20 SMA, and the RSI indicator heading sharply lower around 39. In the same chart, the 100 and 200 SMAs, converge around 1,234.60, providing a critical dynamic support, as a break below it will probably trigger additional slides. In the shorter term, and according to the 4 hours chart, the 20 SMA heads sharply lower above the current level and after breaking below the 100 and 200 SMAs, whilst technical indicators maintain their sharp bearish slopes, despite being in oversold territory, in line with the longer term perspective.
Support levels: 1,242.50 1,234.60 1,226.90
Resistance levels: 1,249.80 1,260.00 1,272.05
WTI CRUDE OIL
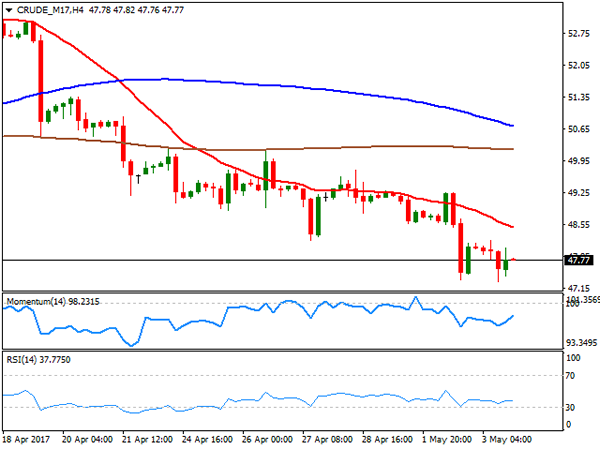
Crude oil prices extended their weekly decline, with West Texas Intermediate crude futures settling around $47.70 a barrel, undermined by dollar's broad strength and a disappointing EIA report, as US stockpiles declined by less than expected. According to the Energy Information Administration, crude stocks fell by 930,000 barrels in the week ended April 28, below market's expectations of a 2.9 million decline. Earlier on the day, the commodity attempted to advance, as the API report released late Tuesday showed a sharp drop in US oil and gasoline stocks, but WTI was unable to recover the 48.00 level. The daily chart for US oil continues supporting additional slides ahead, as the price is further below its moving averages, as technical indicators enter oversold territory. In the 4 hours chart, the price is further below a bearish 20 SMA, this last providing a dynamic resistance at 48.50, while technical indicators hold within bearish territory, with no clear directional strength.
Support levels: 47.10 46.60 46.00
Resistance levels: 47.90 48.50 49.20
DJIA
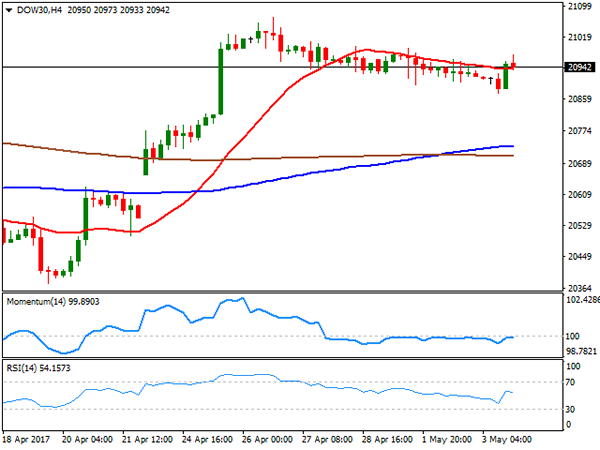
US indexes trimmed most of its intraday losses after a confident Fed, with major indexes closing mixed, not far from their daily opening levels. The Dow Jones Industrial Average managed to settle 8 points higher at 20,957.90, while the Nasdaq and the S&P closed lower, with the first shedding 22 points, to 6,072.55 and the second down 0.13% to 2,388.13. Within the Dow, Merck was the best performer, ending the day up 1.48%, followed by Chevron that gained 1.29%. Disney led decliners, shedding 2.43%, while El du Pont closed 1.18% lower. The benchmark kept trading within a narrow intraday range, unable to establish a clear direction. In the daily chart, the index holds well above its moving averages, while the RSI indicator hovers around 61, as the Momentum indicator eases within positive territory, rather as a consequence of the absence of directional strength that a sign of upcoming weakness. In the 4 hours chart, the index settled a few points above its 20 SMA, but technical indicators have returned to their usual neutral stance after a short-lived intraday slide.
Support levels: 20,913 20,869 20,819
Resistance levels: 20,989 21,035 21,071
FTSE100
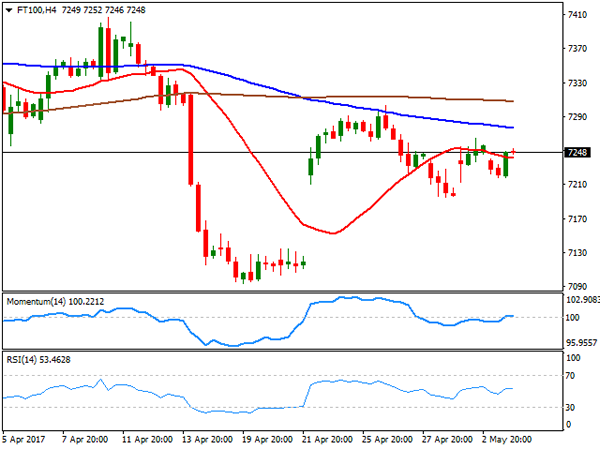
The FTSE 100 closed the day at 7,234.53, down 15 points, hit by lower metals prices that kept mining-related equities in the red. Sainsbury led decliners, plunging 5.72% after reporting a 0.6% fall in full-year like-for-line sales, and cutting dividends by 16%. Among the worst performers were also Glencore, down 3.71%, and Anglo American that shed 3.20%. Only 39 members managed to close in the green, with Sage Group being the best performer, up 3.44%. Mounting Brexit concerns, on market rumors suggesting the EU will demand up to €100bn in payments from the UK, also weighed on investors' mood. The index recovered some ground in after-hours trading, but the daily chart shows that it holds below a bearish 20 SMA, whilst technical indicators hold flat within negative territory, maintaining the risk towards the downside. In the 4 hours chart, the index hovers around a modestly bearish 20 SMA while technical indicators have also turned flat around their mid-lines, limiting chances of a stronger advance.
Support levels:7,215 7,173 7,126
Resistance levels: 7,264 7,303 7,340
DAX
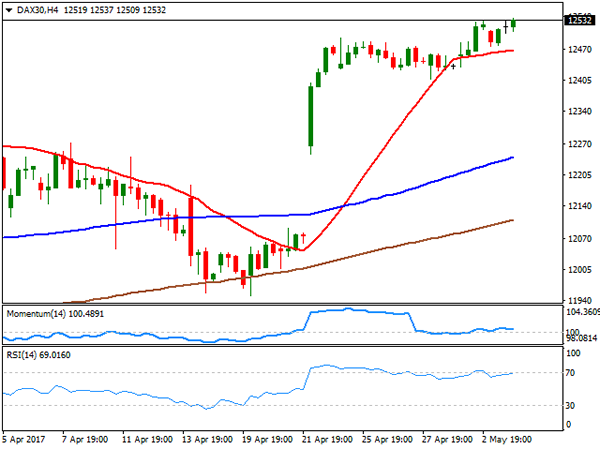
Major European benchmarks closed generally lower, although the German DAX managed to advance 20 points to 12,527.84, backed on strong local employment data. Fresenius lead advancers, adding 2.42%, while banks also made it to the top ten list, with Commerzbank adding 1.42% ad Deutsche Bank 1.18%. E.ON was the worst performer, down 1.62%, followed by Volkswagen that shed 0.94%, with most auto-makers closing in the red after disappointing April auto sales in the US. The index holds near fresh multi-month highs ahead of the Asian opening, retaining the bullish bias in the daily chart, as technical indicators advanced within positive territory as the benchmark keeps developing above all of is moving averages. In the 4 hours chart, the technical outlook is neutral-to-bullish, as the index held above its 20 SMA that anyway remains flat, whilst the Momentum indicators hovers around its 100 level, but the RSI indicator resumed its advance, heading north around 69.
Support levels: 12,495 12,440 12,391
Resistance levels: 12,537 12,580 12,625
FOMC Sent Important Rate Hike Hint In An Apparently-Uneventful Meeting
As widely anticipated, the FOMC left the target range for the Fed funds rate unchanged at between 0.75- 1%. Although the accompanying statement was largely unchanged from the previous month, the implications were important in light of the slowdown in the first quarter. While acknowledging the recent weakness in growth and inflation, policymakers attributed it to 'transitory effects'. The downplaying of 1Q17's disappointments underpinned the Fed's determination to carry on its normalization plan. The FOMC maintained its economic outlook and the gradual rate-hike approach. We continue to expect two more rate hikes this year with one coming in June.
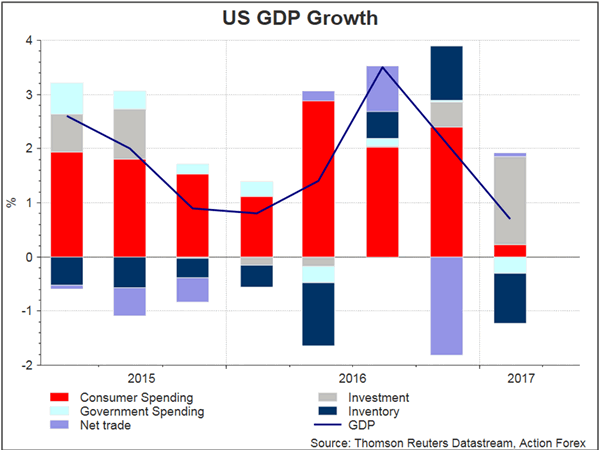
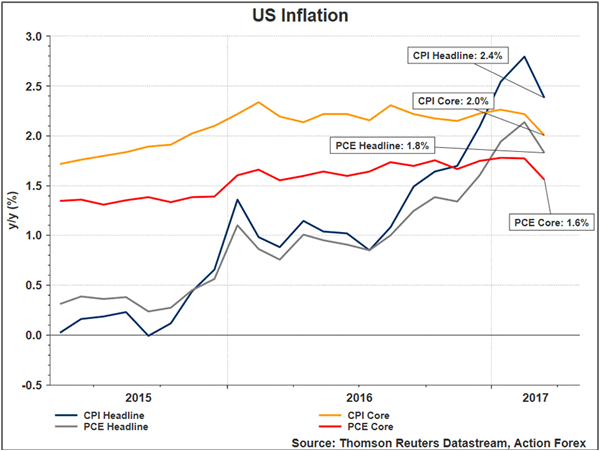
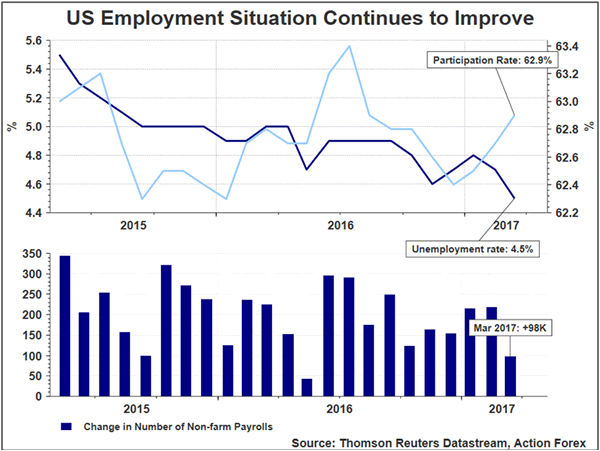
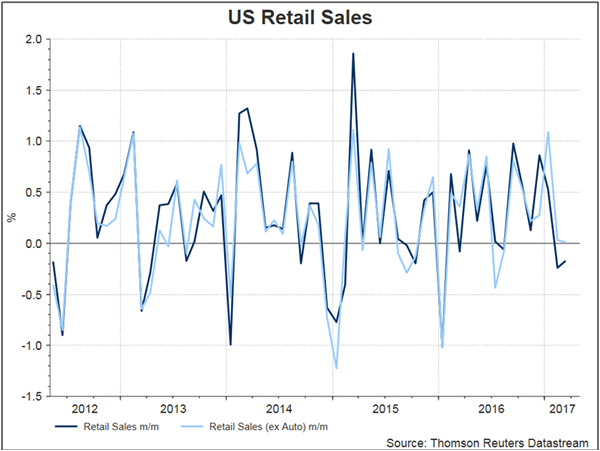
It is undeniable that US macroeconomic indicators surprised to the downside in 1Q17: GDP expanded at a modest +0.7%, core CPI fell -20 bps to 1.6% y/y since the previous meeting, while consumer spending rose only modestly. The FOMC acknowledged all these weaknesses. As suggested in the statement, the central bank noted that 'growth in economic activity slowed' during the intermeeting period. Yet, it pointed out that 'the labor market has continued to strengthen', 'job gains were solid, on average, in recent months, and the unemployment rate declined'. It acknowledged that 'household spending rose only modestly, but the fundamentals underpinning the continued growth of consumption remained solid'. The statement affirmed that 'the slowing in growth during the first quarter as likely to be transitory'. Yet, policymakers used a less strong tone in stressing that the inflation weakness was transitory. As noted in the statement, the Fed indicated that 'excluding energy and food, consumer prices decline in March and inflation continued to run somewhat below 2%'. The Fed continued to guide that monetary accommodation should support 'a sustained return to 2% inflation'. Overall, near-term risks to the economic outlook appeared 'roughly balanced' and the members would continue to 'closely monitor inflation indicators and global economic and financial developments'.
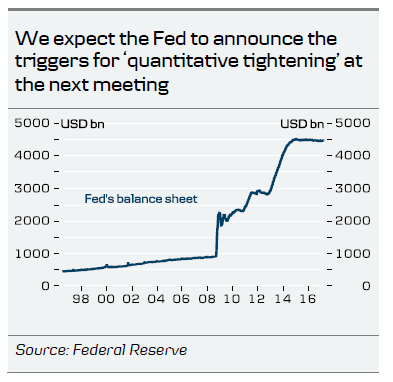
The approach of the Fed's rate hike schedule would remain 'gradual adjustments' and 'gradual increases'. Guidance on the reinvestment policy stayed unchanged with the FOMC reiterating that the reinvestment would continue 'until normalization of the level of the Fed funds rate is well under way'. Despite heightening speculations that the Fed would begin unwinding its balance sheet (worth of US$ 4.5 trillion) later this year, the Fed refrained from offering any hints on this issue. The Fed's stance to looking through the soft data in the first quarter signals its inclination to hike rate in June. Certainly, any action would be data-dependent but the bar seems to be high for the Fed to decide not raise the policy rate in the coming month. Explicit guidance of the balance sheet normalization would unlikely come unless the members have reached a consensus on the scaling-back of redemptions and the balance on the mix of Treasury securities and MBS in its portfolio.
Market Morning Briefing: The Fed Kept The Rates Unchanged
STOCKS
The stock markets are al stable and no fresh impact is seen after the FOMC yesterday as it kept rates unchanged and reiterated its maintenance of the existing policy.
Dow (20957.90, +0.04%) is finding some difficulty to move above 20980 just now. The index could possibly test levels near 20800 before bouncing back towards 21000-21200 in the medium term. Note important resistances seen near 21200 and 21400 respectively.
Dax (12527.84, +0.16%) is slowly inching up towards 12550-12600 levels from where a short dip could be possible. The channel on the daily charts are holding well for now.
Shanghai (3126.44, -0.28%) lacks the upward momentum required to take it above 3160 and while trading below, it could test 3100 or even lower in the coming sessions. But note important channel support on the 3-day charts which of holds could lead to a sharp rise in the longer run.
Nifty (9311.95, -1.85%) could spend the rest of the week in the 9300-9400 levels and a fresh move could be expected next week. Note 9400 is an important resistance and is expected to hold in the medium term.
COMMODITIES
Bullion had moved lower due to recent strength in Dollar Index and trading near their key support areas. Gold (1241) is hovering around its crucial support of 1239. We might see some corrective bounce towards 1260 due to short term oversold condition. A close below 1235 could open up 1220 and 1200 as well.
Silver (16.43) is highly Oversold on the near-term charts and trading within the range of 15.73-16.94.The bias will remain bearish while it is trading below 17.50 levels.
Copper (2.52) had failed to close above 2.62 levels and came down in line with our expectation. Current trading range could be 2.45-2.54. There are supports at current levels of 2.50-52 which may hold for few days but a close below that could open up 2.45 levels as well.
Brent (51.73) and WTI (47.70) both had moved lower in line with our expectation. They are within their trading ranges of 50 -52. and 46.20 – 48.80 respectively. Brent may consolidate within these levels for few more sessions though the possibility of a corrective bounce towards resistance can't be ruled out. We will remain bearish while Brent and WTI are trading below 53 and 51 levels respectively.
FOREX
The Fed kept the rates unchanged and shrugged off the poor first quarter weakness in US (0.7% annualized). The June rate hike odds have jumped from 70% to 90%, strengthening the Dollar in the process.
Boosted by the continued Fed confidence in the economy, Dollar Index (99.32) has rallied to test our resistance area of 99.35-50 but yet to rise above it to confirm the near term reversal. It's a tough and go situation right now for Dollar and a similar situation is seen for Dollar Yen (112.80) which is trading close to the immediate resistance of 112.90-113.00. The pair is already enjoying the longest rally in 2017 from 108.10 to the current swing high of 112.89 and it should be clear in a day or two if the rally is to continue or reverse to the downside.
Euro (1.0892) has corrected a bit due to the recovery in Dollar Index but it isn't too affected yet as the correction remains shallow so far. The near term strength remains intact as long as it trades above 1.0850.
Pound (1.2874) is consolidating at the higher levels but it may bounce back towards 1.3000 in the next couple of sessions if the immediate support of 1.2830 holds.
Aussie (0.7418) has fallen in a much sharper way than previously expected as the largest decline in Copper (2.538) since 2015 has affected the currency (Check Commodities section). Immediate support comes at 0.7380-70 which must hold to keep any chances of a bounce open.
Dollar-Rupee (64.15) may test 64.00 with a maximum extension to 63.80 before rallying towards 64.20 and higher this month. Immediate downside below 63.80 is not preferred for Dollar-Rupee in the near term.
INTEREST RATES
The US yields could remain stable and move sideways in the near term. The 5yr (1.86%) could move to 1.9% and then come back towards 1.80% while the 10yr (2.32%) could rise towards 2.4%. The 30yr (2.97%) could come down to test support near 2.9% before again moving higher in the longer run.
The Japan-Us 10Yr (2.30%) is rising for the past couple of sessions and in case it rises above 2.32%, we could see some Yen weakness against the US Dollar going forward. Else the yield spread could come off towards 2.2%.
The UK-US 10Yr (-1.25%) is coming off and is likely to move down towards -1.235 or lower in the near term, indicating that the upside for pound could be limited in the coming sessions.
FOMC Review: Fed Thinks Weak GDP Growth In Q1 Was ‘Transitory’
As expected, the Fed's May meeting was quite dull in the sense that we did not get any new information. The fed funds target range was maintained at 0.75%-1.00% and since it was one of the small meetings without updated projections or a press conference, we only got the meeting statement, which was more or less unchanged from the last meeting in March (also as expected). Most interesting is that the Fed thinks the weak GDP growth of 0.7% q/q AR in Q1 was 'likely to be transitory'. The Fed still expects growth to continue at a moderate pace leading to further labour market tightening and inflation to stabilise around 2%. Near-term risks to the economic outlook still appear 'roughly balanced'. It will be more interesting to listen to the upcoming Fed speeches for their views.
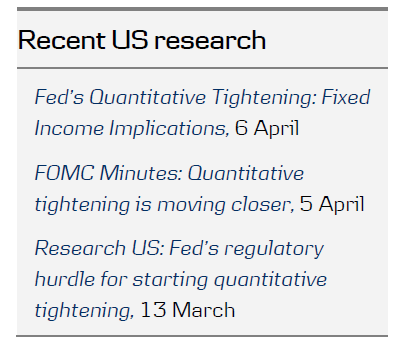
While consensus is that the Fed will hike at the June meeting, we are more sceptical, because of the weaker economic data as well as still too low inflation in the US and the Fed's desire to begin reducing the balance sheet soon, which we call 'quantitative tightening' (QT). We think the Fed wants to send up a trial balloon in June by announcing what conditions would trigger a change in its current reinvestment strategy in order to avoid a new round of 'taper tantrum'. We have written extensively about the QT theme this year: Fed's Quantitative Tightening: Fixed Income Implications, 6 April, FOMC Minutes: Quantitative tightening is moving closer, 5 April and Research US: Fed's regulatory hurdle for starting quantitative tightening, 13 March. We think actual quantitative tightening will start in Q1 18.
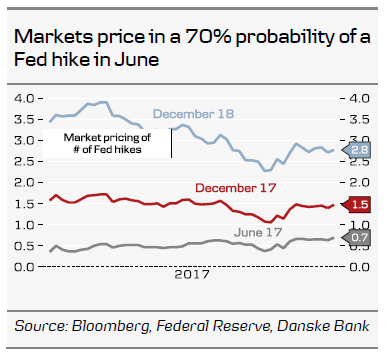
We expect the Fed to hike in July and December and three to four times next year (although the outlook, especially for next year, has become more uncertain, as it depends both on the Fed's strategy on quantitative tightening and Trump's ability to deliver on Trumponomics). Markets price in 1.4 more hikes this year and 2.8 more hikes by year-end 2018. Markets price in a 70% probability of a Fed hike in June.
EUR/USD edged slightly lower and below the 1.09 level on the somewhat dull FOMC statement, which notably did not include any new hints on 'quantitative tightening'. Thus the Fed has yet to test FX market sensitivity to this issue for real. Indeed, the combination of the Fed shrinking its balance sheet and hiking will be a challenge communication-wise, insofar as the Fed wishes to avoid swift tightening of financial conditions including a stronger USD. For EUR/USD, focus in the coming months will be on both Fed and the ECB adopting slightly less accommodative stances, i.e. Fed addressing its reinvestment policy and delivering another hike while, at the same time, the ECB is likely to amend its introductory statement to signal that rates will not go lower from here. We still look for the cross to stick - by and large - to the 1.06-1.10 range in 1-3M. Near term, the next focal point for USD crosses will be Friday's job report where we see a risk of somewhat downbeat readings on both payrolls and earnings; should this hold true, it could - coupled with a muted relief rally in the cross on a Macron win - lead EUR/USD to test the 1.10 level, however.
CRUDE OIL – Vulnerable Short Term
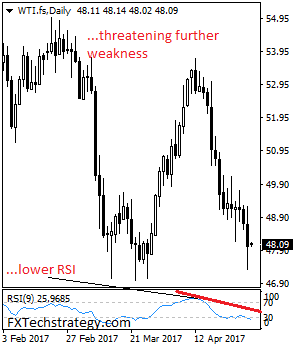
CRUDE OIL - With the commodity remaining weak and vulnerable , more decline is expected in the days ahead. Though with caution. On the downside, support resides at the 48.00 level where a break will expose the 47.50 level. A cut through here will set the stage for a run at the 47.00 level. Further down, support resides at the 46.50 level. Its daily RSI is bearish and pointing lower supporting this view. On the upside, resistance resides at the 50.00 level. Further out, resistance comes in at the 50.50 level. A break above here will aim at the 51.00 level and then the 51.50 level followed by the 52.00 level. All in all, CRUDE OIL remains biased to the downside.
Aussie Rejected Off Resistance
Remember this set of Aussie resistance levels that we had been watching?
With this latest round of Aussie Dollar weakness, I wanted to feature one set of touches across both AUD/USD and AUD/CAD. Did you trade the level?
First up, we have the AUD/USD Daily:
AUD/USD Daily:
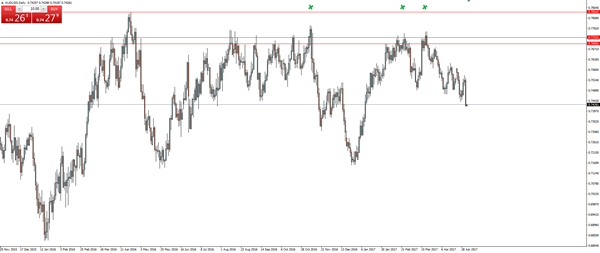
After stepping down following the textbook technical structure on the weekly, AUD/USD has bottomed out and found some serious resistance at the most recent higher time frame swing low.
Keep that chart open…
Next up, we come to AUD/CAD Daily:
AUD/CAD Daily:
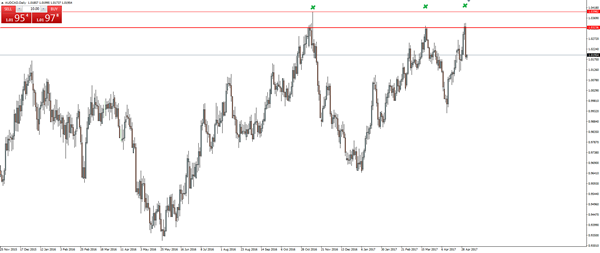
Was AUD/CAD really ever going to break through that same level while AUD/USD was so far away from it?