Sample Category Title
Gold Dips as Markets Await Fed Rate Statement
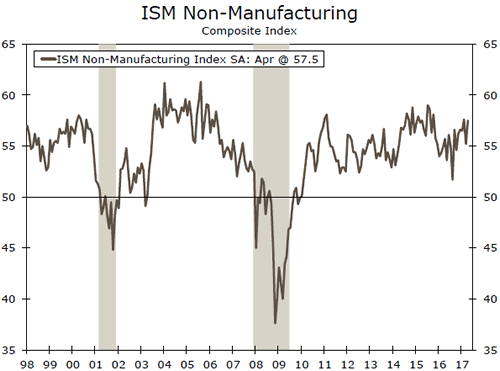
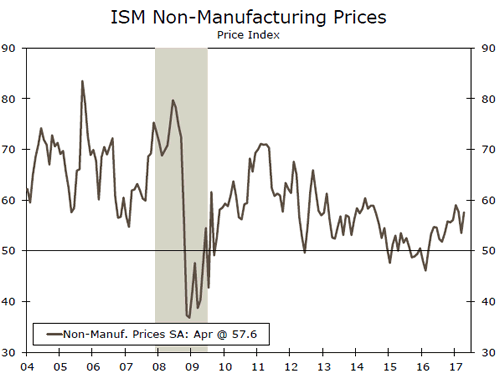
Gold has posted losses in the Wednesday session. In North American trade, spot gold is trading at $1247.86 an ounce. On the release front, ADP Nonfarm Payrolls dropped to 177 thousand, very close to the forecast of 178 thousand. The ISM Non-Manufacturing PMI improved to 57.5, beating the estimate of 56.1 points. Today's key event is the Federal Reserve's policy statement, with no change expected in the benchmark interest rate.
All eyes are on the Federal Reserve, which holds its monthly policy meeting later on Wednesday. A rate hike is extremely unlikely this time around, with the CME Group pricing in a hike at just 5%. This means that the markets will be focusing on the rate statement and the views of policymakers concerning economic conditions. The Fed has two key goals which have been achieved, namely full employment and an inflation rate of 2%. One area of concern which policymakers have circled is the Fed's balance sheet, which stands at $4.5 trillion. The minutes of the March meeting stated that policymakers want to start reducing this figure before the end of 2017, so the markets will be looking for another reference to the balance sheet in the rate statement or the minutes of the meeting. The markets are fairly confident that the Fed will press the rate trigger in June, as the odds for a hike have improved to 63%. If the rate statement is more hawkish than expected, we could see these odds increase.
ISM Non-Manufacturing Perks Back Up in April
Service sector activity rebounded in April after softening in March. The ISM non-manufacturing index rose 2.3 points to 57.5 in April, mostly recouping momentum lost in March. April's increase bested consensus.
Service Sector Bounces Back From Slip in March
After slipping 2.4 points in March, the ISM non-manufacturing index bounced back to 57.5 in April. Both production and new orders led the improvement in April, which reinforces our call for economic activity to rebound in Q2.
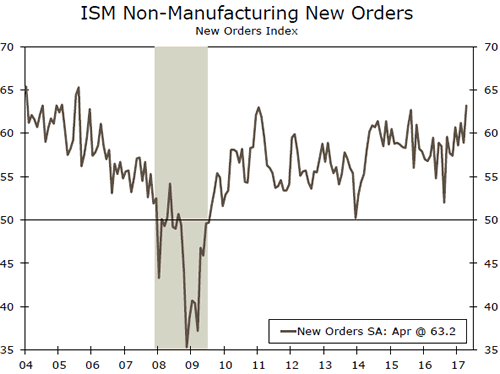
The new orders index added 4.3 points to post its current cycle high of 63.2. Demand was boosted by better global economic conditions, as new export orders jumped 3 points to 65.5.
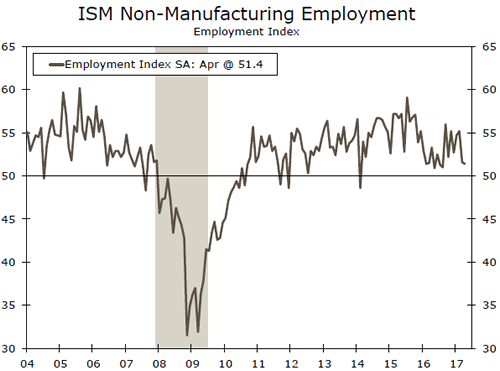
Employment Remained Muted in April
Employment was the only major component that did not improve in April, slipping another 0.2 points to 51.4 - a level that still signals expansion, but at a slower pace. Respondents noted a short supply of labor for the third straight month.
Price pressures returned in April which should reassure the Fed that March softness was likely transitory and inflation is moving in the right direction.
U.S. Services Sector Momentum Rebounds in April
U.S. Services Sector Momentum Rebounds in April
After falling 2.4 points in March, the Institute for Supply Management's (ISM) non-manufacturing index rose 2.3 points to 57.5 in April - a print well above market consensus which called for only a modest rise to 55.8. The monthly rebound brings the index back near the highest level since late-2015.
Gains were broad-based with most sub-indicators recording an improvement on the month. Among the most notable, were gains in new orders (up 4.3 points to 63.2) and new export orders (up 3 points to 65.5) - with both at the highest levels since prior to the Great Recession.
Business activity (up 3.5 points to 62.4) and prices paid (up 4.1 points to 57.6) also recorded notable improvements - the latter having pulled-back in the prior two months.
Among the remaining indicators, imports and inventory sentiment fell on the month, but the main soft spot in the report was arguably a slight deterioration in the employment sub-index which eased 0.2 points to 51.4 - the lowest point since mid-2016 - after having fallen 3.6 points in the month prior.
Comments from survey contacts remained largely positive. Nearly all non-manufacturing industries surveyed reported growth in April, with agriculture, forestry, fishing & hunting being the only exception.
Key Implications
Contrary to its manufacturing equivalent, which deteriorated for the second consecutive month, the ISM nonmanufacturing index accelerated markedly in April. The monthly improvement is encouraging as the gains were broad-based, comments from survey respondents remained largely positive, and the headline print remained well within expansionary territory.
That said, in the context of a recent divergence between 'hard' and 'soft' survey-based data, there are two important elements worth highlighting in today's report. First is the downtick in the employment sub-index which may point to some softness in this Friday's payrolls report. The rebound in second quarter growth is expected to come as a result of a normalization in consumer spending, which hinges on a supportive labor market. A subpar payrolls print, along with a seemingly diminished appetite for durables goods as per April's soft vehicle sales print, could pare back expectations as to the size of the rebound.
Today's improvement in the prices sub-index, coming after two consecutive monthly declines is a very welcome development that may signal a break for softening price pressures. We expect the recent softness in price trends to be temporary. But should it persist, it could delay the Fed's interest hiking cycle.
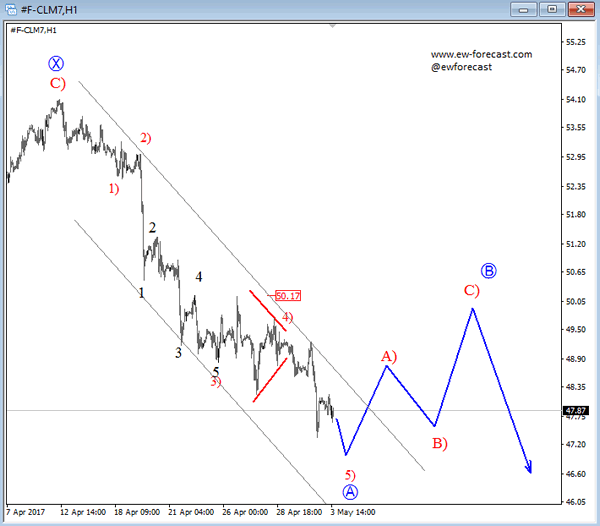
Elliott Wave Analysis: Crude OIL May See Some Temporary Recovery
A new leg down on crude oil in the last 24 hours suggests that whole cycle from April highs is a bearish structure and it indicates on more weakness ahead, but after a three wave bounce. Currently fifth wave of A is trading around the potential support levels of 47.00.
Crude OIL, 1H
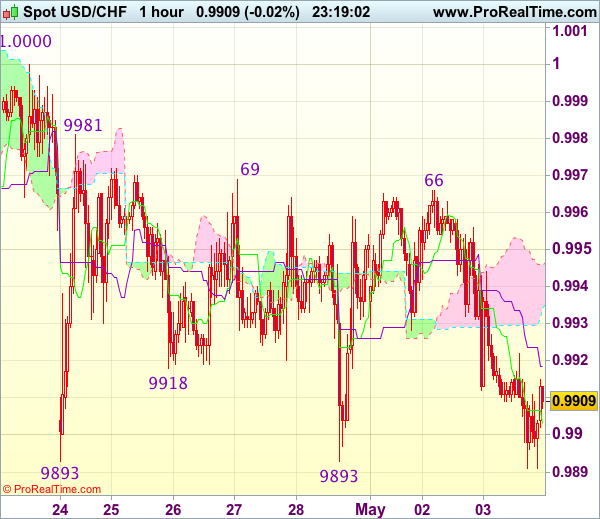
Trade Idea Wrap-up: USD/CHF – Stand aside
USD/CHF - 0.9908
Most recent candlesticks pattern : N/A
Trend : Near term down
Tenkan-Sen level : 0.9903
Kijun-Sen level : 0.9919
Ichimoku cloud top : 0.9946
Ichimoku cloud bottom : 0.9934
New strategy :
Stand aside
Position : -
Target : -
Stop : -
Although the greenback retreated after faltering below resistance at 0.9969 and retest of indicated strong support at 0.9893 cannot be ruled out, a firm break below there is needed to confirm recent decline from 1.0108 top has resumed and extend weakness to 0.9865-70 (2 times extension of 1.0108-1.0008 measuring from 1.0067), however, support at 0.9831 would hold from here, bring rebound later.
If said support at 0.9890-93 continues to hold, then further choppy trading within 0.9893-0.9981 range would take place and another bounce to 0.9966-69 cannot be ruled out but said upper range at 0.9981 should limit upside, bring retreat. Only a break of 1.0000-08 resistance would confirm a temporary low has been formed at 0.9893, bring retracement of recent decline to 1.0025-30 (61.8% Fibonacci retracement of 1.0108-0.9893) but price should falter well below resistance at 1.0067. As near term outlook is still mixed, would be prudent to stand aside for now.
Pound Edges Lower Despite Strong Construction PMI
GBP/USD continues to have an uneventful week. The pair has edged lower on Wednesday, as it trades at 1.2920 in the North American session. On the release front, UK Construction PMI improved to 53.1, above the forecast of 52.1 points. In the US, ADP Nonfarm Payrolls dropped to 177 thousand, very close to the forecast of 178 thousand. The ISM Non-Manufacturing PMI improved to 57.5, beating the estimate of 56.1 points. Today's key event is the Federal Reserve's policy statement, with no change expected in the benchmark interest rate. On Thursday, the UK publishes Services PMI and Net Lending to Individuals, while the US will release unemployment claims.
Despite all the angst over Brexit, British economic data continues to surprise, as the economy continues to perform well. PMI reports for March, key gauges of economic activity, have been stronger than expected. Construction PMI rose to 53.1 points, marking a 4-month high. Earlier in the week, Manufacturing PMI climbed to its highest level since 2014. At the same time, market concerns are again rising ahead of the first phase of negotiations between Britain and the European Union. The EU has toughened its stance in recent weeks, and there's no denying the bad blood between the sides, following some testy exchanges between Prime Minister May and EU President Juncker at a frosty meeting this week. If the two sides remain at loggerheads and the negotiations reach an impasse, May has warned that "no deal is better than a bad deal". However, a 'hard Brexit', in which Britain leaves the EU without a comprehensive deal in place, would likely take a toll on the British economy and send the pound to lower levels.
French voters will head back to the ballot box on Sunday, with Emmanuel Macron and Marine Le Pen vying for the next president of France. European stock markets have been very steady in the second round of the campaign, as opinion polls continue to show a comfortable majority for Macron:
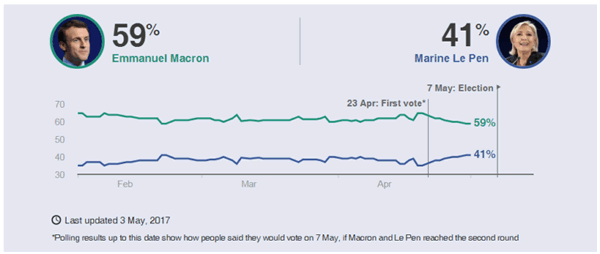
The polling average line looks at the five most recent national polls and takes the median value, ie, the value between the two figures that are higher and two figures that are lower.
Source - BBC
French Election Timeline
May 3 - TV debate between the two remaining candidates
May 5 - [from midnight] Poll blackout
May 7 - Second round of French presidential elections. Last polls close at 19:00 BST / 14:00 EDT, with an exit poll result announced immediately.
May 11 - Official proclamation of the new President.
May 14 - [from midnight] End of Francois Hollande's mandate
June 11 - First round of legislative elections
June 18 - Second round of legislative elections.
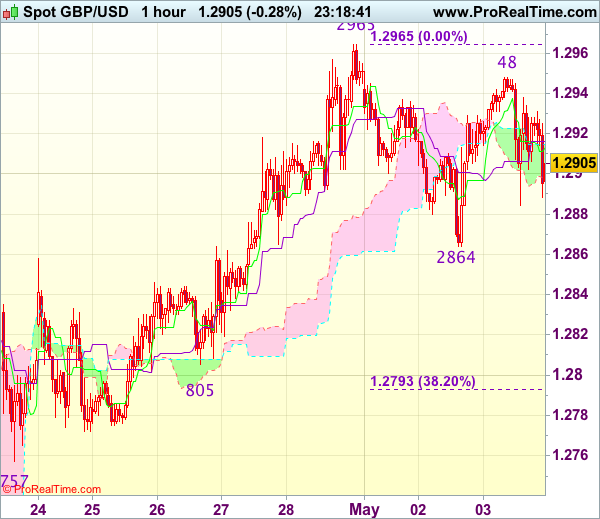
Trade Idea Wrap-up: GBP/USD – Buy at 1.2790
GBP/USD - 1.2905
Most recent candlesticks pattern : N/A
Trend : Near term up
Tenkan-Sen level : 1.2913
Kijun-Sen level : 1.2916
Ichimoku cloud top : 1.2915
Ichimoku cloud bottom : 1.2898
Original strategy :
Buy at 1.2790, Target: 1.2910, Stop: 1.2755
Position : -
Target : -
Stop : -
New strategy :
Buy at 1.2790, Target: 1.2910, Stop: 1.2755
Position : -
Target : -
Stop : -
Although cable rebounded to 1.2948, the subsequent retreat after faltering below resistance at 1.2965 has retained our view that further consolidation below this level would be seen and another corrective fall to 1.2864 support is likely, below there would bring retracement of recent rise to 1.2840-45, then towards support at 1.2805 but reckon downside would be limited to 1.2790-95 (38.2% Fibonacci retracement of 1.2515-1.2965) and bring another rise later. Above 1.2948 would bring retest of 1.2965, break there would confirm upmove has resumed for headway towards 1.2990-00 (1.236 times projection of 1.2109-1.2616 measuring from 1.2365 and psychological resistance).
In view of this, would not chase this rise here and would be prudent to buy cable on further subsequent pullback as downside should be limited to 1.2790-95. A drop below previous support at 1.2757 would abort and signal top is formed instead, bring correction to 1.2740 (50% Fibonacci retracement of 1.2515-1.2965) first.
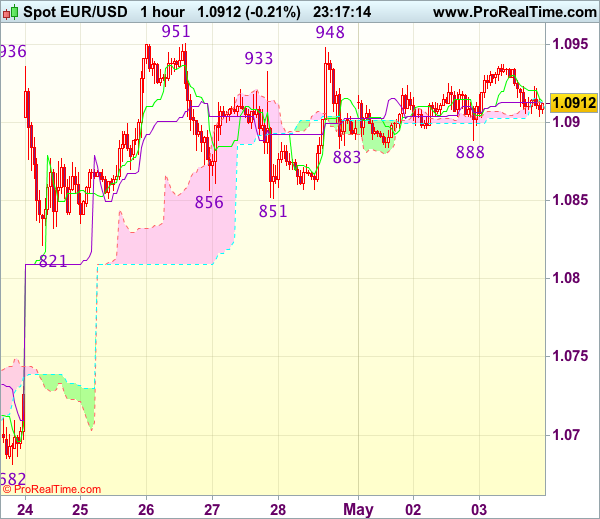
Trade Idea Wrap-up: EUR/USD – Stand aside
EUR/USD - 1.0916
Most recent candlesticks pattern : N/A
Trend : Near term up
Tenkan-Sen level : 1.0914
Kijun-Sen level : 1.0913
Ichimoku cloud top : 1.0913
Ichimoku cloud bottom : 1.0912
New strategy :
Stand aside
Position : -
Target : -
Stop : -
Although the single currency rebounded after holding above support at 1.0883, a break of indicated resistance at 1.0951 (last week’s high) is needed to signal recent upmove from 1.0340 low has resumed for headway to 1.0975-80 and possibly towards 1.1000 which is likely to hold on first testing due to loss of momentum.
In view of this, would not chase this rise here, below 1.0883-88 support would prolong consolidation below said resistance at 1.0951, bring correction towards support at 1.0851 but price should stay above 1.0821 support, bring another rise later. As near term outlook is still mixed, would be prudent to stand aside in the meantime.
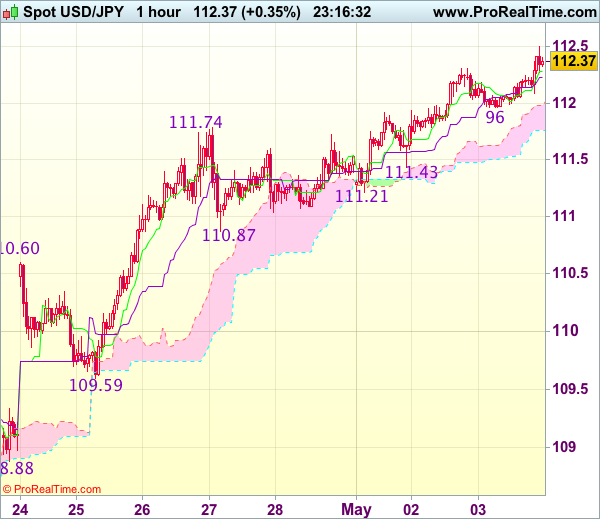
Trade Idea Wrap-up: USD/JPY – Buy at 111.25
USD/JPY - 112.33
Original strategy :
Buy at 111.55, Target: 112.55, Stop: 111.20
Position : -
Target : -
Stop : -
New strategy :
Buy at 111.25, Target: 112.55, Stop: 110.90
Position : -
Target : -
Stop : -
As the greenback has continued trading with a firm undertone after recent rally above previous resistance at 111.74, adding credence to our view that recent upmove is still in progress and bullishness remains for further subsequent gain to 112.50-60 but near term overbought condition should limit upside to 112.80 and price should falter below 113.00-10, risk from there has increased for a retreat to take place later.
In view of this, would not chase this rise here and would be prudent to buy dollar on subsequent pullback as 111.21 support should limit downside. Below 111.00-05 would abort and suggest a temporary top is formed instead, bring correction towards 110.87 support first but previous resistance at 110.60 should turn into support and contain downside.
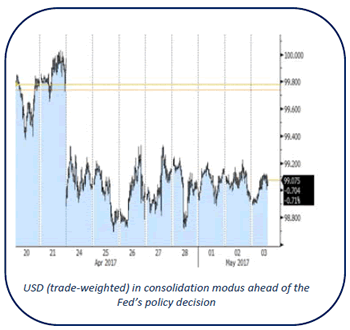
Fed to Decide on Next USD Move?
Headlines
European equity markets record small losses in an uneventful session, ignoring strong EMU Q1 GDP numbers. US stock markets open with in negative territory with Nasdaq underperforming following profit taking in Apple shares after yesterday's mediocre earnings.
America's service industries expanded more than projected in April as a measure of orders reached the highest level since 2005 (63.2). The non-manufacturing ISM rose from 55.2 to 57.5, much more than expected (55.8)
The EMU economy started the year with robust growth that outstripped that of the US and set the stage for a strong 2017. EMU GDP grew by 0.5 Q/Q in Q1, which translates to annualised growth of 1.8% in all of 2017, Eurostat said. The US recorded 0.7% annualised growth in Q1, the weakest performance since the first quarter of 2014.
German unemployment extended its four-year decline last month, suggesting companies are confident that momentum in Europe's largest economy remains strong. The number of people out of work slid by a seasonally adjusted 15,000 to 2.543 million in April. The unemployment rate steadied at 5.8%, a multi-decade low.
The US private sector added 177,000 jobs last month according to ADP, representing a fall from the March pace (255,000), but slightly beating expectations (175,000). The data come ahead of the closely tracked monthly employment from the US labour department (payrolls) that is due for release on Friday.
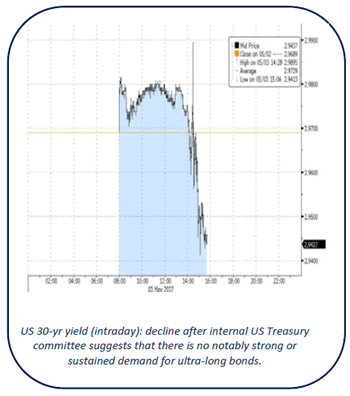
There is little evidence of strong or sustainable demand for "ultra-long" US government bonds, an advisory committee to the US Treasury has concluded. The current administration has been looking at whether it should introduce new bond issuance that exceeds the current 30-yr maturity threshold. Treasury secretary Mnuchin said on Monday that it "could absolutely make sense for us at the Treasury".
Rates
Core bonds tread water ahead of Fed
Global core bonds treaded water today, bar some volatility around the weaker European equity market opening and around the time US Treasury Secretary Mnuchin spoke at a Community banker event. Mnuchin repeated his interest in issuing longer term debt and talked about first conclusions from an internal committee studying the issue. They said they didn't see notably strong demand or sustainable demand for ultra-long bonds (>30y), but added that it makes sense to issue more long term debt (10y-20y-30y). On tax reforms, Mnuchin remains hopeful that they can be concluded this year. EMU (Q1 GDP) and US (ADP) eco data printed bang in line with consensus and couldn't trigger action ahead of tonight's FOMC meeting. The non-manufacturing ISM was very strong, including the forward-looking order component and caused a spike lower in US Treasuries, but the move lacked follow-through selling. EIA oil inventory data are a wildcard for global markets with oil prices near key support levels.
At the time of writing, changes on the US yield curve range between +1.6 bps (2-yr) and -2.3 bps (30-yr). The outperformance of the very long end of the curve is clearly due to the Mnuchin comments. The German yield curve shifts up to 0.9 bps lower. On intra-EMU bond markets, 10-yr peripheral spreads narrow 3-to-4 bps for Spain/Italy and 7 bps for Portugal. The Greek spread widens 3 bps.
The FOMC is expected to keep its policy rate unchanged (0.75%-1%) tonight. We don't expect big changes to the policy statement. If the Fed doesn't manage to keep June rate hikes expectations near current levels (70%) eg by stressing weak Q1 GDP too much or referring to the continued need of strong eco data, the US Note future could revisit the 126-20 contract high short term. We would use such move to enter new short positions. Friday's avalanche on Fed speakers could "correct" a soft market reaction by confirming the intention to continue the gradual tightening pace, a similar scenario as between the February and March FOMC meetings. A hawkish Fed - clear reference to June tightening and/or balance sheet tapering -, not our preferred scenario, would trigger immediate selling.
The German Finanzagentur tapped the on the run 10-yr Bund (€3B 0.25% Feb2027). Total bids remained low (€3.65B), compared with the €3.97B average at the previous 4 Bund auctions. The Bundesbank set aside a relatively large part (€0.57B; 19%) of the amount on offer for secondary market operations, resulting in an official bid cover of 1.5 (real bid cover 1.2). The auction had no tail.
Currencies
Fed to decide on next USD move?
Trading in EUR/USD and USD/JPY was still locked in tight ranges as investors awaited guidance from the Fed policy statement later this evening. EMU growth was strong, as expected and US ADP job growth OK. However, the data hardly impacted FX trading. EUR/USD is trading in well-known territory in the 1.0910/20 area. USD/JPY is holding near the recent top in the 112.35 area.
European equities opened with modest losses, but soon settled in directionless sideways trading. The EMU eco data were solid, as expected. The EMU economy expanded by 0.5% Q/Q and 1.7% Y/Y. The German April unemployment declined slightly more than expected (-15k). The market reaction to these kind of EMU data was close to non-existent, as usual. The dollar gained a few ticks against the euro and against the yen early in European trading. We consider it a cautious, insignificant market repositioning going into the Fed policy decision.
The US ADP private job report came out close to expectations at 177 000. It suggests that the labour market remains reasonably healthy. However, just hours before the Fed meeting, the report failed to inspire USD trading. EUR/USD continues to trade in the 1.0920 area going into the publication of the US nonmanufacturing ISM. USD/JPY remained well bid and is again testing the recent highs in the 112.20/35 area. Contrary to the manufacturing measure earlier this week, the US non-Manufacturing ISM was very strong at 57.5 (from 55.2, 55.8 was expected). The dollar (especially USD/JPY) tries to gain some further ground immediately after the release.
The countdown to the FOMC decision continues. We don't expect a big change in the Fed's assessment. However, if the Fed elaborates on recent US data softness, it might be a slightly USD negative, even if the FOMC keeps the option of a June rate hike open.
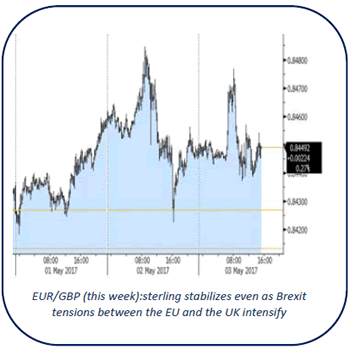
No further sterling losses despite Brexit nervousness
Sterling was under pressure at the start in Europe this morning. An FT article indicated that the EU could demand the UK a 'separation charge' of up to €100B. The report followed other recent signals that the UK and the EMU might be heading for very tough Brexit-negotiations. EUR/GBP touched an intraday top of 0.8476. Cable spiked to the 1.2885 area. However, this time there was no followthrough sterling selling. The UK April construction PMI rebounded to 53.1 from 52.2 (52.0 was expected). The release is not that important for markets, but it helped to put a floor for sterling even as the political bickering between the EU and the UK continues with more harsh comments from EU's Barnier and UK Brexit Minister Davis. EUR/GBP dropped to the 0.8450 area. Cable returned to the 1.29+ area. Both cross rates are still trading in that area.