Sample Category Title
USD/CHF Pushing Higher, USD/CAD Trading Around 1.3400, AUD/USD Towards Strong Support Area.
USD/CHF Pushing higher.
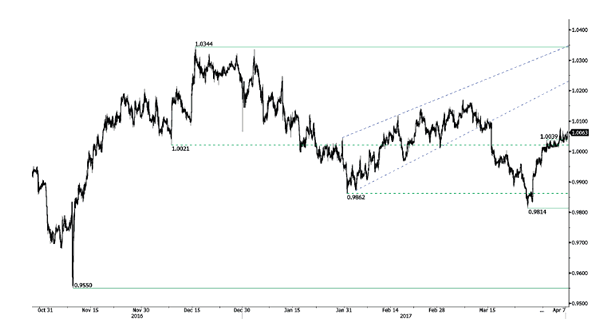
USD/CHF is strengthening, even though slightly. Hourly support is given at 0.9814 (27/03/2017 low). Key resistance can be found at a distance at 1.0344 (15/12/2016 high). Expected to show another leg higher.
In the long-term, the pair is still trading in range since 2011 despite some turmoil when the SNB unpegged the CHF. Key support can be found 0.8986 (30/01/2015 low). The technical structure favours nonetheless a long term bullish bias since the unpeg in January 2015.
USD/CAD Trading around 1.3400.
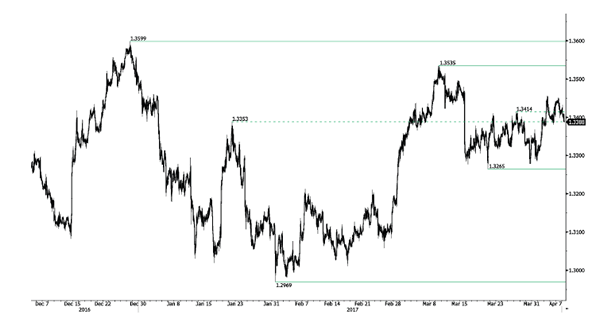
USD/CAD has broken resistance area around 1.3400 which invalidates the short term bearish technical structure. Hourly support is given at 1.3265 (21/03/2016 low) is at stake. Key support is given at 1.2969 (31/01/2017 low).
In the longer term, there is a golden cross with the 50 dma crossing the 200 dma indicating further upside pressures. Strong resistance is given at 1.4690 (22/01/2016 high). Long-term support can be found at 1.2461 (16/03/2015 low).
AUD/USD Towards strong support area.
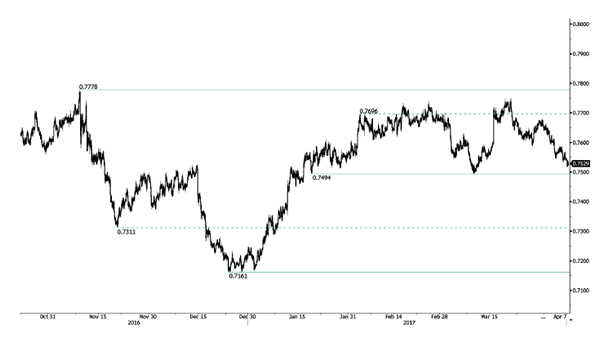
AUD/USD is getting lower towards strong support area around 0.7500.. The pair has failed to test the key resistance at 0.7778 (08/11/2016 high).
In the long-term, we are waiting for further signs that the current downtrend is ending. Key supports stand at 0.6009 (31/10/2008 low) . A break of the key resistance at 0.8295 (15/01/2015 high) is needed to invalidate our long-term bearish view.
EUR/USD Edging Lower, GBP/USD Sideways Price Action, USD/JPY Testing Support At 110.
EUR/USD Edging lower.
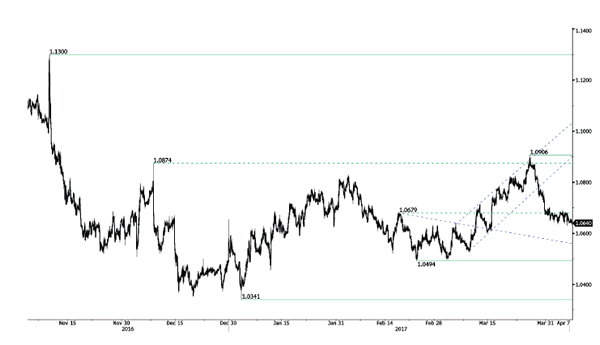
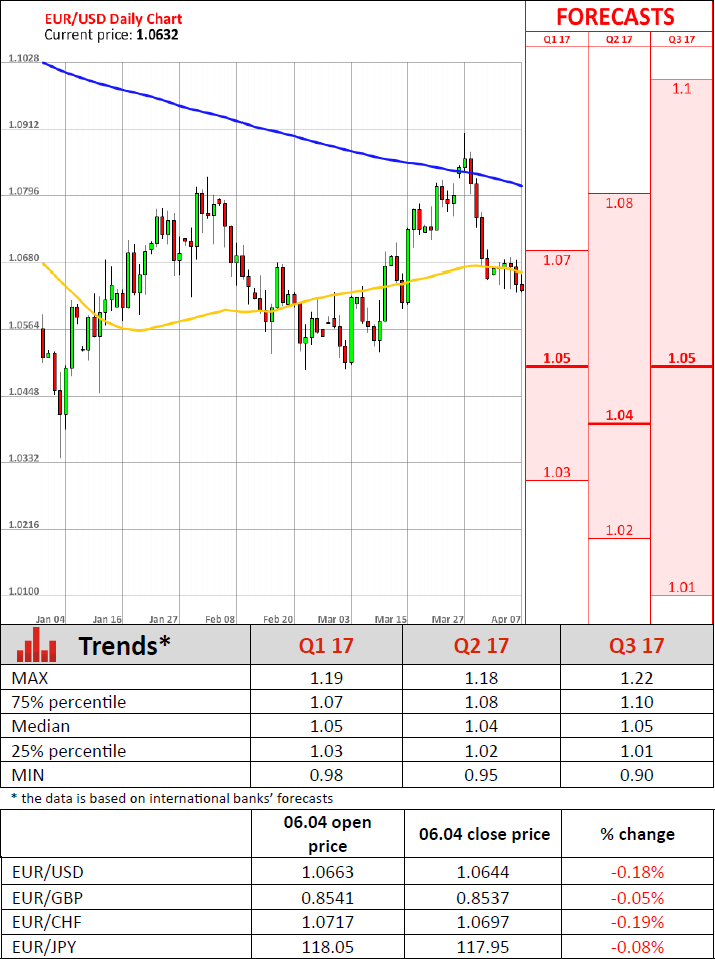
EUR/USD is going lower. The pair is heading lower since the pair failed to hold above former resistance given at 1.0874 (08/12/2017 high). Hourly support can be found at 1.0630 (intraday low). Stronger support can be found at 1.0494 (22/02/2017 low). Expected to see further shortterm weakness.
In the longer term, the death cross late October indicated a further bearish bias. The pair has broken key support given at 1.0458 (16/03/2015 low). Key resistance holds at 1.1714 (24/08/2015 high). Expected to head towards parity.
GBP/USD Sideways price action.
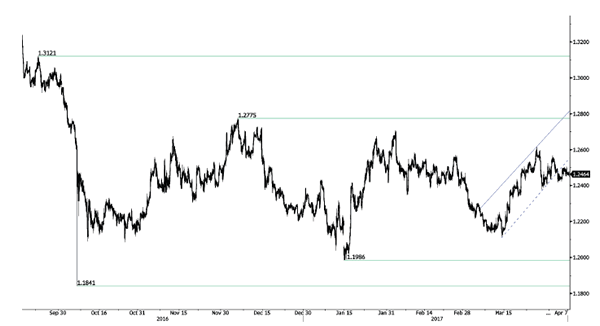
GBP/USD's bullish pressures have faded abruptly. Hourly resistance is located at 1.2615 (27/03/2017 high) while hourly support can be found at 1.2324 (03/17/2017 low). Expected to show continued strengthening towards stronger resistance at 1.2775 (06/12/2016 high) if support area around 1.24 stands.
The long-term technical pattern is even more negative since the Brexit vote has paved the way for further decline. Long-term support given at 1.0520 (01/03/85) represents a decent target. Long-term resistance is given at 1.5018 (24/06/2015) and would indicate a long-term reversal in the negative trend. Yet, it is very unlikely at the moment.
USD/JPY Testing support at 110.
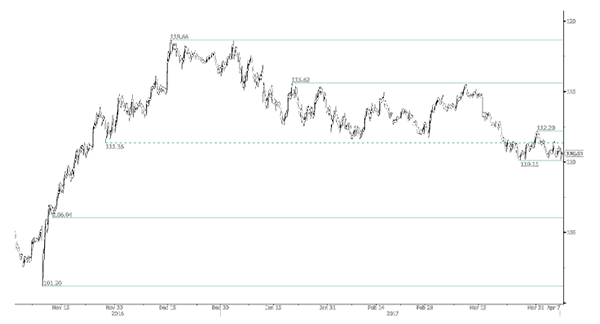
USD/JPY's momentum is slowing down. Hourly resistance is given at 112.20 (31/03/2017 high). Stronger resistance can be located at 113.57 (16/03/2017 high) while support is given at 110.11 (27/03/2017 low).
We favor a long-term bearish bias. Support is now given at 96.57 (10/08/2013 low). A gradual rise towards the major resistance at 135.15 (01/02/2002 high) seems absolutely unlikely. Expected to decline further support at 93.79 (13/06/2013 low).
(EU) German Industrial Orders Rebound In February
'The increase in orders was important - otherwise concerns about production would definitely have been warranted.' - lexander Krueger, Bankhaus Lampe
German industrial orders rose in February after plunging in the preceding month amid stronger domestic demand. The Economy Ministry reported on Thursday that booking advanced 3.4% during the reported month, following January's drop of 6.8% but falling behind analysts' expectations for a 3.5% increase. The data followed a private survey that showed that manufacturing activity growth hit its highest level in almost six months in March. Both data releases suggested that the manufacturing sector contributed significantly to GDP growth in the Q1 of 2017. Nevertheless, orders from the Euro zone dropped 8.1%, failing to contribute to growth. Sophia Krietenbrink from the DIHK suggested that global political risks continued to put significant pressure on international demand for German-manufactured goods. The Economy Minister added that in the two-month comparison for January/February compared to November/December, orders dropped 2.4% amid both weak domestic and international demand. However, it expressed hopes that industrial activity would improve in the upcoming months. On Friday morning, Destatis reported that German industrial production climbed 2.2% in February, unchanged from a downwardly revised reading in January. Meanwhile, analysts anticipated a drop of 0.1%.
Trade Idea Update: USD/CHF – Buy at 0.9950
USD/CHF - 1.0054
Original strategy :
Buy at 0.9950, Target: 1.0050, Stop: 0.9915
Position : -
Target : -
Stop : -
New strategy :
Buy at 0.9950, Target: 1.0050, Stop: 0.9915
Position : -
Target : -
Stop : -
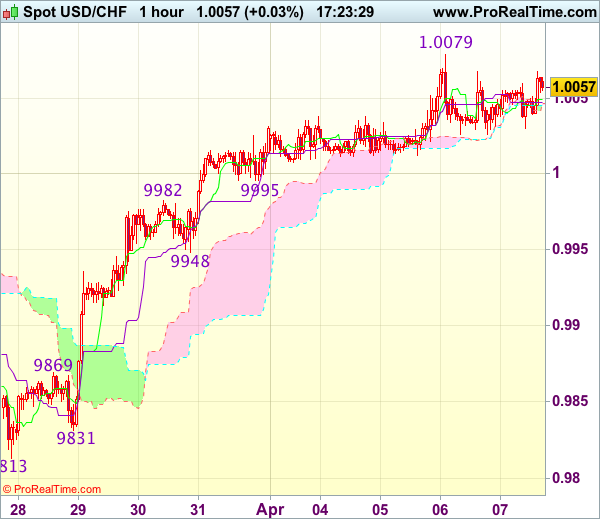
The greenback remained confined within near term established range and further sideways trading is in store before recent rise from last week’s low at 0.9813 resumes, above resistance at 1.0079 would extend further gain to previous resistance at 1.0109, however, loss of upward momentum should prevent sharp move beyond latter level and reckon 1.0140-50 would hold, risk from there has increased for a retreat to take place later.
In view of this, would not chase this rise here and would be prudent to buy dollar on pullback as support at 0.9948 should limit downside. Below 0.9925-30 would abort and signal top is formed instead, bring correction to 0.9905-10 but reckon previous resistance at 0.9869 would hold from here.
Trade Idea Update: GBP/USD – Stand aside
GBP/USD - 1.2430
New strategy :
Stand aside
Position : -
Target : -
Stop : -
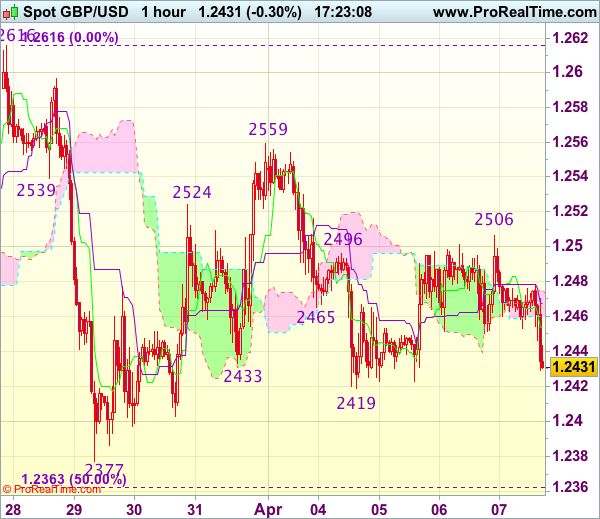
Although the British pound has retreated after meeting resistance at 1.2506 and test of support at 1.2419 cannot be ruled out, break of 1.2400 is needed to revive bearishness and add credence to our view that the rebound from 1.2377 has ended at 1.2559 earlier, bring further fall towards this support first. Looking ahead, only break there would extend recent fall from 1.2616 to 1.2350 and later towards 1.2325-30.
In view of this, would not chase this fall here and would be prudent to stand aside in the meantime. Above 1.2475-80 would bring another test of 1.2507 but only break there would shift risk back to upside for a stronger rebound to 1.2520-25, then towards indicated resistance at 1.2559. As near term outlook is still mixed, would be prudent to stand aside in the meantime.
Trade Idea Update: EUR/USD – Sell at 1.0725
EUR/USD - 1.0635
Original strategy :
Sell at 1.0725, Target: 1.0610, Stop: 1.0760
Position : -
Target : -
Stop : -
New strategy :
Sell at 1.0725, Target: 1.0610, Stop: 1.0760
Position : -
Target : -
Stop : -
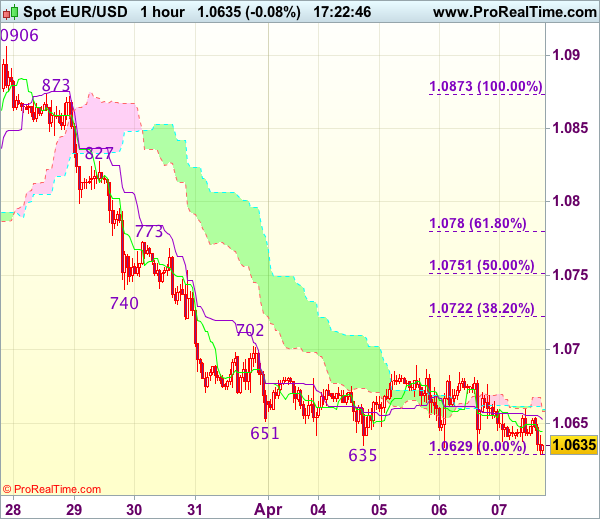
As the single currency has remained weak after recent selloff, bearishness remains for the decline from 1.0906 to extend further weakness to 1.0620, then test of previous chart support at 1.0600, however, a sustained breach below the latter level is needed to retain downside bias for subsequent selloff to 1.0570-75 first.
In view of this, would not chase this fall here and would be prudent to sell dollar on recovery as 1.0720-30 should limit upside. Only a firm break above resistance at 1.0773 would suggest low is formed instead, bring a stronger rebound to 1.0800 but resistance at 1.0827 should remain intact.
Trade Idea Update: USD/JPY – Sell at 111.30
USD/JPY - 110.62
Original strategy :
Sell at 111.30, Target: 110.30, Stop: 111.65
Position : -
Target : -
Stop : -
New strategy :
Sell at 111.30, Target: 110.30, Stop: 111.65
Position : -
Target : -
Stop : -
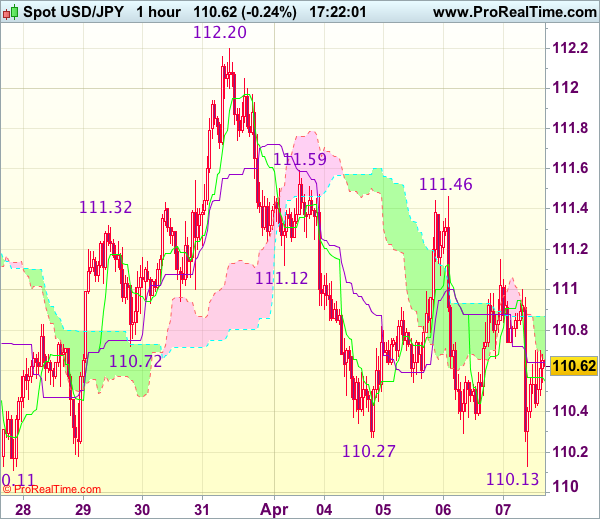
Although the the greenback fell briefly to 110.13, as dollar has rebounded after holding above support at 110.11, suggesting further consolidation above this level would be seen and corrective bounce to 111.00 cannot be ruled out, however, reckon upside would be limited and resistance at 111.46 should remain intact, bring another decline later, below said support at 110.11-13 would confirm medium term decline has resumed for further subsequent fall to 109.80-85 (1.618 times projection of 112.20-111.12 measuring from 111.59) but price should hold above 109.50-55 (100% projection of 112.20-110.27 measuring from 111.46).
In view of this, would not chase this fall here and would be prudent to sell dollar on recovery as 111.20-30 should limit upside. Only above 111.46 resistance would abort and prolong choppy trading, risk rebound to 111.59, then towards 111.90-00 later but price should falter well below said resistance at 112.20.
EUR/JPY Elliott Wave Analysis
EUR/JPY - 117.70
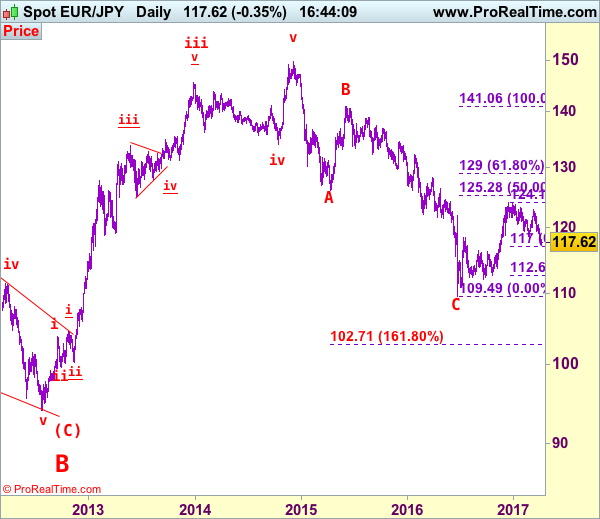
EUR/JPY: Wave v as well as larger degree wave (C) ended at 94.11 and first leg of larger degree wave C upmove has possibly ended at 149.79 and wave 2 correction has possibly ended at 109.49.
As the single currency has fallen again after brief recovery and broke below indicated previous support at 118.24, adding credence to our bearish view that the decline from 124.10 top is still in progress and downside bias remains for the erratic decline from 124.10 top to extend further weakness to 117.00 (61.8% Fibonacci retracement of 112.61-124.10) but downside should be limited to 116.00 and price should stay well above 115.00, risk from there is seen for a rebound to take place later.
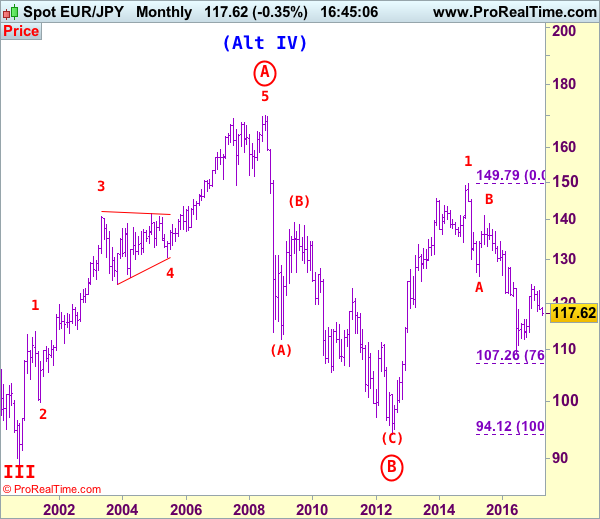
The daily chart is labeled as attached, early selloff from 169.97 (July 2008) to 112.08 is wave (A) of B instead of end of entire wave B and then the rebound from there to 139.26 is wave (B), hence, wave (C) has possibly ended at 94.12 with a diagonal triangle as labeled in the daily chart, hence upside bias is seen for further gain. Recent rally above indicated retracement level at 116.69 (50% Fibonacci retracement of the intermediate fall from 139.26-94.12) adds credence to this view and signal major reversal has commenced but first leg of this wave C has possibly ended at 149.79, hence wave 2 has commenced with wave A ended at 126.09, followed by wave B at 141.06, wave C commenced and could have ended at 109.49, above 125.00 would add credence to this view.
On the upside, although initial recovery to 118.35-40 cannot be ruled out, reckon upside would be limited to 119.05-10 and price should falter below 119.80-85, bring another decline later. Only a daly close above indicated resistance at 120.44 would defer and suggest low is formed, bring a stronger rebound to 120.90-00 and possibly 121.30-35 but price should falter well below resistance at 121.84, bring another decline later.
Recommendation: Sell euro at 119.75 for 117.15 with stop above 120.75.
To re-cap the corrective upmove from the record low of 88.93 (18 Oct 2000), the wave A from there is subdivided as: 1:88.93-113.72, 2:99.88 (1 Jun 2001), 3:140.91 (30 May 2003), 4:124.17 (10 Nov 2003) and 5 ended at record high of 169.97 (21 Jul 2008). The brief but sharp selloff to 112.08 is viewed as a-b-c x a-b-c wave (A) of B. The subsequent rebound to 139.26 is (B) of B and (C) of (B) has possibly ended at 94.12 and in any case price should stay well above previous chart support at 88.93, bring rally in larger degree wave C towards 150.00.
Technical Outlook: Yen Is Supported By Strong Safe-Haven Demand But 110.00 Support Is Holding For Now
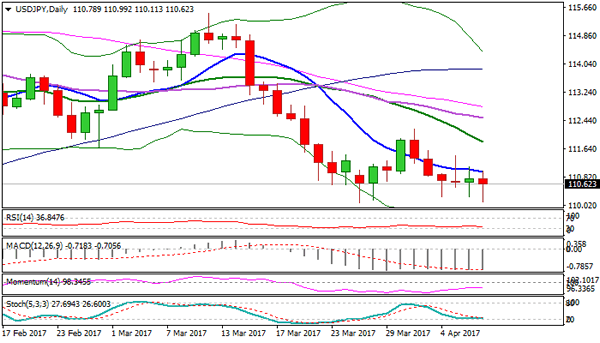
The pair maintains overall bearish bias despite long-legged candles in past couple of days that signaled hesitation at key 110.00 support zone. Repeated rejection at daily Tenkan-sen 111.14 yesterday and today's spike to former low at 110.09 were bearish signals. Renewed demand for safe-haven assets keep yen supported along with firmly bearish technicals. Final break below 110.00 zone (110.09 base / 109.91 – 50% retracement of 101.17/118.65 rally) would trigger fresh acceleration lower and expose 109.30 /108.81 projections and 108.00 in extension. Weekly close below 111.36 (weekly cloud top) is needed to confirm bearish stance. Alternative scenario will be activated on sustained break above 111.36. US NFP data are in focus.
Res: 110.99, 111.14, 111.36, 111.43
Sup: 110.09, 109.91, 109.30, 108.81
USD/CHF Elliott Wave Analysis
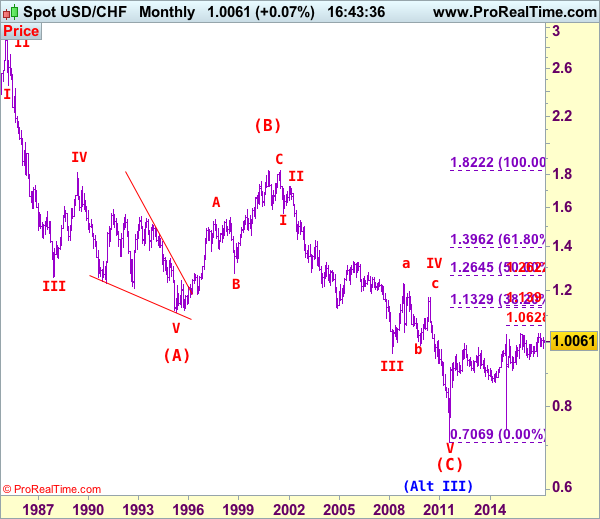
USD/CHF – 1.0061
USD/CHF – Wave IV ended at 1.1730 and wave V has possibly ended at 0.7068
As the greenback found good support at 0.9815 late last month and has staged a strong rebound from there, adding credence to our view that low has been formed there and consolidation with mild upside bias is seen for further gain to 1.0105-10. Having said that, price should falter below resistance at 1.0171, bring retreat later. In the event dollar breaks above said resistance at 1.0171, this would revive our bullish view for the erratic rise from 0.9861 to extend further gain to 1.0200 and possibly test of resistance at 1.0248, however, a daily close above there is needed to signal the retreat from 1.0344 has ended at 0.9861, bring eventual retest of 1.0344.
Our preferred count on the daily chart is that early selloff to 0.9630 is an end of the larger degree wave III and major correction is unfolding from there with a leg ended at 1.2298 (Nov 2008 with (a): 1.0625, (b):1.0011 and (c):1.2298), wave b ended at 0.9910 with (a): 1.0370, (b): 1.1967, (c): 0.9910. The rise from there to 1.1730 is the wave c which also marked the end of wave IV and wave V has possibly ended at 0.7068.
On the downside, whilst pullback to 0.9995-00 cannot be ruled out, reckon downside would be limited to 0.9945-50 and bring another rise later. Below 0.9900 would suggest the rebound from 09815 has ended instead bring another fall towards said support at 0.9815. Looking ahead, only a break below this level would confirm another leg of major fall from 1.0344 top is underway for further fall to 0.9735-40, however, oversold condition should prevent sharp fall below 0.9675-80 and price should stay well above 0.9600, bring rebound later.
Recommendation: Stand aside for this week
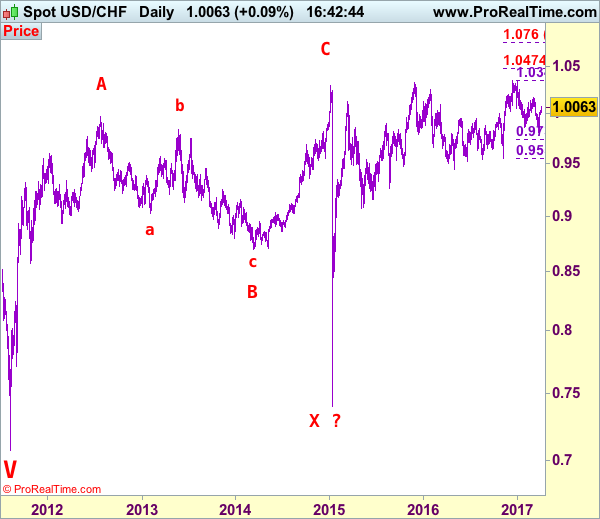
Dollar's long-term downtrend started from 2.9343 (Feb 1995) and it was unfolding as a (A)-(B)-(C) with (A): 1.1100, (B): 1.8310 (26 Oct 2000), then followed by another impulsive wave (C) with wave III ended at 0.9630 (Mar 2008). Under this count, correction in wave IV has possibly ended at 1.1730 and wave V already broke below support at 0.9630 and met indicated downside target at 0.7500 and 0.7400. The reversal from 0.7068 suggests the wave V has possibly ended and the breach of resistance at 0.9595 add credence to this view and indicated upside target at 1.0000 had been met, however, the sharp retreat from 1.0296 to 0.7401 suggests choppy trading would be seen but price should stay above said record low at 0.7068.