

Sample Category Title
GBP/USD Daily Outlook
Daily Pivots: (S1) 1.2448; (P) 1.2501; (R1) 1.2538; More...
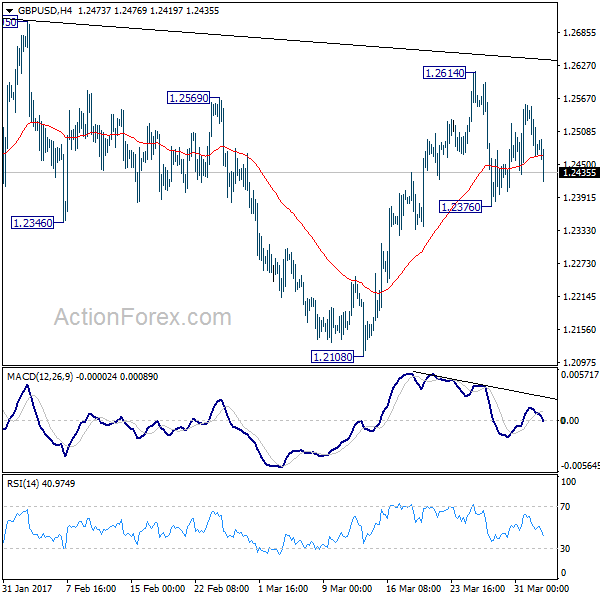
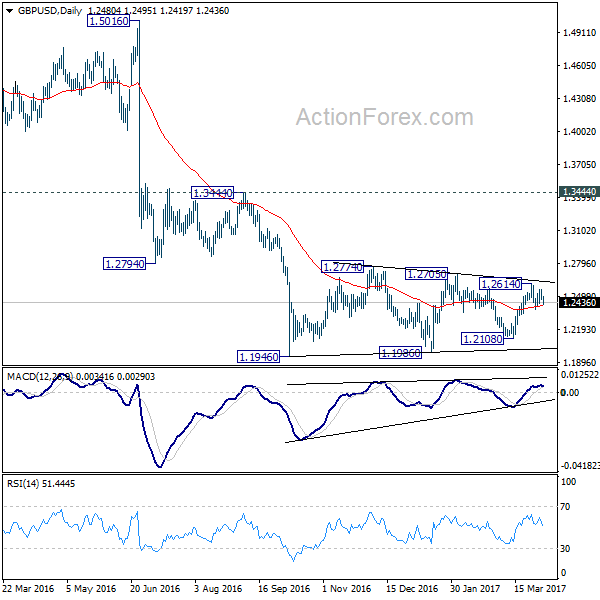
GBP/USD is still bounded in range of 1.2376/2614 and intraday bias stays neutral for the moment. Overall, price actions from 1.1946 are viewed as a consolidation pattern pattern. On the downside, break of 1.2376 will turn bias to the downside for 1.2108 support. Decisive break there will be an early sign of larger down trend resumption. On the upside, break of 1.2614 will extend the rise from 1.2108. But upside should be limited by 1.2705/2774 resistance zone to bring larger down trend resumption eventually.
In the bigger picture, fall from 1.7190 is seen as part of the down trend from 2.1161. There is no sign of medium term reversal yet. Sustained trading below 61.8% projection of 2.1161 to 1.3503 from 1.7190 at 1.2457 will target 100% projection at 0.9532. Overall, break of 1.3444 resistance is needed to confirm medium term bottoming. Otherwise, outlook will remain bearish.
RBA Torn Between High Housing Prices And Subdued Inflation
RBA left the cash rate unchanged at 1.5% in April, continuing to struggle between soaring property prices and subdued inflation. Policymakers appeared more optimistic over the global economic outlook than the domestic one. The central bank remained concerned over the rising property prices and warned of the situation that household borrowing growth was outpacing growth in income. We expect RBA to leave its monetary stance unchanged throughout the year.
Economy to show moderate growth
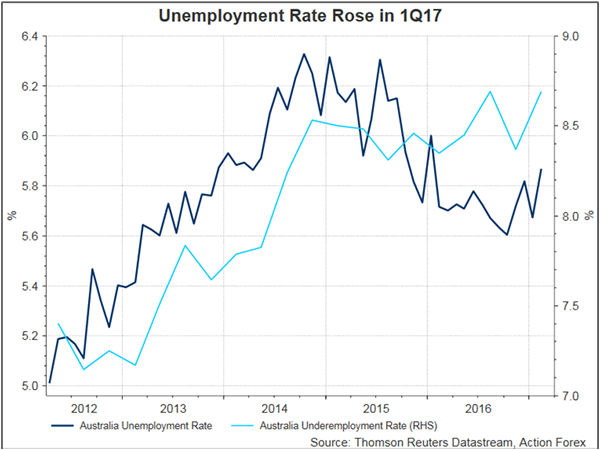
The central bank noted domestic economy continued to show 'moderate growth' in the 'transition following the end of the mining investment boom'. Policymakers acknowledged rising non-mining business investment over the past year and pickup in business confidence. Meanwhile, they also acknowledged some deterioration in the employment market, noting the rise in unemployment rate, modest growth in payrolls as slow wage growth. RBA continued to warn of low inflation.
Inflation remains quite low
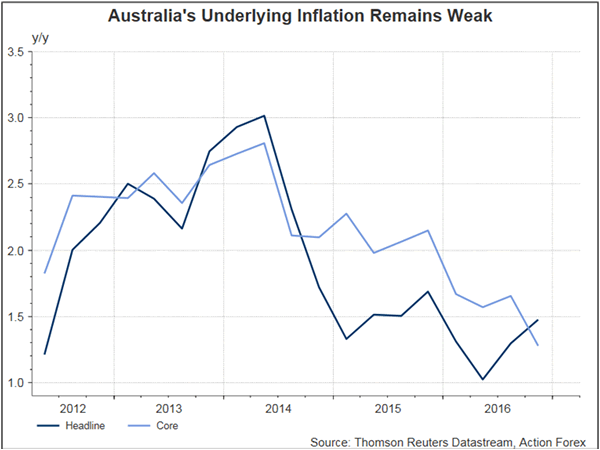
As noted in the statement, inflation 'remains quite low'. While the headline reading should 'pick up over the course of 2017 to be above 2%, underlying inflation would rise more gradually with 'growth in labour costs remaining subdued'. Recall that the country's unemployment rate rose to 5.9%, the highest in 13 months, in February, up from 5.7% a month ago. The number of payrolls slipped -0.1K, the first drop in 5 months, while the number of unemployed increased +26K. Headline CPI moderated to +0.5% q/q in 4Q16, from +0.7% in the prior quarter. Core inflation steadied at +0.4% q/q for the quarter.
RBA concerned on house prices
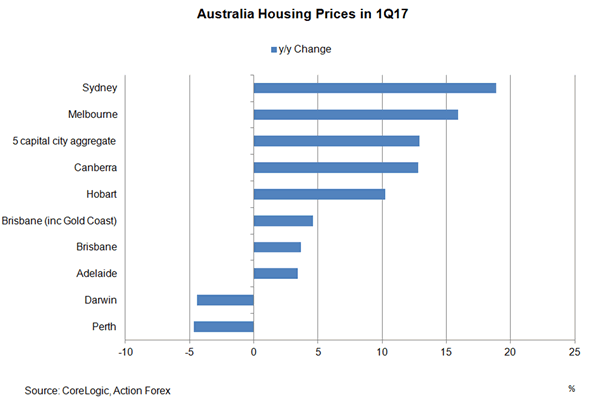
The persistently-high housing prices remained a concern. As suggested in the statement, 'conditions in the housing market continue to vary considerably around the country'. While 'conditions are strong and prices are rising briskly' in some markets, prices are 'declining' in others. It also addressed the situation in the eastern capital cities, noting that 'a considerable additional supply of apartments is scheduled to come on stream over the next couple of years. Growth in rents is the slowest for two decades'. Yet, the above message was only a repeat of previous meeting statements.
Household borrowing outpaced income growth
What's new was the warning that household borrowing growth was outpacing growth in income. Policymakers judged that 'the recently announced supervisory measures should help address the risks associated with high and rising levels of indebtedness'. They added that 'lenders need to ensure that the serviceability metrics that they use are appropriate for current conditions. A reduced reliance on interest-only housing loans in the Australian market would also be a positive development'.
USD/CHF Daily Outlook
Daily Pivots: (S1) 1.0002; (P) 1.0019; (R1) 1.0032; More.....
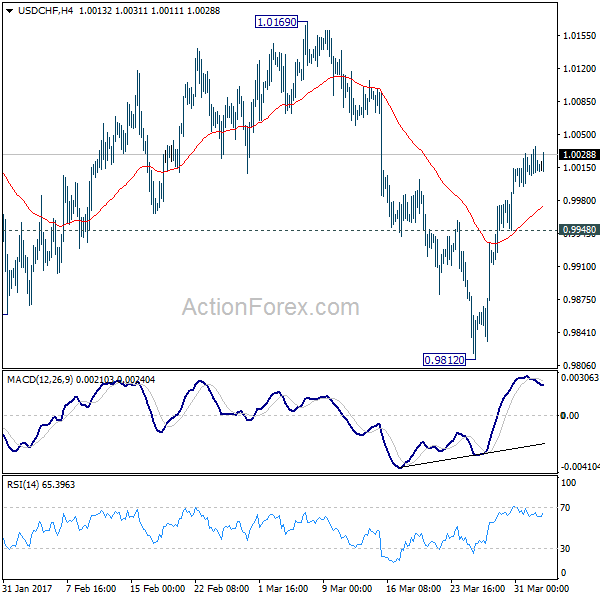
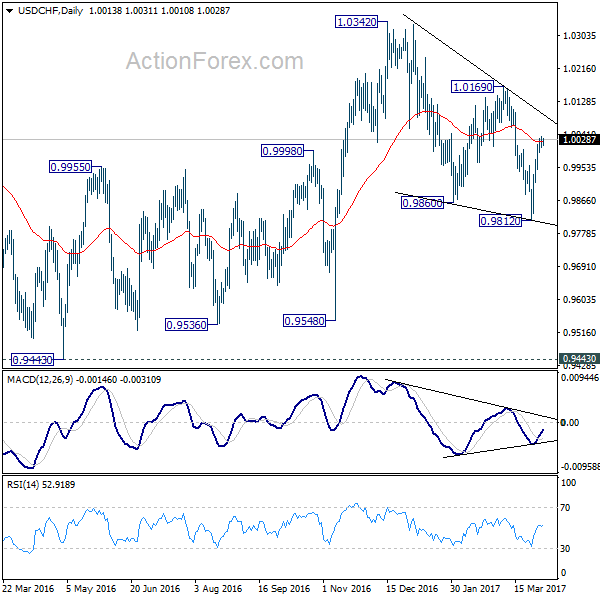
USD/CHF lost some upside momentum after hitting 110.36 as seen in 4 hour MACD. But still, further rally is in favor with 0.9948 minor support intact. As noted before, corrective decline fall from 1.0342 should have finished with three waves down to 0.9812 already. Sustained trading above 55 day EMA (now at 1.0023) will affirm this bullish case. Break of 1.0169 resistance will confirm and target a test on 1.0342 high. On the downside, however, below 0.9948 minor support will turn bias back to the downside for 0.9812 instead.
In the bigger picture, USD/CHF is staying in medium term sideway pattern between 0.9443/1.0342. In any case, decisive break of 1.0342 resistance is needed to confirm underlying strength. Otherwise, we'll stay neutral in the pair first. In case of another fall, we'd expect strong support from 0.9443/9548 support zone.
USD/JPY Daily Outlook
Daily Pivots: (S1) 110.64; (P) 111.11; (R1) 111.37; More....
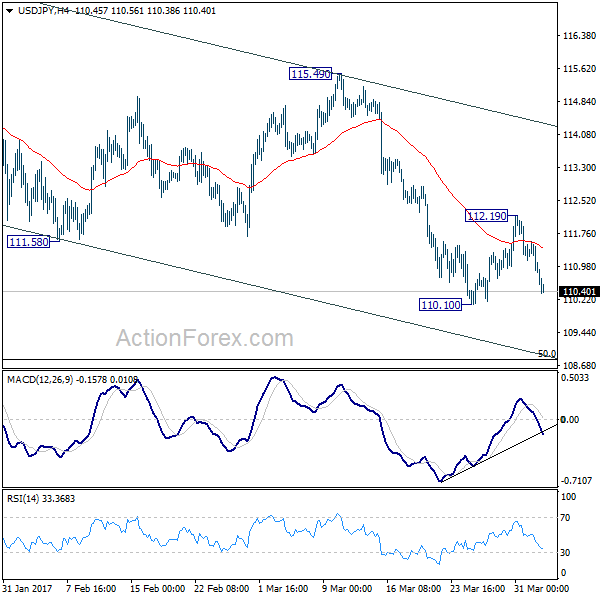
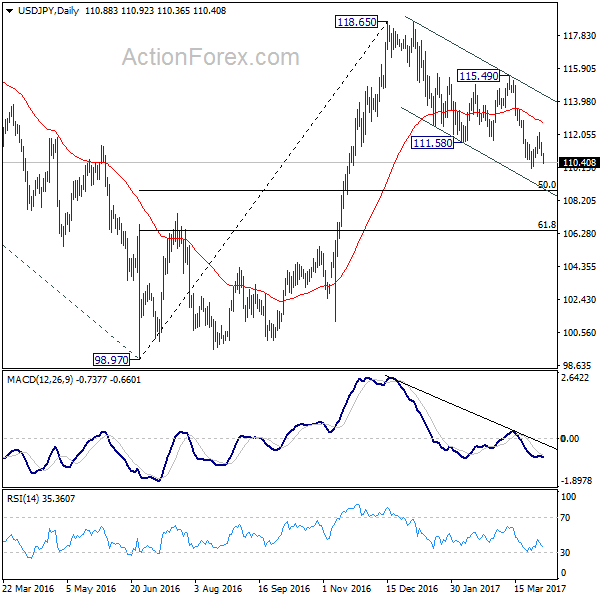
USD/JPY's fall and break of 110.99 minor support suggests that rebound from 110.10 is completed. More importantly, the corrective decline from 118.65 is still in progress. Intraday bias is turned back to the downside. Break of 110.10 will confirm fall resumption and target 50% retracement of 98.97 to 118.65 at 108.81. On the upside, break of 112.19 resistance is needed to confirm near term reversal. Otherwise, outlook will stay mildly bearish in case of recovery.
In the bigger picture, price actions from 125.85 high are seen as a corrective pattern. The impulsive structure of the rise from 98.97 suggests that the correction is completed and larger up trend is resuming. Decisive break of 125.85 will confirm and target 61.8% projection of 75.56 to 125.85 from 98.97 at 130.04 and then 135.20 long term resistance. Nonetheless, sustained trading below 55 week EMA (now at 111.16) will extend the consolidation from 125.85 with another fall through 98.97 before completion.
Daily Technical Analysis: USD/JPY Challenges Support Trend Line At 110
Currency pair USD/JPY
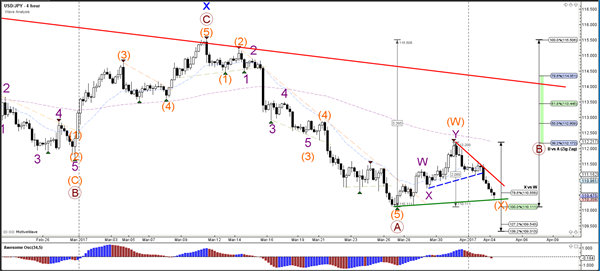
The USD/JPY broke below the support trend line (dotted blue) and is now testing the next support (green). A bounce and break above resistance (red) could indicate that wave X (orange) has been completed whereas a break below the 138.2% Fibonacci level invalidates wave X (orange).
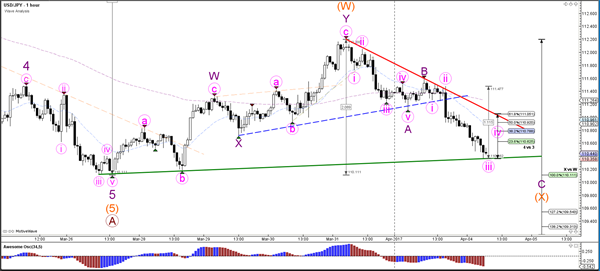
The USD/JPY break above the 61.8% Fibonacci level invalidates wave 4 (pink). A final wave 5 (pink) after a wave 4 (pink) retracement could for instance bounce at the 100% Fib level of wave X vs W (orange) and 110 psychological round level.
Currency pair EUR/USD
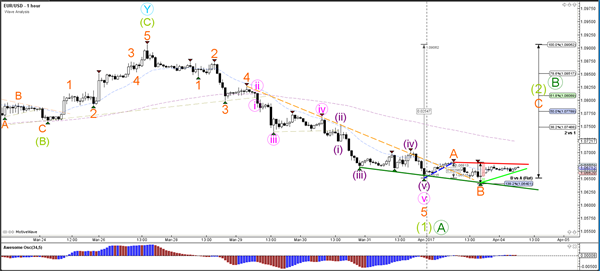
The EUR/USD is struggling to show strong bullish momentum above the resistance trend line (dotted orange). When looking at an hourly chart it seems more likely that a wave 2 or B retracement will occur soon.
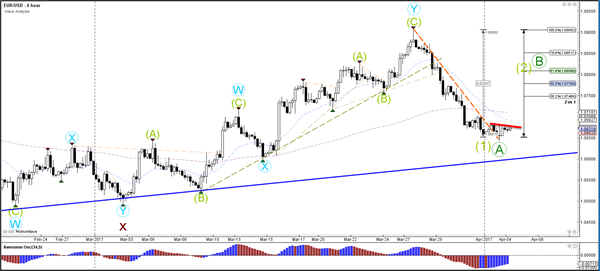
The EUR/USD could still be in a wave ABC (orange) because it did not break below the 138.2% Fibonacci level of wave B vs A. A break below that level indicates a downtrend continuation whereas a break above resistance (red) could spark a wave C (orange).
Currency pair GBP/USD
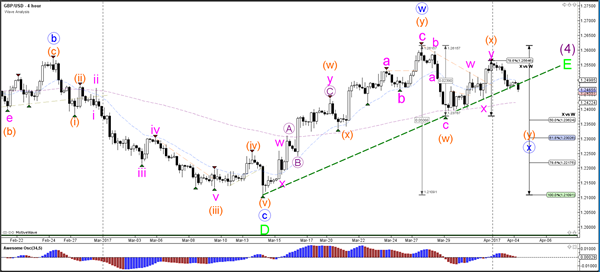
The GBP/USD failed to break above the previous top or 78.6% Fibonacci resistance level and is now breaking below the support trend line (dotted green) which changes the expected wave structure. The failure of the bullish price movement makes it a wave X (orange). Price could now be retracing to the Fibonacci levels of wave X vs W (blue).
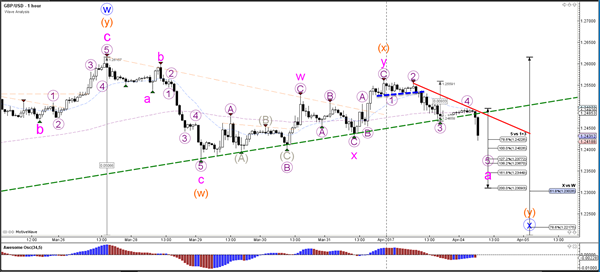
The GBP/USD bearish breakout below the support level of the mini triangle (dotted blue) made an ABC (purple) zigzag within wave Y (pink) of wave X (orange) more likely than a 12345. The wave 4 (purple) developed as a bear flag and broke earlier today. A larger ABC zigzag (pink) could occur before completing wave X (blue).
USD/CAD Daily Outlook
Daily Pivots: (S1) 1.3314; (P) 1.3356; (R1) 1.3425; More....
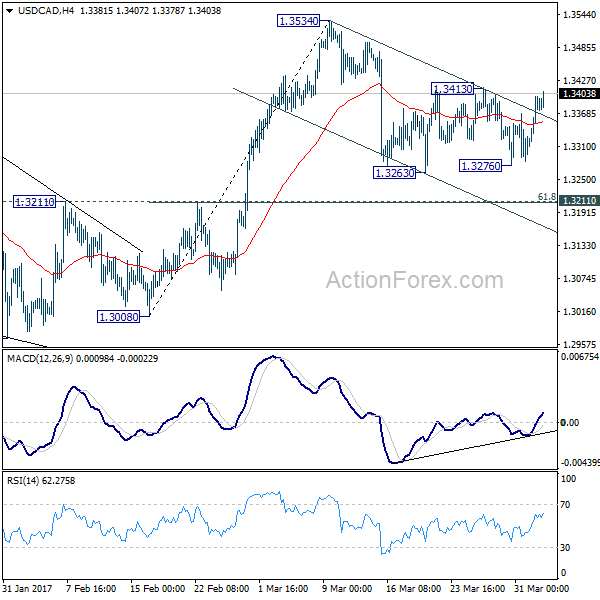
USD/CAD rebounded strongly after defending 1.3263 support but it's held below 1.3413 resistance so far. Intraday bias remains neutral for the moment. Fall from 1.3534 is seen as a correction, no change in this view. On the upside, break of 1.3413 will argue that such correction is completed and turn bias back to the upside for 1.3534 and above. On the downside, below 1.3263 will bring deeper fall. But we'd expect strong support from 1.3211 cluster level (61.8% retracement of 1.3008 to 1.3534 at 1.3209) to contain downside and bring rebound.
In the bigger picture, price actions from 1.4689 medium term top are seen as a correction pattern. The first leg has completed at 1.2460. The second leg from 1.2460 is likely still in progress and could target 61.8% retracement of 1.4689 to 1.2460 at 1.3838. We'd look for reversal signal there to start the third leg. Break of 1.2968 will argue that the third leg has already started and should at least bring at retest of 1.2460 low. However, sustained trading above 1.3838 would pave the way to retest 1.4689 high.
AUD/USD Daily Outlook
Daily Pivots: (S1) 0.7583; (P) 0.7612; (R1) 0.7632; More...
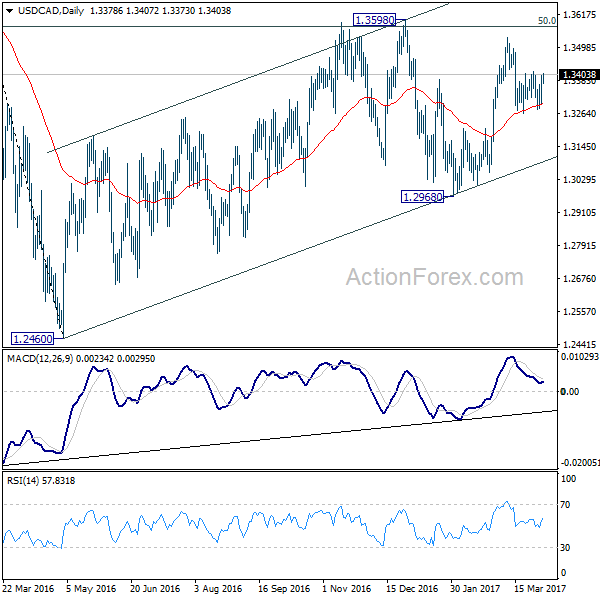
AUD/USD drops to as low as 0.7567 so far today. Break of 0.7586 support indicates resumption of whole decline from 0.7748. Intraday bias is back on the downside for 0.7490 key near term support next. As noted before, firm break of 0.7490 will confirm completion of rise from 0.7158. In such case, near term outlook will be turned bearish for 0.7158 support. On the upside, however, above 0.7678 minor resistance will turn bias back to the upside. And in this case, rise from 0.7159 could extend towards long term retracement level at 0.7849 before completion.
In the bigger picture, we're still treating price actions from 0.6826 low as a correction. And, as long as 38.2% retracement of 0.9504 to 0.6826 at 0.7849 holds, long term down trend from 1.1079 is expected to resume sooner or later. Break of 0.6826 low will target 0.6008 key support level. However, firm break of 0.7849 will indicate that rise from 0.6826 is developing into a medium term rebound, rather than a sideway pattern. In such case, stronger rise should be seen to 55 month EMA (now at 0.8165) and above.
Australian Dollar Lower as RBA Shows Concern on Employments, US Yield Down on Fed Dudley Comments
Australian dollar weakens after the Reserve bank of Australia held cash rate unchanged at 1.50% as widely expected and maintained a neutral stance. RBA reiterated in the statement that "taking account of the available information, the Board judged that holding the stance of monetary policy unchanged at this meeting would be consistent with sustainable growth in the economy and achieving the inflation target over time." The statement itself is largely unchanged from the prior one.
Nonetheless, RBA sounded more concerned on employment as it noted that "some indicators of conditions in the labour market have softened recently." Meanwhile, RBA also said that "by reinforcing strong lending standards, the recently announced supervisory measures should help address the risks associated with high and rising levels of indebtedness. " And the central bank welcomed the "reduced reliance" on interest-housing loans as a positive development.
AUD/USD and AUD/JPY resumes near term fall
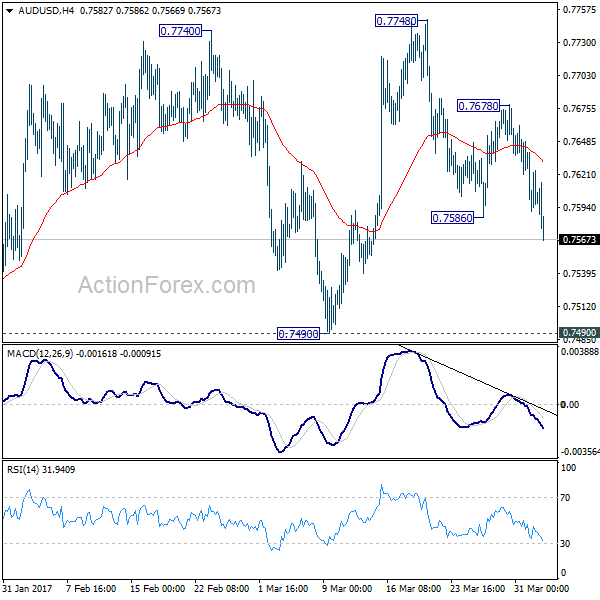
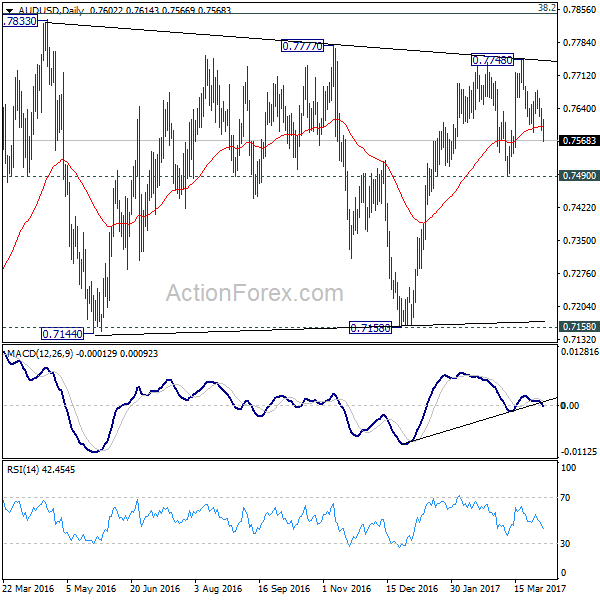
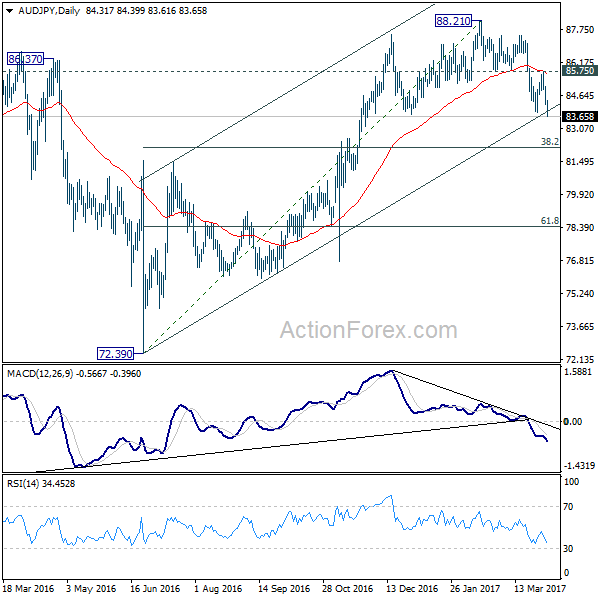
Technically, AUD/USD's break of 0.7586 today indicates that fall from 0.7748 has resumed for 0.7490 key near term support. Decisive break there will confirm short term trend reversal. AUD/JPY also dives through last week's low at 83.81. And it confirms resumption of whole decline from 88.21. Prior rejection from 55 day EMA is seen as a sign of near term bearishness. As mentioned in our weekly report, we'd expect AUD/JPY to target 38.2% retracement of 72.39 to 88.21 at 82.16.
Yen jumps after Russia terrorist attack...
Elsewhere, Yen surges broadly on risk aversion as terrorist attack at St Petersburg, Russia weighed on sentiment,According to three state-owned Russian media, at least eleven people were killed in the St Petersburg metro explosion. President Vladimir Putin suggested it would be considered as a terrorist attack "first of all". As noted in his statement released after the incident, "the causes of this event have not been determined yet, so it's too early to talk about [possible causes]… The investigation will show. Certainly, we will consider all variants, common, criminal, first of all, of a terrorist nature".
... and falling US treasury yields
Comments from New York Fed President William Dudley weighed down US treasury yields. At an interview with Bloomberg TV, Dudley indicated that the Fed is not in a rush to raise the policy rate. As he noted, "a couple more hikes this year seems reasonable… It wouldn't surprise me if sometime later this year or sometime in 2018, should the economy perform in line with our expectations, that we'll start to gradually let securities mature rather than reinvesting them,…we might actually decide at the same time to take a little pause in terms of raising short-term interest rates". 10 year yield dropped through last week's low at 2.348 to as low as 2.332 before closing at 2.350.
On the data front...
Australia trade surplus widened to AUD 3.57b in February. Japan monetary base rose 20.3% yoy in March. UK will release construction PMI in European session while Eurozone will release retail sales. Canada will released trade balance. US will release trade balance and factory orders.
AUD/USD Daily Outlook
Daily Pivots: (S1) 0.7583; (P) 0.7612; (R1) 0.7632; More...
AUD/USD drops to as low as 0.7567 so far today. Break of 0.7586 support indicates resumption of whole decline from 0.7748. Intraday bias is back on the downside for 0.7490 key near term support next. As noted before, firm break of 0.7490 will confirm completion of rise from 0.7158. In such case, near term outlook will be turned bearish for 0.7158 support. On the upside, however, above 0.7678 minor resistance will turn bias back to the upside. And in this case, rise from 0.7159 could extend towards long term retracement level at 0.7849 before completion.
In the bigger picture, we're still treating price actions from 0.6826 low as a correction. And, as long as 38.2% retracement of 0.9504 to 0.6826 at 0.7849 holds, long term down trend from 1.1079 is expected to resume sooner or later. Break of 0.6826 low will target 0.6008 key support level. However, firm break of 0.7849 will indicate that rise from 0.6826 is developing into a medium term rebound, rather than a sideway pattern. In such case, stronger rise should be seen to 55 month EMA (now at 0.8165) and above.
Economic Indicators Update
| GMT | Ccy | Events | Actual | Forecast | Previous | Revised |
|---|---|---|---|---|---|---|
| 23:50 | JPY | Monetary Base Y/Y Mar | 20.30% | 23.20% | 21.40% | |
| 1:30 | AUD | Trade Balance (AUD) Feb | 3.57B | 1.75B | 1.30B | 1.50B |
| 4:30 | AUD | RBA Rate Decision | 1.50% | 1.50% | 1.50% | |
| 8:30 | GBP | Construction PMI Mar | 52.5 | 52.5 | ||
| 9:00 | EUR | Eurozone Retail Sales M/M Feb | 0.50% | -0.10% | ||
| 12:30 | CAD | International Merchandise Trade (CAD) Feb | 0.7B | 0.8B | ||
| 12:30 | USD | Trade Balance Feb | -46.0B | -48.5B | ||
| 14:00 | USD | Factory Orders Feb | 0.90% | 1.20% | ||
| 14:00 | USD | ISM Manufacturing Mar | 57.1 | 57.7 | ||
| 14:00 | USD | ISM Prices Paid Mar | 66 | 68 | ||
| 14:00 | USD | Construction Spending M/M Feb | 1.00% | -1.00% |
Elliott Wave View: EURJPY More downside
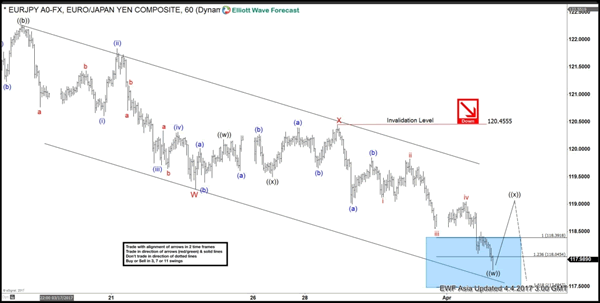
Short term Elliott Wave view in EURJPY suggests that cycle from 3/12 peak (122.89) is unfolding as a double three Elliott wave structure where Minor wave W ended at 119.28 and Minor wave X ended at 120.45. Minor wave Y is in progress and the internal is unfolding also as a double three Elliott wave structure where Minute wave ((w)) can be complete already at 117.8 and wave ((x)) bounce should correct cycle from 3/28 peak (120.445) before pair turns lower. As pair is showing a 5 swing bearish sequence from 3/12 peak as well as from 12/14/2016 peak, more downside is expected in the pair. We don’t like buying the proposed bounce and expect sellers to appear once wave ((x)) bounce is complete in 3, 7, or 11 swing provided that pivot at 3/28 high is intact in the first degree.
1 Hour EURJPY Elliott Wave Chart
Dollar Yen Reversal Back On The Cards This Week
Key Points:
- The pair should be readying to reverse in the coming sessions.
- Falling wedge and double bottom structures remain in play.
- MACD crossover suggestive of a change in medium-term trend.
The Dollar Yen had an interesting session yesterday, moving rather notably against the broader market trend as the USD picked up some momentum. Whilst much of this movement is explainable by weaker bond yields and a leaky stock market, this fundamental bias is likely to be countered in the coming session as the market repositions to better reflect the developing technical bias.
First and foremost, there are two key structures in play that are now suggestive of an impending reversal and subsequent uptrend for the USDJPY. Firstly, the long-term falling wedge remains intact and its downside constraint will be providing some solid support around the current price. However, this doesn’t necessarily indicate that we are likely to have the rather strong uptrend forecasted below. Luckily, the well-defined double bottom structure present on the chart does infer such a rally is on the way which should see buying pressure mount shortly.
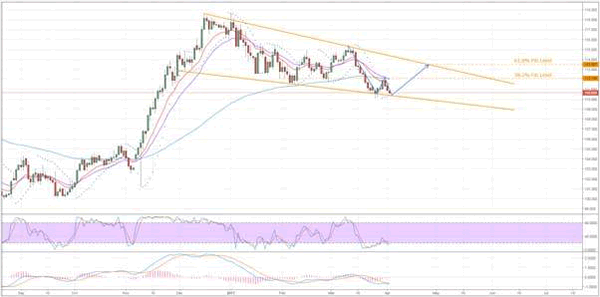
On their own, the two chart patterns may not be enough to spark the requisite shift in momentum to see the pair push higher and, ultimately, break through the 38.2% Fibonacci level. Fortunately, we have a number of other instruments that are supportive of just such a breakout. For one, the parabolic SAR retains a bullish bias and the stochastics are hovering around oversold. Moreover, the MACD oscillator is on the cusp of having a signal line crossover which could spell a change in the medium-term trend for the USDJPY.
Despite the cumulative evidence suggestive of this forecast, there remains one key hurdle that the pair needs to overcome. Specifically, that 38.2% Fibonacci level around the 112.10 mark will prove to be a major cap on upside potential given that it coincides with both the neckline of the double bottom and the 100 day EMA. However, due to the rigidity of this zone of resistance, if the venerable pair can manage to break free, the resulting uptick in buying pressure could be fairly spectacular and this could, in turn, see a sharp rally to upside constraint of the wedge.
Overall, there is a rather robust technical case for a reversal for the USDJPY which could see some serious gains claimed over the coming weeks. Indeed, if the US fundamentals begin to show a greater degree of consensus, we could see that 113.50 handle challenged significantly sooner than currently projected. Although, it’s worth mentioning, the JPY’s safe haven status has been dragging the pair lower more generally as of late and this shouldn’t be entirely ignored moving forward.