Sample Category Title
Euro Receives Reprieve But Watch For Further Falls In The Week Ahead
Key Points:
- Price action holding up due to poor U.S. bond yields and a leaky equity market.
- Draghi's pending speech will be one of the key events ahead.
- Watch for a further breakdown as sentiment swings back to the greenback.
The Euro had a torrid week after the markets seemingly unwound their hawkish view of the ECB's policy path. In addition, the EU CPI figures also proved highly disappointing, coming in well below forecasts at a meagre 1.5% y/y. Subsequently, the past week has seen a sharp reversal, away from challenging the 1.10 handle, and we have again returned to a bearish trend direction. However, there are some interesting events coming in the week ahead so let's review what is potentially on the horizon for the embattled pair.
Last week proved disastrous for the Euro as the air seemingly leaked out of the hawkish trial balloon that the ECB had floated. The market had previously taken a relatively positive view of the ECB's potential policy path on hikes following some odd comments from the central bank on near term rate hikes. However, the ECB was quick to walk those comments back last week and the balloon deflated with astonishing speed sending the Euro Dollar collapsing back below the 1.07 handle. In addition, the Eurozone CPI figures also provided a negative result at 1.5% y/y which was sharply below the economic forecast. Subsequently, the pair never really had a chance to recover and ended the week sharply lower around the 1.0656 mark.
Looking ahead, the pair is likely to focus sharply on ECB Chair Mario Draghi's pending speech, along with the always volatile U.S. Non-Farm Payroll figures. In particular, Draghi's statement is likely to provide the market with some further clarity on the ECB's near term policy path. Given the current level of uncertainty, it's unlikely that the Euro has yet reached a stable equilibrium so expect plenty of volatility following the event. In addition, the U.S. NFP figures are also due out and could further complicate the pair's near term trend. Most market analysts have estimated a 180k print but, as always, we could potentially see a fairly wide range from the metric. Subsequently, the Dollar is likely to be in-play as well which provides for a relatively volatile week for the pair.
However, early indications are suggesting that there are some negative capital flows away from the U.S. Dollar occurring. In particular, falling bond yields and a leaking equity market has seen capital flowing into safe havens overnight which has stalled the decline of the Euro Dollar, at least in the short term.
From a technical perspective, the Euro's recent rise took it right to the 1.0905 resistance zone before a rejection saw the move reverse and a sharp pullback subsequently ensued. This development argues that the rally is now over and a new corrective phase is in progress with a downside target around the 1.0494 support level. In addition, the RSI Oscillator is continuing to trend lower, within neutral territory, suggesting that there is still plenty of room to move on the downside. Subsequently, our initial bias for the week ahead is bearish with targets well under the 1.05 handle.Support is currently in place for the pair at 1.0620, 1.0495, and 1.0364. Resistance exists on the upside at 1.0677, 1.0783, and 1.0828.
Ultimately, the Euro is likely to remain under pressure over the next few days as the inevitable sentiment swing back towards the greenback is all but assured. Subsequently, near term support is unlikely to hold for the pair and we could potentially see the pair back below the 1.06 handle in the coming sessions.
Daily Technical Outlook And Review: EUR/USD, GBP/USD, USD/JPY, AUD/USD, USD/CHF, AUD/JPY, XAU/USD
EUR/USD
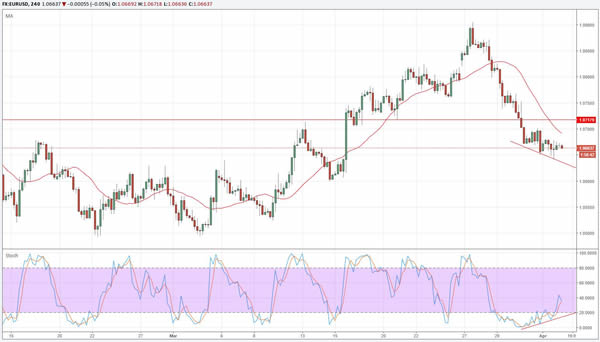
While the outlook remains bearish, there is positive Stochastic divergence on the hourly charts, suggesting the currency pair could have a small bounce before the downtrend continues.
Look for the area around 1.0720 as first stronger technical resistance. To the downside, 1.06 is key. A break below that level would signal that a move towards 1.05 could follow quickly.
GBP/USD
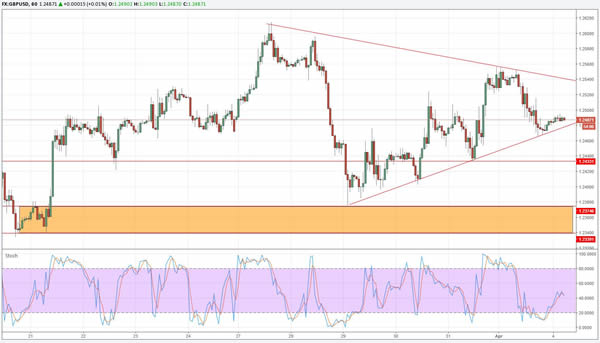
Price is consolidating within a triangle pattern on the hourly chart. After the rejection at 1.2550 resistance yesterday, it has a slight downside bias for the day. Watch the trendline support on the H1 chart.
A break below could then pave the way for a test of at least 1.2435 – an important intraday level. Strong support is then seen in the area between 1.2340-75, which would be a buy opportunity with a favourable risk-reward.
USD/JPY
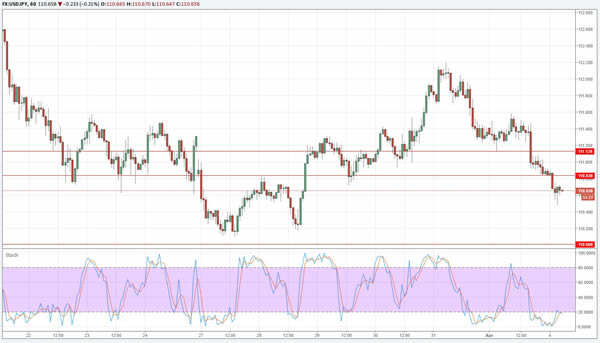
The downtrend is intact and yesterday's price action confirmed that once again. The currency pair broke below support at 110.80 and fell to 110.47 in Asia. A test of 110.00 seems likely in the near-term. That level is key.
A break below would very likely trigger momentum selling and push USD/JPY towards the next major support level around 108.00. To the topside, watch the 110.85 and 111.13 level for sell opportunities.
AUD/USD
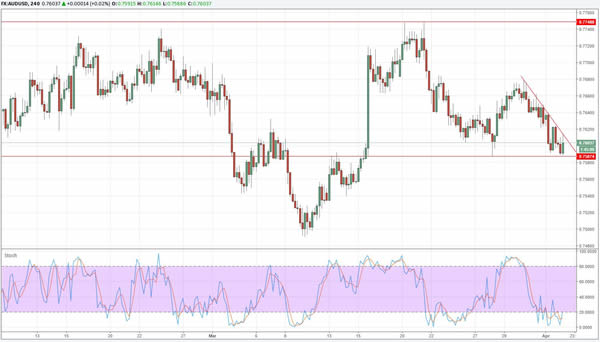
The Aussie is showing resilience. The currency pair bounced off 0.7587 support, and while it is struggling to rally, there is a lack of downside momentum as well. Nevertheless, it looks increasingly likely that the support level will crack in the near-term. This would then signal a move towards 0.75. Intraday, keep an eye on the trendline resistance on the hourly chart and the 0.7640 & 0.7680 resistance levels.
USD/CHF
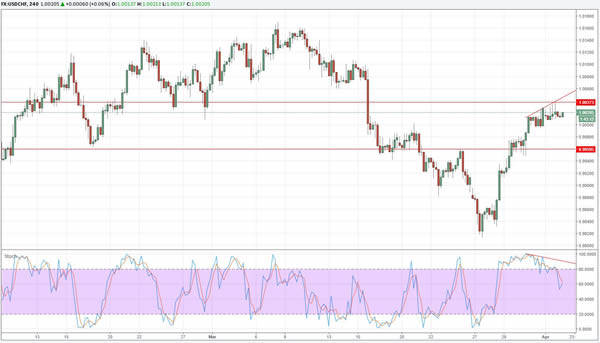
USDCHF is showing negative Stochastic divergence on the hourly charts. A correction seems likely before the uptrend continues. Traders should keep an eye on support at 0.9960 for buying opportunities.
To the topside, immediate resistance is seen at 1.0060, followed by stronger resistance at 1.01.
AUD/JPY
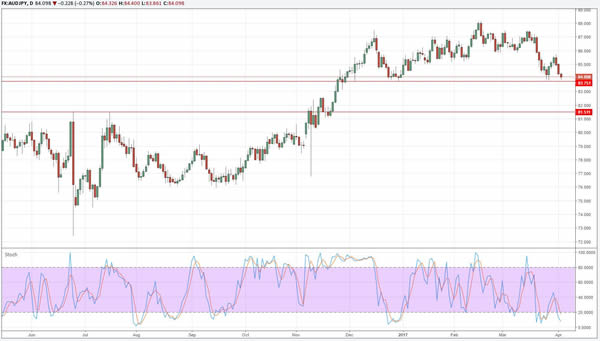
Price is approaching a very significant support level at 83.75. A clear break below it would signal that a decline towards 81.50 could follow. Medium-term, the currency pair remains in an uptrend.
A break below 83.75 would change the outlook however and confirm the top at 88.
XAU/USD
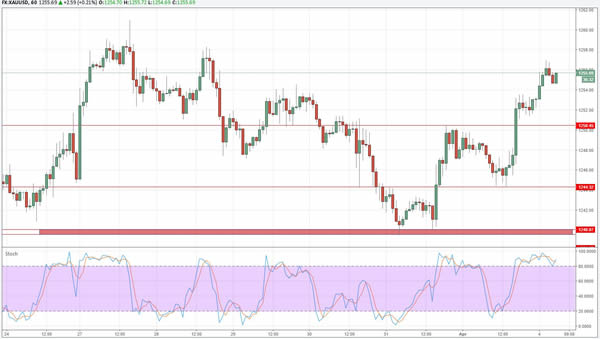
Support at 1240 held once again and Gold was able to recover to 1257 in Asia. Another test of 1263 resistance is very likely. If Gold is able to break and close the trading day above that level, an extension of the rally to at least 1292 is highly likely.
Intraday, keep an eye on 1250 and 1244 for support.
European Open Briefing: Yen Rose Against Most Other Currencies
Global Markets:
- Asian stock markets: Nikkei down 0.70 %, ASX 200 lost 0.20 %, Hang Seng and Shanghai Composite closed for holiday
- Commodities: Gold at $1258 (+0.32 %), Silver at $18.32 (+0.60 %), WTI Oil at $50.30 (+0.05 %), Brent Oil at $53.15 (+0.05 %)
- Rates: US 10-year yield at 2.33, UK 10-year yield at 1.06, German 10-year yield at 0.28
News & Data:
- Australian Trade Balance (AUD) Feb: 3.574B (exp 1.800B; prev 1.302B)
- Australian Exports (MoM) Feb: 1.0% (prev -3.0%)
- Australian Imports (MoM) Feb: -5.0% (prev 4.0%)
- Australian ANZ Roy Morgan Weekly Consumer Confidence Index 2-Apr: 111.1 (prev 113.8)
- New Zealand NZIER Business Confidence Q1: 17.0% (prev 28.0%)
- South Korean CPI (YoY) Mar: 2.2% (exp 2.0%; prev 1.9%)
- South Korean CPI (MoM) Mar: 0.0% (exp -0.2%; prev 0.3%)
- Asia stocks skittish as investors seek safe havens before Trump-Xi meeting – RTRS
Markets Update:
There was a risk-off sentiment in Asia with stock markets down on the day, and the Japanese Yen the best performing currency overnight. Traders in Asia are waiting for the upcoming meeting between US President Trump and the Chinese President Xi Jinping. Trump has criticized China many times before, accusing them of currency manipulation and 'stealing US jobs'. Therefore, the market is interested to see how the meeting will go and if it will calm the situation between the two countries.
In FX, the Yen rose against most other currencies. USD/JPY came under pressure again, and could soon test 110.00. A break below would be quite bearish and signal a move towards 108. Other than that, price action in most currency pairs was quiet. Several key markets in Asia were closed for a holiday today, so volumes were lower than usual.
Upcoming Events:
- 09:30 GMT – UK Construction PMI
- 10:00 GMT – Euro Zone Retail Sales
- 10:15 GMT – RBA Governor Lowe speaks
- 13:30 GMT – Canadian Trade Balance
- 14:30 GMT – ECB President Draghi speaks
- 15:00 GMT – US Factory Orders
Daily Technical Analysis: EURUSD, GBPUSD, USDJPY, USDCHF
EURUSD
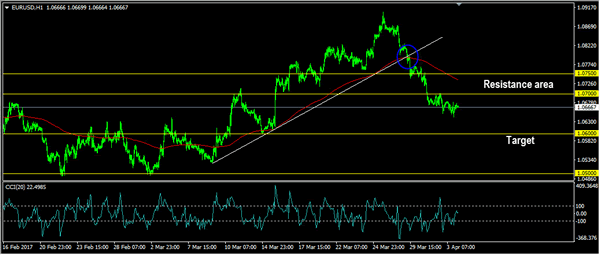
The EURUSD was indecisive yesterday. The bias remains bearish in nearest term testing 1.0600 area. Immediate resistance remains at 1.0700. A clear break above that area could lead price to neutral zone in nearest term but only a clear break back above 1.0750 would interrupt the current short-term bearish bias following the appearance of a “shooting star” formation on daily chart last week. On the downside, a clear break and daily close below 1.0600 would expose 1.0500 this week. Overall I remain neutral.
GBPUSD
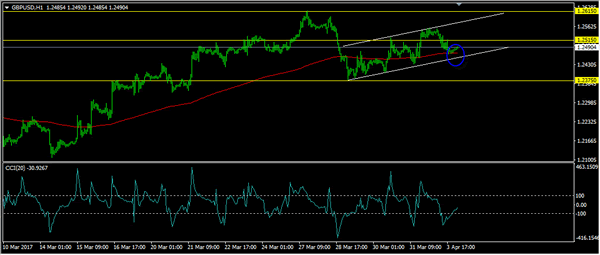
The GBPUSD had a bearish momentum yesterday bottomed at 1.2465. The bias is bearish in nearest term testing the lower line of the bullish channel as you can see on my H1 chart below located around 1.2450 area. A clear break below that area would expose 1.2400 – 1.2375 region. Immediate resistance is seen around 1.2515/30 area. A clear break back above that area could lead price to neutral zone in nearest term but would keep the short-term bullish bias remains alive and kicking testing 1.2615 region. Overall I remain neutral.
USDJPY
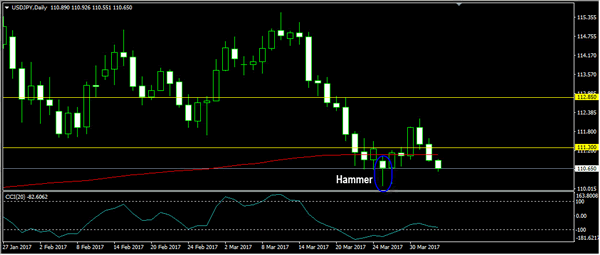
The USDJPY had a bearish momentum yesterday bottomed at 110.85 and hit 110.55 earlier today in Asian session. The bias is bearish in nearest term testing 110.10 key support. A clear break and daily close below that area would expose 108.50 region this week and establish a longer term bearish trend with 111.30 – 112.00 as key resistance. Immediate resistance is seen around 111.30. A clear break and daily close back above that area would keep the “hammer” bullish reversal scenario remains alive and kicking testing 112.00 or higher.
USDCHF
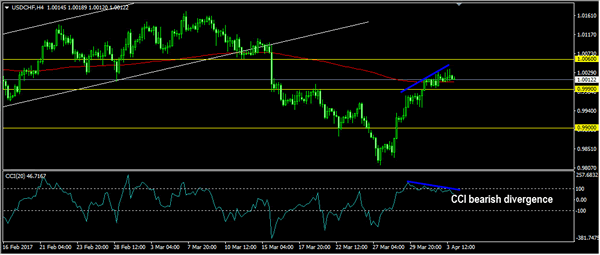
The USDCHF was indecisive yesterday. The bias remains bullish in nearest term testing 1.0060 but as you can see on my H4 chart below we have a CCI bearish divergence suggests a potential bearish pullback especially if price breaks below 0.9990 testing 0.9950 or lower. On the upside, a clear break and daily close above 1.0060 would expose 1.0120 or higher. Overall I remain neutral.
(RBA) Statement by Philip Lowe, Governor: Monetary Policy Decision
At its meeting today, the Board decided to leave the cash rate unchanged at 1.50 per cent.
Conditions in the global economy have improved over recent months. Both global trade and industrial production have picked up. Labour markets have tightened in many countries. Above-trend growth is expected in a number of advanced economies, although uncertainties remain. In China, growth is being supported by higher spending on infrastructure and property construction. This composition of growth and the rapid increase in borrowing mean that the medium-term risks to Chinese growth remain. The improvement in the global economy has contributed to higher commodity prices, which are providing a significant boost to Australia's national income.
Headline inflation rates have moved higher in most countries, partly reflecting the higher commodity prices. Core inflation remains low. Long-term bond yields are higher than last year, although in a historical context they remain low. Interest rates have increased in the United States and there is no longer an expectation of additional monetary easing in other major economies. Financial markets have been functioning effectively.
The Australian economy is continuing its transition following the end of the mining investment boom. Recent data are consistent with ongoing moderate growth. Most measures of business confidence are at, or above, average and non-mining business investment has risen over the past year. At the same time, some indicators of conditions in the labour market have softened recently. In particular, the unemployment rate has moved a little higher and employment growth is modest. The various forward-looking indicators still point to continued growth in employment over the period ahead. Wage growth remains slow.
The outlook continues to be supported by the low level of interest rates. Lenders have recently announced increases in mortgage rates, particularly those paid by investors. Financial institutions remain in a good position to lend. The depreciation of the exchange rate since 2013 has also assisted the economy in its transition following the mining investment boom. An appreciating exchange rate would complicate this adjustment.
Inflation remains quite low. Headline inflation is expected to pick up over the course of 2017 to be above 2 per cent. The rise in underlying inflation is expected to be a bit more gradual with growth in labour costs remaining subdued.
Conditions in the housing market continue to vary considerably around the country. In some markets, conditions are strong and prices are rising briskly. In other markets, prices are declining. In the eastern capital cities, a considerable additional supply of apartments is scheduled to come on stream over the next couple of years. Growth in rents is the slowest for two decades.
Growth in household borrowing, largely to purchase housing, continues to outpace growth in household income. By reinforcing strong lending standards, the recently announced supervisory measures should help address the risks associated with high and rising levels of indebtedness. Lenders need to ensure that the serviceability metrics that they use are appropriate for current conditions. A reduced reliance on interest-only housing loans in the Australian market would also be a positive development.
Taking account of the available information, the Board judged that holding the stance of monetary policy unchanged at this meeting would be consistent with sustainable growth in the economy and achieving the inflation target over time.
Australian SPI200 Breakout And Retest
The Australian SPI200 index has finally broken through the resistance level that we watched go from a double top to a triple top over the last month or so.
SPI200 Daily:
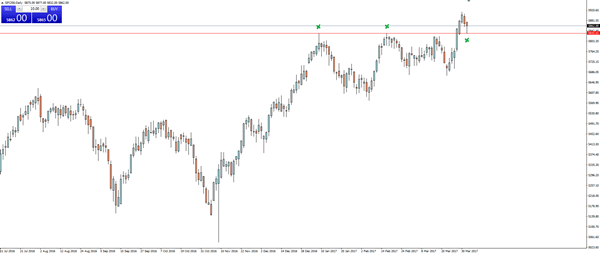
As you can see clearly on the daily chart above, price has broken through the level and has pulled back to retest the broken support as resistance.
TO THE PIP!
This is the sort of thing that keeps me coming back to technical analysis time and time again.
Just keep an eye on the economic calendar with today's RBA rate decision likely to be a little more lively than the most recent decisions thanks to the resurgence of Sydney/Melbourne house prices chatter.
Elliott Wave Trade Ideas Performance Update
The long position entered in EUR/GBP at 0.8620 finally met our upside upside at 0.8720 as the pair rebounded to 0.8735, however, euro ran into renewed selling interest there and the pair then tumbled from there to as low as 0.8485 late last week.
A short position was entered in USD/CAD at 1.3340, however, as the greenback continued finding decent demand just above previous support at 1.3278 (last week’s low) and has rebounded, we exited the position earlier today at 1.3359 with small loss.
The long positions entered in AUD/USD the week before at 0.7645 is still holding at the moment.
In short, 3 positions were entered with total profit of 81 points and the positions are listed below.
22 Mar: AUD/USD - Long at 0.7645,
23 Mar: EUR/GBP - Long at 0.8620, exited at 0.8720 (+ 100 points)
31 Mar: USD/CAD - Short at 1.3340, exited at 1.3359 (- 19 points)
| AUD EUR/JPY EUR/GBP CAD
Jan - 15 -275 - 35 -120
Feb + 140 -17 - 40 +11
Mar + 20 +115 +132 - 19
Apr
May
Jun
Jul
Aug
Sep
Oct
Nov
Dec
Y-T-D + 145 - 177 + 57 + 38
Candlesticks and Ichimoku Trade Ideas Performance Update
We sold dollar against yen last week at 111.20 and although the pair retreated from 111.32, the greenback found renewed buying interest at 110.72 and rebounded again, we exited the position with small profit at 111.00 and price eventually rose to as high as 112.20 before dropping again.
We also sold dollar against euro and Swiss franc last week, a long position was entered in EUR/USD at 1.0800 and a short position was entered in USD/CHF at 0.9910, both positions ended with different levels of loss as the greenback reversed previous weakness.
No position was entered in cable last week.
In short, 3 positions were entered among all 4 currency pairs with total loss of 38 points and the position are listed below:
29 Mar : USD/JPY - Short at 111.20, exited at 111.00 (+ 20 points)
29 Mar : EUR/USD - Long at 1.0800, exited at 1.0765 (- 35 points)
29 Mar : USD/CHF - Short at 0.9910, exited at 0.9933 (- 23 points)
| JPY EUR CHF GBP
Jan + 167 - 85 - 10 + 50
Feb + 200 +150 +93 - 59
Mar -23 -70 -23 - 35
Apr
May
Jun
Jul
Aug
Sep
Oct
Nov
Dec
Y-T-D + 344 - 10 +60 -44
Trade Idea Wrap-up: USD/CHF – Buy at 0.9950
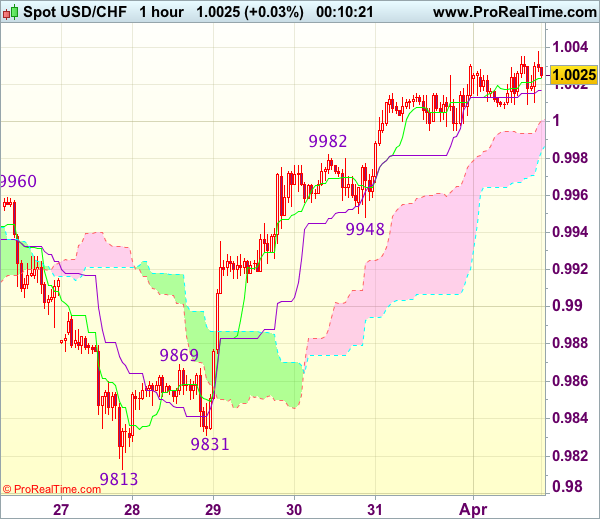
USD/CHF - 1.0025
Most recent candlesticks pattern : N/A
Trend : Near term up
Tenkan-Sen level : 1.0024
Kijun-Sen level : 1.0017
Ichimoku cloud top : 1.0001
Ichimoku cloud bottom : 0.9984
Original strategy :
Buy at 0.9950, Target: 1.0050, Stop: 0.9915
Position : -
Target : -
Stop : -
New strategy :
Buy at 0.9950, Target: 1.0050, Stop: 0.9915
Position : -
Target : -
Stop : -
As the greenback has continued trading with a firm undertone, suggesting recent rise from last week’s low at 0.9813 is still in progress and bullishness remains for this move to extend gain to previous support at 1.0060 (now resistance), however, loss of upward momentum should prevent sharp move beyond resistance at 1.0109, risk from there has increased for a retreat to take place later.
In view of this, would not chase this rise here and would be prudent to buy dollar on pullback as said support at 0.9948 should limit downside. Below 0.9931 (50% Fibonacci retracement of 0.9831-1.0031) would abort and signal top is formed instead, bring correction to 0.9905-10 (61.8% Fibonacci retracement) but reckon previous resistance at 0.9869 would hold from here.
Trade Idea Wrap-up: GBP/USD – Stand aside
GBP/USD - 1.2482
Most recent candlesticks pattern : N/A
Trend : Near term up
Tenkan-Sen level : 1.2501
Kijun-Sen level : 1.2512
Ichimoku cloud top : 1.2486
Ichimoku cloud bottom : 1.2468
New strategy :
Stand aside
Position : -
Target : -
Stop : -
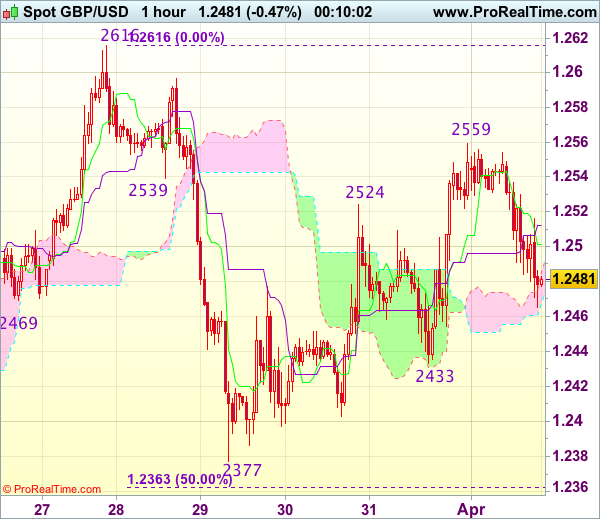
Although cable has retreated after meeting resistance at 1.2559 on Friday on active cross-trading in sterling and consolidation with mild downside is seen for weakness to 1.2450-55, break of support at 1.2433 is needed to signal top has been formed at 1.2559, bring further fall towards 1.2400-05. Looking ahead, only a drop below 1.2400-05 would signal the rebound from 1.2377 has ended, bring retest of 1.2377 first.
In view of this, would not chase this fall here and would be prudent to stand aside for now. Above 1.2515-20 would bring another bounce towards 1.2559 but break there is needed to signal the erratic rise from 1.2377 (last week’s low) is still in progress and may extend gain towards 1.2570-75, however, as broad outlook remains consolidative, reckon upside would be limited to 1.2595-00 and price should falter below last week’s high at 1.2616.