
Sample Category Title
EUR/GBP Daily Outlook
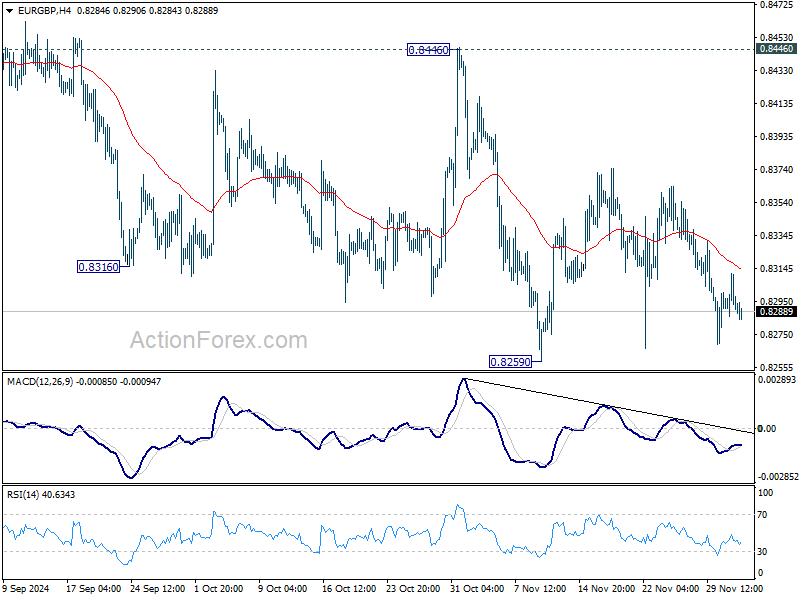
Daily Pivots: (S1) 0.8282; (P) 0.8298; (R1) 0.8308; More...
Intraday bias in EUR/GBP remains neutral as range trading continues. Further decline is expected with 0.8446 resistance intact. On the downside, decisive break of 0.8259 will resume larger down trend to 0.8201 key support.
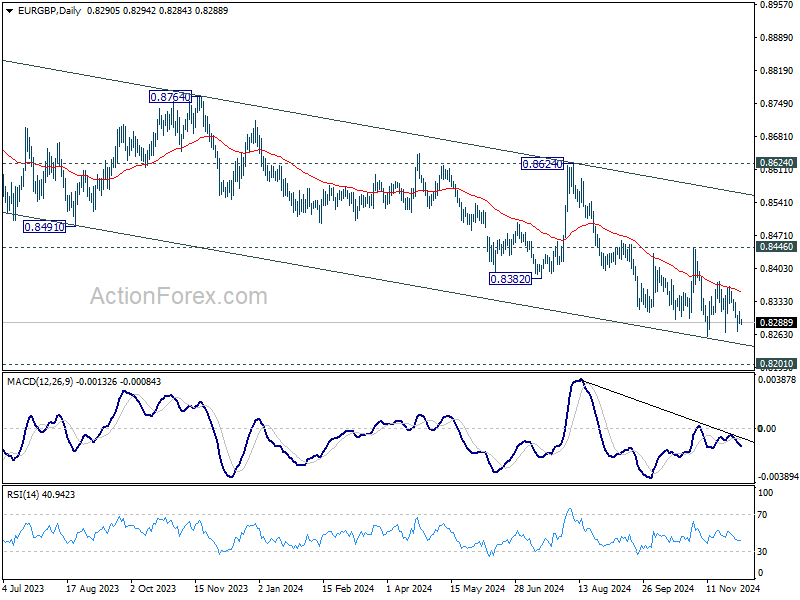
In the bigger picture, down trend from 0.9267 (2022 high) is in progress. Next target is 0.8201 (2022 low), but strong support should be seen there to bring rebound. However, outlook will remain bearish as long as 0.8624 resistance holds even in case of strong rebound. Decisive break of 0.8201 will indicate long term bearish reversal.
Front End Yields Remain More Vulnerable Since a December Rate Cut by Fed Still Not Fully Priced in.
Markets
Yesterday’s shock decision by South Korean president Yoon of the conservative People Power Party to declare martial law spiced up an otherwise uneventful trading session. Yoon backtracked after parliament voted unanimously against. The opposition, which holds a majority, moved to impeach Yoon with a vote possible as soon as this Friday. Yoon’s exit is all but certain. It’s unclear yet what it means for SK (geo)politics and its economy but investor confidence in the country was severely violated. The central bank already pledged to offer all the liquidity needed. The SK won tanked to USD/KRW 1444 from the low 1400 area before returning to 1411 in trading this morning. Stock markets underperform Asian peers (-2%). US Treasuries yesterday attracted safe haven flows during the chaos but finished with losses anyway. A sharper than expected uptick in US job openings to 7.74mln helped yields rising up to 4 bps at the long end of the curve. We’ve been looking for that part to show some bottoming out after the correction over the past few days. The economic calendar today could support the process with the release of the US services ISM. The expected 55.7 would be in line with October’s 56 and is testament of a solid US consumer and economy and thus a strong dollar. The ADP job report ahead of Friday’s payrolls report is forecasted at a 150k employment increase. Front end yields remain more vulnerable since a December rate cut by the Fed is still not fully priced in. Chair Powell is appearing in a moderated discussion later today and will be closely watched for some clues. The German curve bear flattened with net daily changes varying between 4.2 bps (2-yr) to 0.6 bps (30-yr). It’s been the first gain for the likes of the 10-yr (+2 bps) in 10 (!) trading days. We’re wary to call it the start of a bottoming out yet but it may be a first sign. Pressure meanwhile in Germany is rising to lift the debt brake. Bundesbank president Nagel in the Financial Times calling on Berlin to soften the spending rules is telling. ECB chair Lagarde appears before the European Parliament today. It’s her last opportunity to shape market expectations for the December policy meeting before the blackout period kicks in. A 25 bps rate cut is all but certain but the market refuses to let the idea of a 50 bps move completely go (15% chance priced in currently). Market expectations for a 1.75% terminal rate in our view are too aggressive. Bank of England governor Bailey is also in the picture today. Markets are rightly so expecting nothing from the central bank at least until the February meeting. Bailey swapped his activist approach for a guarded stance after the Labour Budget was released and higher-than-expected October CPI is all the reason to stick to it. We’re keeping a close eye on France as well today. Parliament will vote on a motion of no confidence in late afternoon (> 16:00). We expect the government to fall as a result, plunging the country into another episode of political chaos. The topic may continue to weigh on the euro.
News & Views
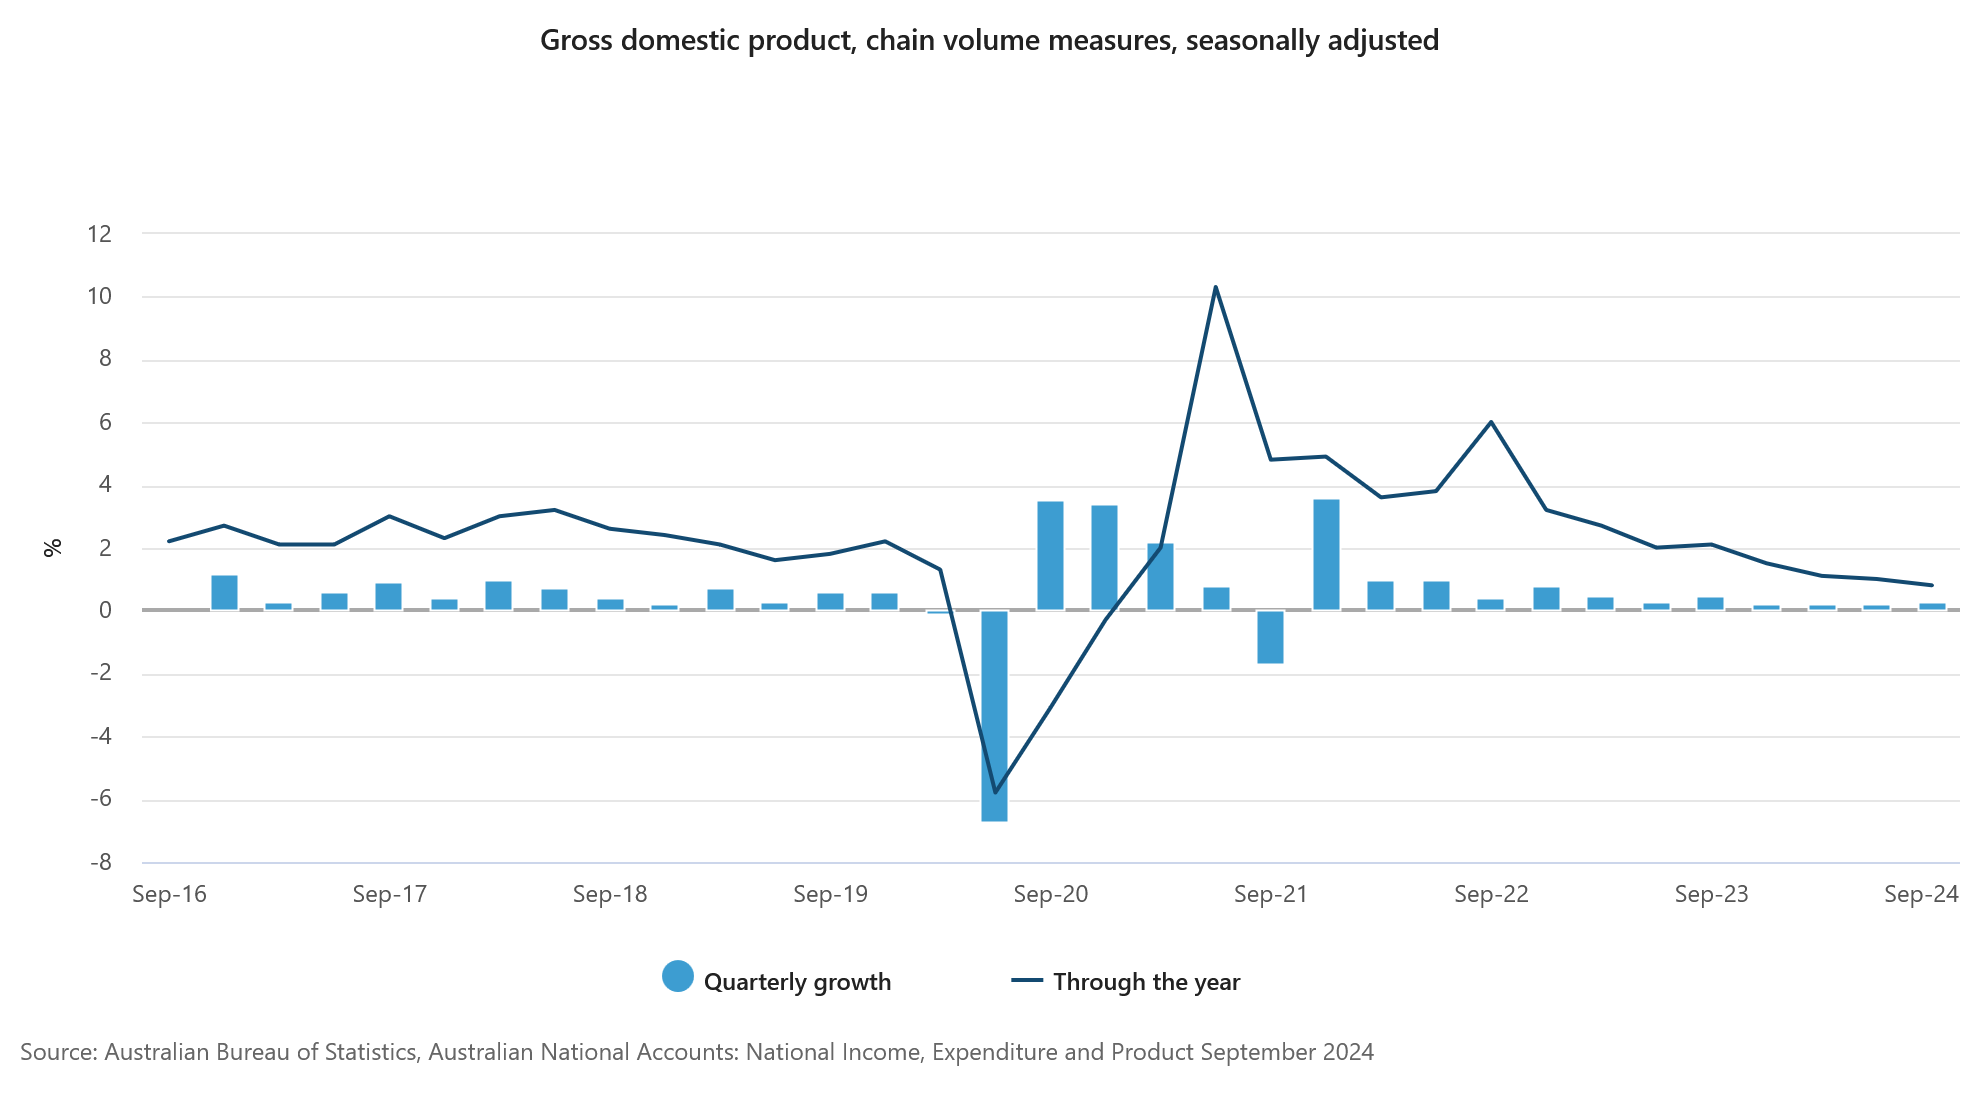
Australian GDP in Q3 grew at a lower than expected 0.3% Q/Q and 0.8% Y/Y according to data published by the Australian Bureau of Statistics (ABS). Growth was mainly driven by public sector expenditures. Public investment rose 6.3 in the September quarter, albeit coming after three quarterly falls. Government spending rose 1.4%, including social benefits paid to households and energy cost relief rebates. Household spending was flat, coming after a 0.3% decline in the June quarter even as the poor Q3 performance was affected by statistical issues related to the energy relief measures. Net trade contributed 0.1% ppt to growth as exports grew 0.2% and imports declined 0.3%. There was a 0.4% negative contribution from inventories. Meagre economic growth is fueling the debate whether there is room for the RBA to cut policy rates earlier than wat was anticipated until now. Money markets now fully discount a 25 bps cut at the April meeting. The 3-y Australian government bond yield declines 8 bps this morning. The Aussie dollar from the 0.6485 area to currently trade near 0.644.
The Czech government yesterday approved the 2025 budget bill which includes a continuation of the fiscal consolidation. The budget deficit will be reduced further to CZK 241bln from a CZK 282bln target this year. The new budget should reduce the deficit below 3.0%. KBC expects the government budget balance to decline further from a deficit of 2.8% this year to 2.1% next year. The center right ruling party is facing elections next year with the opposition party of former PM Babis aiming to raise public spending to revive the economy.
Relaxed into French No-Confidence Vote
South Korea briefly stole the light from the French political chaos after President Yoon suddenly imposed the martial law yesterday accusing the opposition party – which holds the majority in the parliament – of paralysing his administration, only to lift it a few hours later. The Korean won and the stocks fell, and the volatility in broader Asian markets and cryptocurrencies was higher, but the impact remained limited, the US and European futures are set for a positive open and France could safely come back to the front of the scene with lawmakers preparing to hold a no-confidence vote today and to take Barnier’s government down. You can’t tell that risk by looking at the CAC 40 – which closed 0.26% higher yesterday, and at the French 10-year yield – which eased to the lowest levels since fall over the last week. But the CAC 40 is set to print its biggest performance gap in three decades with the German DAX index. And the spread between the 10-year French and German papers has advanced to the highest levels since the euro debt crisis of a decade ago. This being said, the soft reaction to the French chaos is surprising.
In the US, sentiment remains cheerful and cozy at the start of December. The S&P500 consolidated gains near its ATH level, Nasdaq 100 hit a fresh record while Dow Jones diverged negatively for the second straight session. Data-wise, the latest figures released yesterday showed that the job openings in October rose more than expected by analysts. Optimism rose too, though less than expected. Federal Reserve’s (Fed) Mary Daly said that there is no certainty that the Fed will cut the rates this month, but that, the option remains on the table. Activity on Fed funds futures gives more than 70% chance for another 25bp cut from this month’s FOMC meeting. This week’s jobs, and next week’s inflation data will say the last word. Due today, the ADP report is expected to print lower job additions last month compared to a month ago, while the expectation for Friday’s NFP is around 200K new job additions, with slightly higher unemployment rate and slightly lower wages growth. Soft data will have no difficulty convincing the Fed doves that another 25bp is on its way this month, while a strong-looking set of data could add some suspense to the mix, but eventually, the Fed will certainly cut.
As such, the US dollar bulls prefer to sit on the sidelines, and the US dollar index consolidates around the minor 23.6% Fibonacci retracement on September to November rally. The EURUSD takes the opportunity to catch its breath before another potentially hectic session – depending on what the French politicians decide to do with Barnier and his ambition to reduce the French budget deficit toward the EU targets. We may not see a major selloff in single currency if the French government is taken down, as that possibility must be fully priced in by now. But the pair will remain in the bearish trend below the 1.0672 level – the major 38.2% retracement – justified by the dovish European Central Bank (ECB) expectations amid the doomy economic fundamentals, the messy politics in core European countries and Trump’s tariff threats.
In Japan, the USDJPY continues to test the 100-DMA to the downside, but each attempt ends with a fresh rebound back to the 150 level. While the idea that the Bank of Japan (BoJ) could hike the rates one more time before this year ends keeps the yen bears contained, investors around the world sound unwilling to abandon their carry trade strategy, as even another rate hike in Japan wouldn’t squeeze the rate differential enough to walk out of the yen as a funding currency. That means that the yen’s recovery path won’t be smooth, and it’s good news for the global markets. The last time the yen appreciated significantly – it was during summer – the global indices were heavily hit.
In energy, US crude rallied more than 2.5% to above $70pb on news that the US will impose more restrictions on the Iranian oil exports and on chatter that OPEC is getting closer to delaying its plans to restore production by another 3 months. The decision announcement is due tomorrow. The short-term risks remain tilted to the upside, but delaying production will only prevent global oil glut from getting worse, but won’t reverse it. As such, once the geopolitical news and OPEC decision are absorbed, the bears will be happy to return to the field. Short-term price rallies are interesting top selling opportunities. The bearish trend is valid below the $72.85pb level, the major 38.2% retracement on summer selloff.
French Politics in Limbo as Barnier Faces No-Confidence Vote
In focus today
The no-confidence vote against French PM Michel Barnier is set to take center stage and is scheduled this afternoon at 16:00 CET. As Marine Le Pen's party announced they would support the vote of no confidence, the government will most likely collapse this evening. President Macron will have to take on the difficult task of appointing a new prime minister who can survive no confidence votes in the National Assembly. The current stalemate in French politics is likely to persist, with no large reforms to be pushed through.
In the afternoon, both US ADP private sector employment and ISM services data for November are due for release. The former will provide an early sense of what to expect from the pivotal NFP print coming up on Friday, weekly jobless claims have still pointed towards solid labor market conditions. We will also follow if the ISM index shows a similar sharp increase as its PMI counterpart did earlier. Fed chair Powell will participate in an interview today at an event hosted by the NY Times.
In the euro area, focus turns to the release of the final service and composite PMIs for November. The manufacturing PMI this Monday remained exactly unchanged as expected at 45.2. The flash releases triggered significant market reactions, so we are closely monitoring the final release.
Economic and market news
What happened overnight
In China, the Caixin Services PMI for November saw a slight decrease to 51.5 from 52.0 in October, due to slower new business growth and worries about additional tariffs under Trump's administration.
What happened yesterday
In South Korea, President Yoon Suk Yeol unexpectedly declared martial law in a move targeting "shameless pro-North Korean anti-state forces". Protesters took to the streets and just hours later President Yoon moved to lift the declaration, abiding to the unanimous vote by parliament against the measure. USD/KRW surged to the highest level in two years, albeit to some degree slid back down as martial law was rescinded. Lawmakers are now calling for President Yoon to either resign or face impeachment.
In the US, October JOLTs job openings came out on the strong side, although with negative revisions. Actual hiring slowed down to 5.3M from 5.6M, but involuntary layoffs also decreased to 1.6M from 1.8M the previous month. The ratio of job openings to unemployed job seekers remained at 1.11, very close to the average level observed over the past 5 months. EUR/USD ticked slightly lower following the release given the big higher job openings.
Federal Reserve policy makers Daly and Kugler both signalled that they believe inflation is set to reach the 2% target rate but avoided giving any guidance on whether they support a rate cut at the Fed's December meeting, with investors currently pricing just below 20bp for the meeting. We expect a 25bp cut in December.
In Switzerland, inflation for November was in line with expectations. Headline came in at 0.7% y/y (cons: 0.7%, prior: 0.6%) and core at 0.9% y/y (cons: 0.9%, prior: 0.8%). Note the SNB's projection for Q4 is 1.0%, thus pointing to inflation once again undershooting the SNB's forecast. EUR/CHF was close to unchanged on the release with markets evenly split between a 25bp and 50bp cut at the next quarterly meeting in December. Key will be continued developments in the real effective CHF as it plays a large role for imported inflation.
Equities: Global equities rose yesterday, with markets in Asia and Europe outperforming those in the US. Once again, cyclicals outperformed defensives, further widening the already historically significant outperformance observed over the last two years. Concurrently, the VIX ticked lower from already low levels. This reflects the benign macro environment and optimism surrounding the new US administration, which is encouraging investors to take on more risks, leading equities to reach new all-time highs. The next significant event that could disrupt the current narrative is the NFP data release on Friday. In the US yesterday, the Dow closed down 0.2%, the S&P 500 was up 0.1%, the Nasdaq increased by 0.4%, and the Russell 2000 decreased by 0.7%. Most Asian markets are higher this morning, except for South Korea, which is bucking the trend. US futures pointing higher this morning, while Europe is a more mixed picture.
FI: There were modest movements in global bond yields yesterday despite the political uncertainty in France and South Korea and comments from various Fed officials that the Federal Reserve is still looking to cut rates, but they gave no clear indication for the upcoming meeting in December about whether they would cut rates. Hence, there is significant focus on the labour market data on Friday as well as comments from Fed chairman Powell later this week.
FX: EUR/USD ended the day slightly north of the 1.05 mark following a slight topside surprise to the JOLTS data. EUR/CHF was close to unchanged following a rather uneventful November inflation print, which came in in line with expectations. Slightly higher oil prices and an underperforming Norwegian fixed income space have delivered some support to the NOK in the early part of this week's trading with EUR/NOK now back close to 11.60 and NOK/SEK re-approaching parity. USD/CNY has continued to move higher driven by both renewed divergence in monetary policy expectations between US and China as well as anticipation of US tariff hikes.
EUR/AUD Daily Outlook
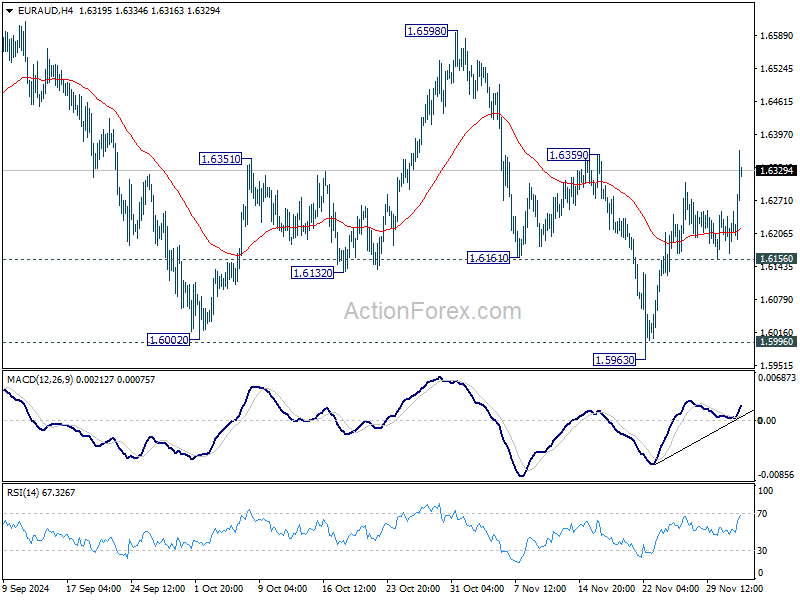
Daily Pivots: (S1) 1.6164; (P) 1.6208; (R1) 1.6247; More...
Immediate focus is now on 1.6359 resistance in EUR/AUD as rebound from 1.5963 resumes today. Firm break there will be the first sign of bullish trend reversal, after successfully defending 1.5996 key support level. Further rally should then be seen to 1.6598 resistance for confirmation. Nevertheless, break of 1.6156 support will turn bias back to the downside for 1.5996 again.
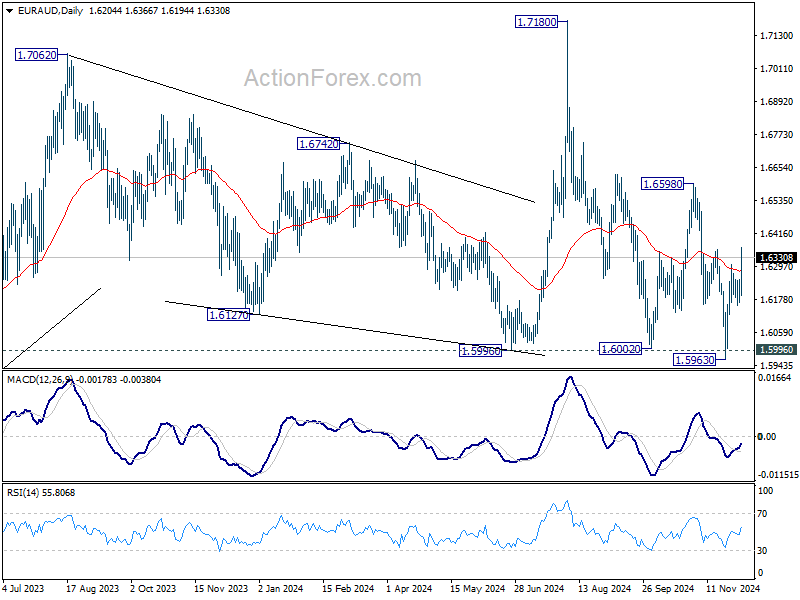
In the bigger picture, immediate focus is now on 1.5996 key support level. Sustained break there will argue that whole up trend from 1.4281 (2022 low) is already reversing. Deeper decline would be seen to 61.8% retracement of 1.4281 to 1.7180 at 1.5388, even as a correction. Nevertheless, strong rebound from current level, followed by break of 1.6359 resistance, will keep medium term outlook neutral at worst.
Aussie Weakens on Soft GDP, Markets Steady Despite South Korean Political Turmoil
Australian Dollar faced broad declines in Asian trading following Q3 GDP data that fell short of expectations, marking a continued slowdown in the economy. Despite the weakness, the data isn’t severe enough to prompt an immediate policy response from RBA, either this month or in February. The central bank’s decision-making remains anchored on progress in services disinflation, easing labor market pressures, and broader signs of domestic economic adjustment. Nonetheless, this GDP reading is still a step forward, albeit tiny. .
Asian markets, meanwhile, remained largely steady despite political chaos in South Korea. President Yoon Suk Yeol’s surprise declaration of martial law to counter alleged “anti-state forces” among his political opponents was met with unanimous rejection by lawmakers, forcing him to rescind the order swiftly. The political backlash now leaves Yoon facing the possibility of impeachment. Despite the drama, KOSPI fell only -1.3%, and market reactions elsewhere, such as an initial spike in Yen and a drop in US Treasury yields, quickly reversed.
So far this week, Aussie and Kiwi have taken over from European majors as the weakest performers, followed by Swiss Franc. Dollar and Yen remain in a tight race for the strongest currency, with Sterling trailing as a distant third. Euro and Canadian Dollar occupy middle positions in the currency rankings.
On the technical front, attention is still centered on whether the US 10-year Treasury yield can defend key cluster support around the critical 4.1% to 4.2% range. This represents 55 D EMA (now at 4.223) and 38.2% retracement of 3.603 to 4.505 at 4.160. Strong bounce from current level will keep the rally from 3.603 alive, and limit USD/JPY's decline. Today’s US ADP employment report and ISM Services data could provide the trigger for the next move in yields, or traders might hold their bets until Friday's NFP.
In Asia, Nikkei closed up 0.10%. Hong Kong HSI is down -0.17%. China Shanghai SSE is down -0.65%. Singapore Strait Times is up 0.62%. Japan 10-year JGB yield is down -0.0236 at 1.057. Overnight, DOW fell -0.17%. S&P 500 rose 0.05%. NASDAQ rose 0.40%. 10-year yield rose 0.027 to 4.223.
Fed officials signal neutral policy path but keep December decision open
Several Federal Reserve officials shared their views overnight but avoided giving specific guidance on what to expect at the December 18 FOMC rate decision. The tone of their remarks highlighted confidence in recent economic progress while maintaining a cautious stance on future rate adjustments.
Fed Governor Adriana Kugler characterized the US economy as being in a "good position" following significant strides toward maximum employment and price stability. She acknowledged that the labor market remains solid and inflation is steadily moving toward 2% target, albeit with "some bumps along the way."
Kugler emphasized that Fed is moving policy toward a "more neutral setting" while remaining vigilant for risks or supply shocks that could reverse progress.
San Francisco Fed President Mary Daly reiterated the importance of recalibrating policy but left the timing of adjustments undecided. "Whether it will be in December or sometime later, that's a question we'll have a chance to debate and discuss in our next meeting," she said.
Chicago Fed President Austan Goolsbee shared a more forward-looking perspective, suggesting that "over the next year it feels to me like rates come down a fair amount" from current levels. However, he acknowledged the importance of meeting regularly to reassess economic conditions as they evolve.
ECB’s Holzmann: Modest rate cut possible next week, not more
Austrian ECB Governing Council member Robert Holzmann indicated in an interview with Austria's Oberösterreichische Nachrichten newspaper that a rate cut at next week's meeting is possible, but ruled out a significant reduction.
He stated that while the likelihood of a reduction "isn't zero," the cut would be "moderate, not very strong," as current data do not strongly support such a move.
Holzmann mentioned that a 25bps cut is "conceivable," but emphasized "not more" than that. Though, no decision has been made and it will depend on the "final data we receive."
He acknowledged that inflation developments have been moving in the "right direction," but recent "deviations to the upside" have emerged.
Additionally, he expressed concern over a "row of challenges" facing the economy, highlighting that the geopolitical environment suggests price increases are "more likely than unlikely." Contributing factors include rising oil and energy prices and potential impacts from policies under President-elect Donald Trump.
Australia’s Q3 GDP expands 0.3% qoq, marking continued economic slowdown
Australia’s GDP grew by 0.3% qoq in Q3, falling short of expectations for a 0.5% qoq expansion, while annual growth reached 0.8% yoy. However, GDP per capita declined by -0.3% qoq, marking the seventh consecutive quarter of contraction.
Katherine Keenan, head of national accounts at the Australian Bureau of Statistics, remarked that “the Australian economy grew for the twelfth quarter in a row, but has continued to slow since September 2023.”
Public sector spending was the key driver of growth during the quarter, with government consumption and public investment making significant contributions.
Japan’s PMI services shows renewed growth, composite activity marginally improves
Japan’s services sector returned to growth in November, with PMI Services index finalized at 50.5, up from 49.7 in October. Composite PMI, which combines manufacturing and services activity, edged up to 50.1 from 49.6, signaling a modest overall improvement in private-sector activity.
Usamah Bhatti, Economist at S&P Global Market Intelligence, noted that the services sector experienced a "renewed upswing" as improved demand and stronger client confidence supported output and sustained new business growth. The sector’s near-term outlook appears favorable, with growth in outstanding business reaching its highest level in eight months, and optimism about the 12-month outlook remaining robust.
While the services sector drove the overall stabilization, the manufacturing sector continued to lag, with a slight contraction in production. Input cost pressures persisted across industries, contributing to higher prices for goods and services. However, businesses expressed optimism that inflationary and global uncertainties would subside, paving the way for a stronger rebound in Japan’s private sector.
China's Caixin PMI services falls to 51.5, manufacturing boosts composite index to 52.3
China’s Caixin PMI Services dropped to 51.5 in November from 52.0, missing market expectations of 52.5, reflecting a slowdown in the sector’s expansion. However, PMI Composite rose to 52.3 from 51.9, supported by improvements in manufacturing.
Wang Zhe, Senior Economist at Caixin Insight Group, highlighted the challenges facing the economy. He noted that while the downturn appears to be "bottoming out," the recovery requires "further consolidation." Persistent contraction in employment underscores that the impact of economic stimulus has yet to translate into labor market gains, with businesses hesitant to expand their workforce.
Wang also stressed the importance of monitoring the "consistency and effectiveness" of additional stimulus measures. The economy continues to face "structural and cyclical pressures," compounded by the risk of "continued accumulation of external uncertainties," necessitating "sufficient policy buffers."
Looking ahead
Eurozone PMI services final, PPI, and UK PMI services final will be released in European session. But the focuses will be on US ADP employment, and US ISM services featured later in the day. Fed will also publish Beige Book economic report.
EUR/AUD Daily Outlook
Daily Pivots: (S1) 1.6164; (P) 1.6208; (R1) 1.6247; More...
Immediate focus is now on 1.6359 resistance in EUR/AUD as rebound from 1.5963 resumes today. Firm break there will be the first sign of bullish trend reversal, after successfully defending 1.5996 key support level. Further rally should then be seen to 1.6598 resistance for confirmation. Nevertheless, break of 1.6156 support will turn bias back to the downside for 1.5996 again.
In the bigger picture, immediate focus is now on 1.5996 key support level. Sustained break there will argue that whole up trend from 1.4281 (2022 low) is already reversing. Deeper decline would be seen to 61.8% retracement of 1.4281 to 1.7180 at 1.5388, even as a correction. Nevertheless, strong rebound from current level, followed by break of 1.6359 resistance, will keep medium term outlook neutral at worst.
Australia’s Q3 GDP expands 0.3% qoq, marking continued economic slowdown
Australia’s GDP grew by 0.3% qoq in Q3, falling short of expectations for a 0.5% qoq expansion, while annual growth reached 0.8% yoy. However, GDP per capita declined by -0.3% qoq, marking the seventh consecutive quarter of contraction.
Katherine Keenan, head of national accounts at the Australian Bureau of Statistics, remarked that “the Australian economy grew for the twelfth quarter in a row, but has continued to slow since September 2023.”
Public sector spending was the key driver of growth during the quarter, with government consumption and public investment making significant contributions.
China’s Caixin PMI services falls to 51.5, manufacturing boosts composite index to 52.3
China’s Caixin PMI Services dropped to 51.5 in November from 52.0, missing market expectations of 52.5, reflecting a slowdown in the sector’s expansion. However, PMI Composite rose to 52.3 from 51.9, supported by improvements in manufacturing.
Wang Zhe, Senior Economist at Caixin Insight Group, highlighted the challenges facing the economy. He noted that while the downturn appears to be "bottoming out," the recovery requires "further consolidation." Persistent contraction in employment underscores that the impact of economic stimulus has yet to translate into labor market gains, with businesses hesitant to expand their workforce.
Wang also stressed the importance of monitoring the "consistency and effectiveness" of additional stimulus measures. The economy continues to face "structural and cyclical pressures," compounded by the risk of "continued accumulation of external uncertainties," necessitating "sufficient policy buffers."

Japan’s PMI services shows renewed growth, composite activity marginally improves
Japan’s services sector returned to growth in November, with PMI Services index finalized at 50.5, up from 49.7 in October. Composite PMI, which combines manufacturing and services activity, edged up to 50.1 from 49.6, signaling a modest overall improvement in private-sector activity.
Usamah Bhatti, Economist at S&P Global Market Intelligence, noted that the services sector experienced a "renewed upswing" as improved demand and stronger client confidence supported output and sustained new business growth. The sector’s near-term outlook appears favorable, with growth in outstanding business reaching its highest level in eight months, and optimism about the 12-month outlook remaining robust.
While the services sector drove the overall stabilization, the manufacturing sector continued to lag, with a slight contraction in production. Input cost pressures persisted across industries, contributing to higher prices for goods and services. However, businesses expressed optimism that inflationary and global uncertainties would subside, paving the way for a stronger rebound in Japan’s private sector.
ECB’s Holzmann: Modest rate cut possible next week, not more
Austrian ECB Governing Council member Robert Holzmann indicated in an interview with Austria's Oberösterreichische Nachrichten newspaper that a rate cut at next week's meeting is possible, but ruled out a significant reduction.
He stated that while the likelihood of a reduction "isn't zero," the cut would be "moderate, not very strong," as current data do not strongly support such a move.
Holzmann mentioned that a 25bps cut is "conceivable," but emphasized "not more" than that. Though, no decision has been made and it will depend on the "final data we receive."
He acknowledged that inflation developments have been moving in the "right direction," but recent "deviations to the upside" have emerged.
Additionally, he expressed concern over a "row of challenges" facing the economy, highlighting that the geopolitical environment suggests price increases are "more likely than unlikely." Contributing factors include rising oil and energy prices and potential impacts from policies under President-elect Donald Trump.