Sample Category Title
EUR/AUD Daily Outlook
Daily Pivots: (S1) 1.4186; (P) 1.4248; (R1) 1.4323; More...
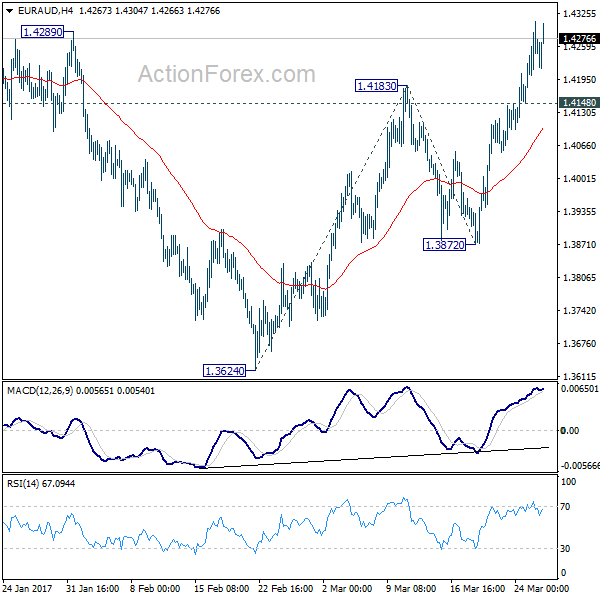
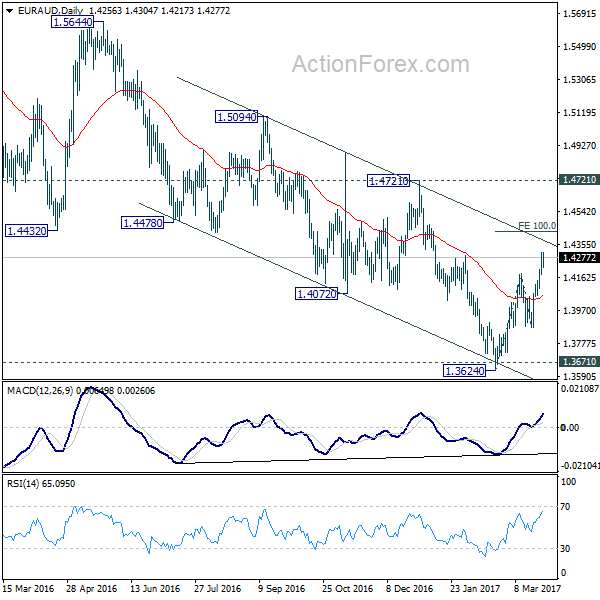
Intraday bias in EUR/AUD remains on the upside for the moment. Current rise from 1.3624 should target 100% projection of 1.3624 to 1.4183 from 1.3872 at 1.4431 next. Decisive break there will indicate upside acceleration and target 1.4721 key resistance. On the downside, below 1.4148 minor support will turn bias neutral and bring consolidations first before staging another rally.
In the bigger picture, price actions from 1.6587 medium term top are viewed as a corrective pattern. Such correction could be completed after testing 1.3671 support. Break of 1.4721 cluster resistance (38.2% retracement of 1.6587 to 1.3624 at 1.4756) should confirm this case and target 61.8% retracement at 1.5455 and above. Overall, we'd expect the up trend from 1.1602 to resume later. However, sustained break of 1.3671 will invalidate our bullish view and would turn focus back to 1.1602 long term bottom.
EUR/GBP Daily Outlook
Daily Pivots: (S1) 0.8624; (P) 0.8649; (R1) 0.8674; More...
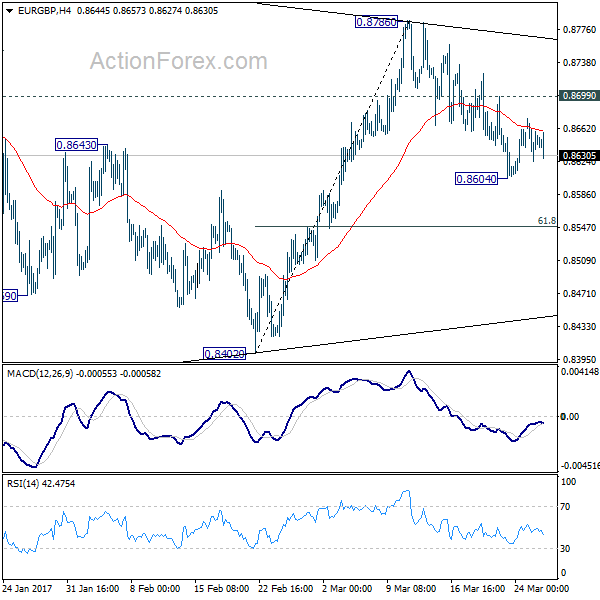
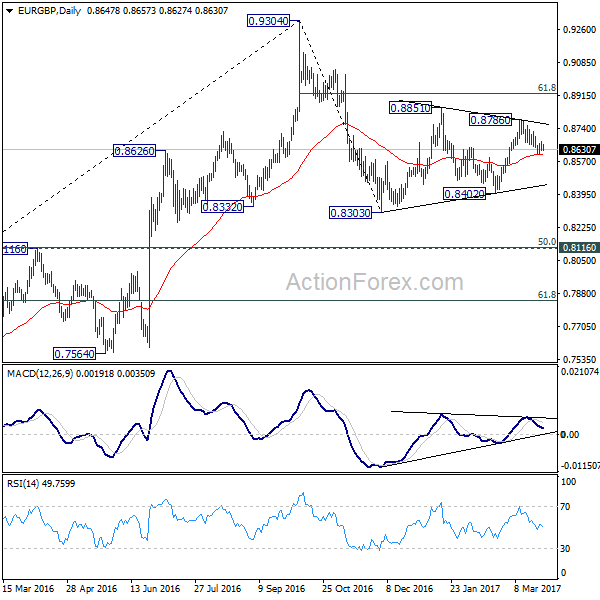
Intraday bias in EUR/GBP remains neutral for the moment. With 0.8699 minor resistance intact, deeper decline is mildly in favor. Below 0.8604 will target 61.8% of 0.8402 to 0.8786 at 0.8549 and possibly below. In that case, we'll look for support above to 0.8402 to bring another rebound before completing that correction from 0.8303. On the upside, above 0.8699 will turn bias back to the upside for 0.8786. Break will target 61.8% retracement of 0.9304 to 0.8303 at 0.8922 to finish the pattern from 0.8303. Overall, price actions from 0.8303 are forming a corrective pattern, as the second leg of the correction from 0.9304.
In the bigger picture, price actions from 0.9304 are viewed as a medium term corrective pattern. Deeper fall cannot be ruled out yet. But we'd expect strong support from 0.8116 cluster support (50% retracement of 0.6935 to 0.9304 at 0.8120) to contain downside. Overall, the corrective pattern would take some time to complete before long term up trend resumes at a later stage. Break of 0.9304 will pave the way to 0.9799 (2008 high).
EUR/CHF Daily Outlook
Daily Pivots: (S1) 1.0691; (P) 1.0705; (R1) 1.0720; More...
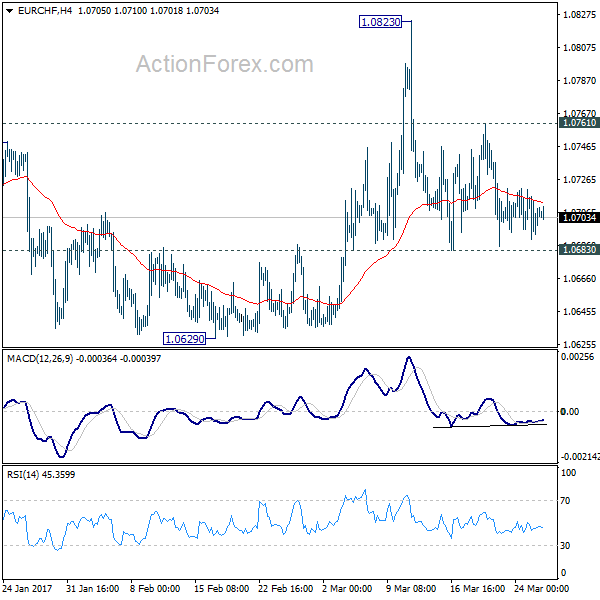
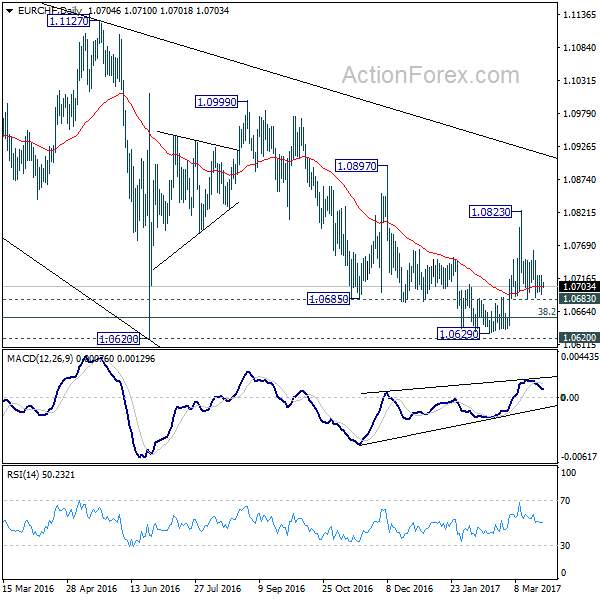
EUR/CHF is staying in range of 1.0683/0761 and intraday bias remains neutral. We'd slightly favoring the case of trend reversal on bullish convergence condition in daily MACD. And, further rise is mildly in favor as long as 1.0683 minor support holds. Above 1.0761 minor resistance will turn bias to the upside for 1.0823 resistance first. Break will re-affirm the case of trend reversal and target 1.0897 resistance next. However, firm break of 1.0683 minor support will turn bias to the downside for 1.0620 key support level again.
In the bigger picture, the decline from 1.1198 is seen as a corrective move. Decisive break of 1.0897 resistance should confirm that it's completed. And in that case, larger up trend is resuming for another high above 1.1198. Meanwhile, sustained trading below 38.2% retracement of 0.9771 to 1.1198 at 1.0653 will target 50% retracement at 1.0485.
Trade Idea : GBP/USD – Buy at 1.2490
GBP/USD - 1.2573
Most recent candlesticks pattern : N/A
Trend : Near term up
Tenkan-Sen level : 1.2563
Kijun-Sen level : 1.2572
Ichimoku cloud top : 1.2506
Ichimoku cloud bottom : 1.2499
Original strategy :
Buy at 1.2490, Target: 1.2600, Stop: 1.2455
Position : -
Target : -
Stop : -
New strategy :
Buy at 1.2490, Target: 1.2600, Stop: 1.2455
Position : -
Target : -
Stop : -
Cable’s retreat after rising to 1.2616 yesterday suggests consolidation below this level would be seen and below 1.2530 would bring retracement to 1.2490-00, however, price should stay well above support at 1.2469, bring another upomve later, above said resistance at 1.2616 would extend recent rise from 1.2109 to 1.2635-40, however, loss of upward momentum should prevent sharp move beyond 1.2670-80 and price should falter below previous resistance at 1.2706, risk from there is seen for a retreat later.
In view of this, would not chase this rise here and would be prudent to buy cable on subsequent retreat. Only below support at 1.2469 (Friday’s low) would abort and signal top is formed, bring retracement of recent upmove towards previous support at 1.2424 which is likely to hold from here.

USD/CAD Daily Outlook
Daily Pivots: (S1) 1.3330; (P) 1.3366; (R1) 1.3413; More....
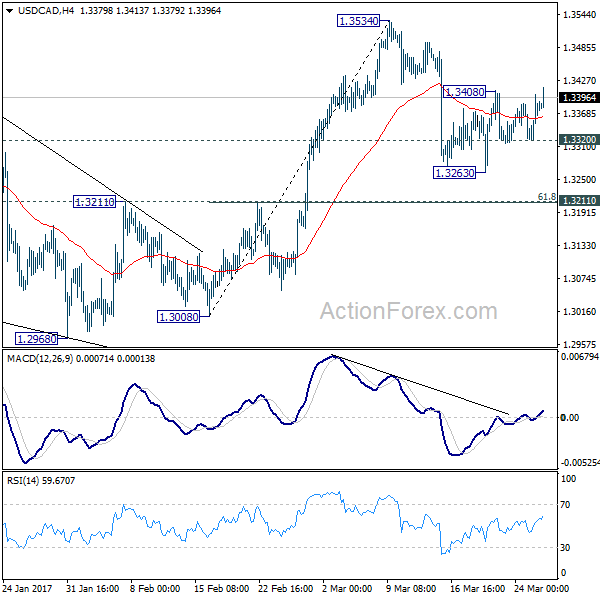
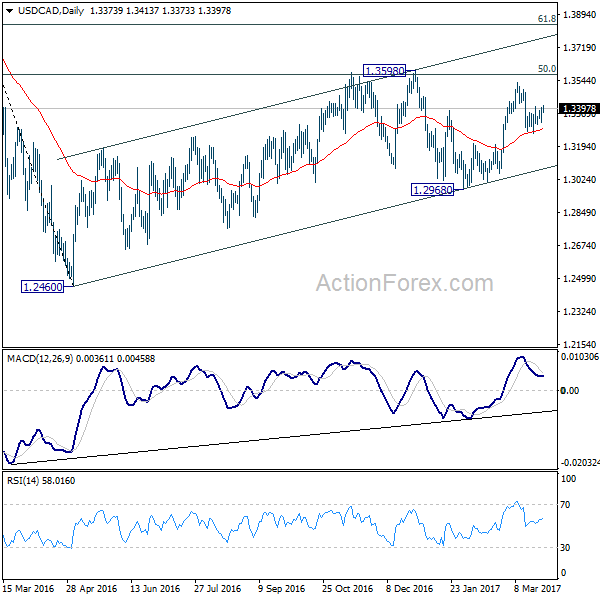
The breach of 1.3408 minor resistance suggests that rebound from 1.3263 is resuming. Intraday bias in USD/CAD is back on the upside for 1.3534 resistance. Break will target 1.3598 key resistance next. On the downside, below 1.3320 minor support will turn bias to the downside to extend the fall from 1.3534. But we'd expect strong support from 1.3211 cluster level (61.8% retracement of 1.3008 to 1.3534 at 1.3209) to contain downside and bring rebound. Overall, rise from 1.2968 is expected to resume later to extend through the whole medium term rise from 1.2460 through 1.3598.
In the bigger picture, price actions from 1.4689 medium term top are seen as a correction pattern. The first leg has completed at 1.2460. The second leg is likely still in progress and could target 61.8% retracement of 1.4689 to 1.2460 at 1.3838. We'd look for reversal signal there to start the third leg. Break of 1.2968 wold at least bring at retest of 1.2460 low. However, sustained trading above 1.3838 would pave the way to retest 1.4689 high.
Trade Idea : EUR/USD – Buy at 1.0800
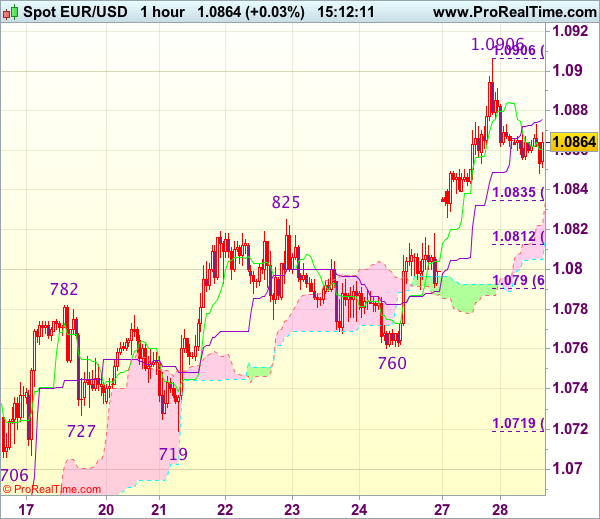
EUR/USD - 1.0860
Most recent candlesticks pattern : N/A
Trend : Near term up
Tenkan-Sen level : 1.0861
Kijun-Sen level : 1.0876
Ichimoku cloud top : 1.0822
Ichimoku cloud bottom : 1.0805
Original strategy :
Buy at 1.0800, Target: 1.0900, Stop: 1.0765
Position : -
Target : -
Stop : -
New strategy :
Buy at 1.0800, Target: 1.0900, Stop: 1.0765
Position : -
Target : -
Stop : -
As the single currency has retreated after surging to 1.0906 yesterday, suggesting consolidation below this level would be seen and pullback to 1.0835 (38.2% Fibonacci retracement of 1.0719-1.0906) is likely, however, reckon downside would be limited to 1.0810-15 (50% Fibonacci retracement), bring another rise later, above said resistance at 1.0906 would extend recent upmove to 1.0930-35 (61.8% Fibonacci retracement of 1.1300-1.0340) but loss of near term upward momentum should prevent sharp move beyond 1.0955-60 and price should falter below 1.0990-00.
In view of this, would not chase this rise here and we are looking to buy euro on subsequent pullback as 1.0800-10 should limit downside. Only below support at 1.0760 would abort and signal top is formed, bring retracement of recent upmove to 1.0730 but 1.0719 support should remain intact.
AUD/USD Daily Outlook
Daily Pivots: (S1) 0.7600; (P) 0.7624; (R1) 0.7640; More...
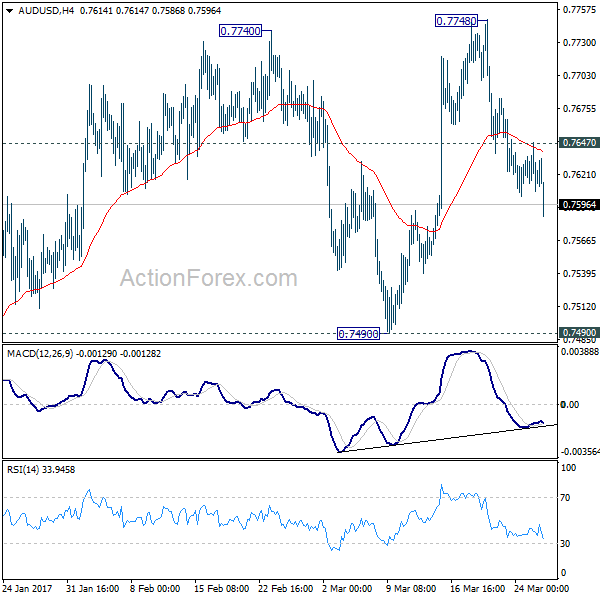
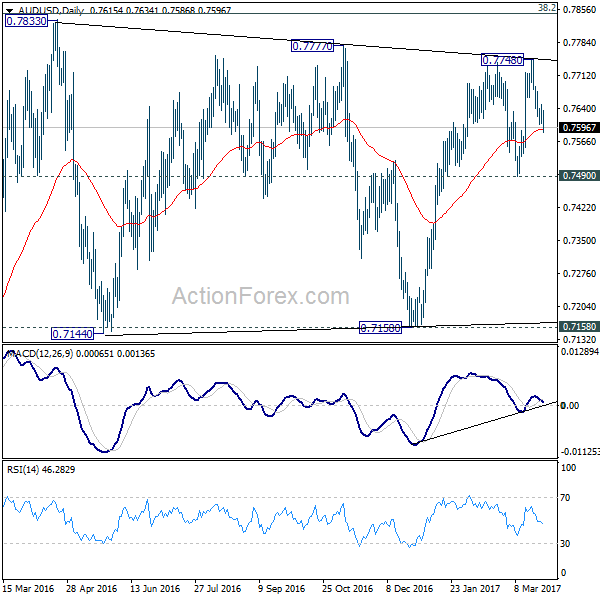
AUD/USD's fall from 0.7748 continues today and intraday bias remains on the downside for 0.7490 support. Firm break there will confirm completion of rise from 0.7158. In such case, near term outlook will be turned bearish for 0.7158 support next. On the upside, though, above 0.7647 minor resistance will turn bias back to the upside for 0.7748 and above. At this point, we'd continue to expect strong resistance from long term retracement level at 0.7849 to limit upside.
In the bigger picture, we're still treating price actions from 0.6826 low as a correction. And, as long as 38.2% retracement of 0.9504 to 0.6826 at 0.7849 holds, long term down trend from 1.1079 is expected to resume sooner or later. Break of 0.6826 low will target 0.6008 key support level. However, firm break of 0.7849 will indicate that rise from 0.6826 is developing into a medium term rebound, rather than a sideway pattern. In such case, stronger rise should be seen to 55 month EMA (now at 0.8169) and above.
USD/JPY Daily Outlook
Daily Pivots: (S1) 110.16; (P) 110.60; (R1) 111.10; More...
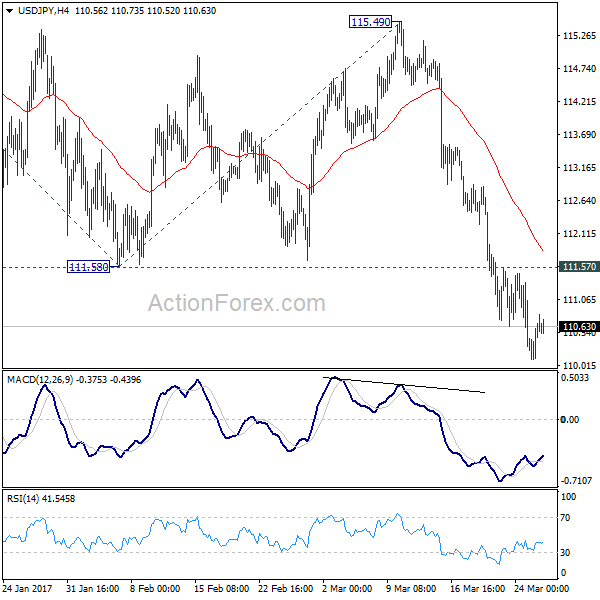
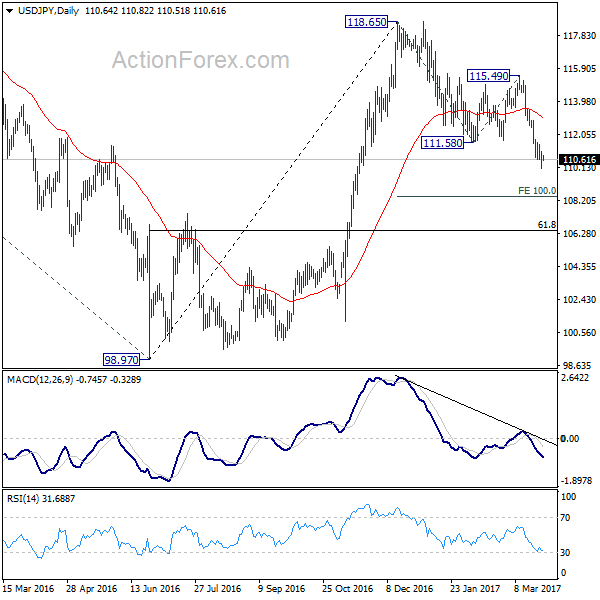
With 111.57 minor resistance intact, deeper decline is still expected in USD/JPY. Current fall from 118.65 should target 100% projection of 118.65 to 111.58 from 115.49 at 108.42 and possibly below. On the upside, break of 111.57 resistance is needed to indicate short term bottoming. Otherwise, near term outlook stays mildly bearish in case of recovery.
In the bigger picture, price actions from 125.85 high are seen as a corrective pattern. sustained trading below 55 week EMA (now at 111.11) will indicates that such consolidation is not completed. And another fall would be seen back to 98.97 as the third leg. In that case, downside would be contained by 61.8% retracement of 75.56 to 125.95 at 94.77 to complete the correction. On the upside, above 115.49 will extend the rise from 98.97 to retest 125.85 first. Overall, up trend from 75.56 is expected to resume after the consolidation from 125.85 completes.
USD/CHF Daily Outlook
Daily Pivots: (S1) 0.9812; (P) 0.9854; (R1) 0.9894; More.....
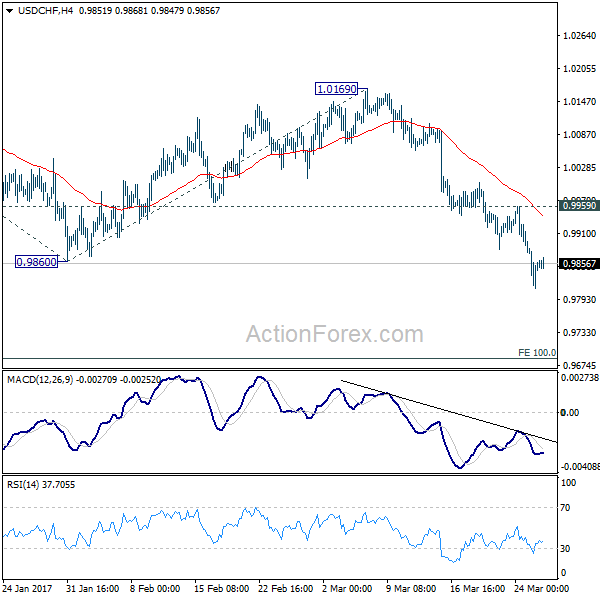
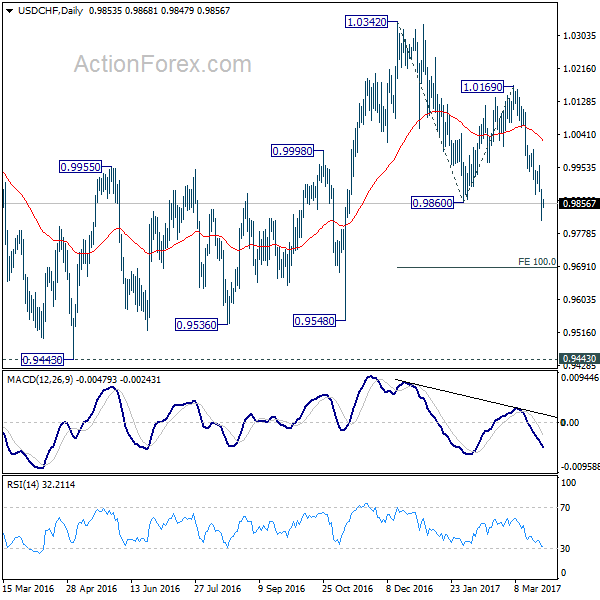
Intraday bias in USD/CHF remains on the downside for the moment. Current fall from 1.0342 should extend to 100% projection of 1.0342 to 0.9860 from 1.0169 at 0.9687 and possibly below. On the upside, break of 0.9959 resistance is needed to indicate short term bottoming. Otherwise, outlook will stay bearish in case of recovery.
In the bigger picture, USD/CHF is staying in medium term sideway pattern between 0.9443/1.0342. In any case, decisive break of 1.0342 resistance is needed to confirm underlying strength. Otherwise, we'll stay neutral in the pair first. In case of deeper fall, we'd expect strong support from 0.9443/9548 support zone.
Trade Idea : USD/JPY – Sell at 111.20
USD/JPY - 110.54
Most recent candlesticks pattern : N/A
Trend : Down
Tenkan-Sen level : 110.68
Kijun-Sen level : 110.47
Ichimoku cloud top : 110.86
Ichimoku cloud bottom : 110.73
Original strategy :
Sell at 111.00, Target: 110.00, Stop: 111.35
Position : -
Target : -
Stop : -
New strategy :
Sell at 111.20, Target: 110.20, Stop: 111.55
Position : -
Target : -
Stop : -
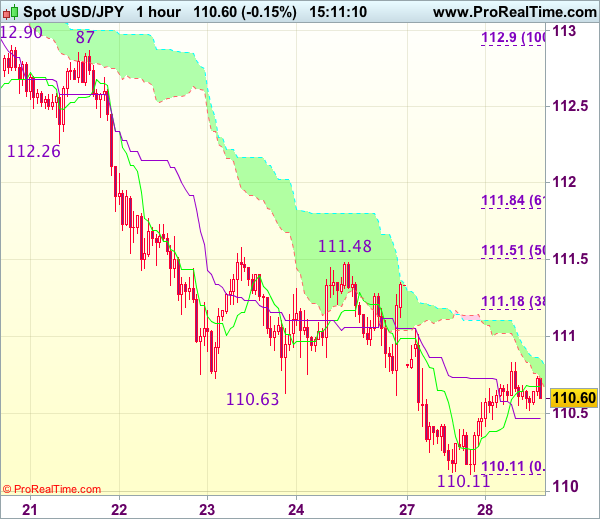
The greenback recovered after falling to 110.11 and consolidation above this level would be seen and corrective bounce to 110.95-00 cannot be ruled out, however, reckon upside would be limited to 111.15-20 (38.2% Fibonacci retracement of 112.90-110.11) and price should falter well below resistance at 111.48, bring another decline later, below said support at 110.11 would signal recent decline is still in progress and may extend weakness to 109.95-00 but loss of downward momentum should prevent sharp fall below 109.70-75 and reckon 109.50 would hold.
In view of this, would not chase this fall here and would be prudent to sell dollar on recovery as 111.15-20 should limit upside. Above 111.48-51 (previous resistance and 50% Fibonacci retracement of 112.90-110.11) would abort and signal low is formed, bring a stronger rebound to 111.80-85 first (61.8% Fibonacci retracement).