Sample Category Title
AUD/USD Daily Report
Daily Pivots: (S1) 0.6441; (P) 0.6478; (R1) 0.6514; More...
AUD/USD is staying in range above 0.6433 despite this week's dip. Intraday bias remains neutral first, and further decline is expected with 0.6549 resistance intact. On the downside, break of 0.6433 will resume whole decline from 0.6941, and target 0.6348 support next. However, firm break of 0.6549 will indicate short term bottoming, and bring stronger rebound to 55 D EMA (now at 0.6596).

In the bigger picture, rise from 0.6269 (2023 low) should have completed with three waves up to 0.6941. Corrective pattern from 0.6169 (2022 low) is now extending with another falling leg. Deeper decline would be seen back to 0.6269 as sideway trading extends.

Greenback Holds Firm in Subdued Trading Despite Growing Expectations of December Fed Cut
Trading in the forex markets were subdued in the Asian session. Low activity is expected to persist for the rest of the day due to a light economic calendar. Dollar remains resilient, supported by expectations that the incoming US administration will favor a strong currency. While the sharp drop in US Treasury yields has put some pressure on USD/JPY, the greenback has held its ground against Euro and other currencies.
FOMC rate cut speculation has gained momentum following comments from Fed Governor Christopher Waller, who signaled preference to a December easing. Fed funds futures now indicate a 75% probability of a 25bps rate cut at the meeting, up from 66% yesterday and 59% a week ago. However, traders remain cautious as this week’s critical data, especially Friday’s non-farm payroll report, could shift market expectations dramatically.
Overall for the week so far, Euro continues to face headwinds, ranking as the weakest major as weighed down by political instability in France. Swiss Franc and British Pound are the next weakest performers, highlighting overall softness among European currencies. Conversely, Dollar leads the pack, edging out Yen for the top spot, with the Canadian Dollar rounding out the top three. Australian and New Zealand Dollars are trading in middle positions.
Technically, US 10-year yield is now sitting in an important near term support zone between 55 D EMA (now at 4.196) and 38.2% retracement of 3.603 to 4.505 at 4.160. Strong rebound from current level will keep price actions from 4.505 corrective, and keep the rise from 3.603 alive. However, firm break there will confirm near term reversal and bring deeper fall to 61.8% retracement at 3.947.
Should this scenario unfold, it could exert additional downward pressure on USD/JPY. Nevertheless, given Dollar's relative resilience against other currencies, a more compelling short opportunity might emerge in EUR/JPY. The cross could be poised for further declines, possibly retesting the recent low at 154.40, especially if European currencies continue to weaken amid ongoing political uncertainties.
.
In Asia, at the time of writing, Nikkei is up 1.90%. Hong Kong HSI is up 0.66%. China Shanghai SSE is up 0.40%. Singapore Strait Times is up 1.17%. Japan 10-year JGB yield is up 0.0057 at 1.083. Overnight, DOW fell -0.29%. S&P 500 rose 0.24%. NASDAQ rose 0.97%. 10-year yield rose 0.018 to 4.196.
Fed’s Waller favors Dec rate cut, confident inflation in choke hole will tap out
Fed Governor Christopher Waller expressed tentative support for a rate cut at the December FOMC meeting, contingent on upcoming data aligning with expectations for inflation to decline toward the 2% target over the medium term.
While stating that he currently "leans toward supporting a cut," Waller emphasized that any unexpected data could alter his forecast and influence his decision.
Waller used a vivid analogy, comparing his efforts to combat inflation to an "MMA fighter" with inflation in a "choke hold". While it keeps "slipping away" at the last minute, he assured that "submission is inevitable" and that inflation isn't escaping the "octagon."
Despite slower progress on taming inflation, he highlighted broader economic stability as a factor supporting further monetary easing. Waller argued that, even after a cumulative 75 basis points in cuts, policy would remain restrictive, with additional easing simply reducing the intensity of Fed’s brake on economic activity.
Fed’s Bostic: Labor market cooling in an orderly fashion as inflation progress on track
In an essay, Atlanta Fed President Raphael Bostic expressed cautious optimism about the US economy, highlighting that the labor market is cooling in a "largely orderly fashion" despite higher interest rates. "This is welcome news," Bostic noted, echoing perspectives from business contacts.
Besides, he noted that while there are still upside risks to price stability, the "totality of the data" suggests that progress toward 2% inflation target remains "on track".
Bostic assessed the broader economy as being "on solid footing," with the labor market stable near maximum employment and price stability within reach. However, he warned against complacency, noting that the monetary policy outlook is not predetermined.
"In making judgments about what this path should look like, my strategy will be to look to the incoming data," he said, emphasizing a need for vigilance as policymakers address remaining challenges.
Fed’s Williams: Moving toward neutral policy, timing hinges on data
New York Fed President John Williams said in a speech yesterday that monetary policy will need to "move to a more neutral policy setting over time."
However, he refrained from offering firm guidance on the timing of rate cuts, including whether a December adjustment might be appropriate.
Williams highlighted the uncertainty inherent in economic forecasting, noting that "the path for policy will depend on the data."
Despite the ambiguity, Williams painted a relatively optimistic picture of the US economy, describing it as in a "good place" with a "strong" labor market.
He projected economic growth of 2.5% or more for the year, with unemployment expected to stabilize between 4% and 4.25% in the coming months. Inflation is anticipated to end the year at 2.25%, with no significant upward pressure from the labor market.
Looking ahead
The economic calendar is light today with Swiss CPI and US JOLTS job openings the only features. Nevertheless, some Fed officials are scheduled to speak, which could drop some hints on their preferences at the upcoming FOMC meeting.
AUD/USD Daily Report
Daily Pivots: (S1) 0.6441; (P) 0.6478; (R1) 0.6514; More...
AUD/USD is staying in range above 0.6433 despite this week's dip. Intraday bias remains neutral first, and further decline is expected with 0.6549 resistance intact. On the downside, break of 0.6433 will resume whole decline from 0.6941, and target 0.6348 support next. However, firm break of 0.6549 will indicate short term bottoming, and bring stronger rebound to 55 D EMA (now at 0.6596).
In the bigger picture, rise from 0.6269 (2023 low) should have completed with three waves up to 0.6941. Corrective pattern from 0.6169 (2022 low) is now extending with another falling leg. Deeper decline would be seen back to 0.6269 as sideway trading extends.
Fed’s Williams: Moving toward neutral policy, timing hinges on data
New York Fed President John Williams said in a speech yesterday that monetary policy will need to "move to a more neutral policy setting over time."
However, he refrained from offering firm guidance on the timing of rate cuts, including whether a December adjustment might be appropriate.
Williams highlighted the uncertainty inherent in economic forecasting, noting that "the path for policy will depend on the data."
Despite the ambiguity, Williams painted a relatively optimistic picture of the US economy, describing it as in a "good place" with a "strong" labor market.
He projected economic growth of 2.5% or more for the year, with unemployment expected to stabilize between 4% and 4.25% in the coming months. Inflation is anticipated to end the year at 2.25%, with no significant upward pressure from the labor market.
Fed’s Waller favors Dec rate cut, confident inflation in choke hole will tap out
Fed Governor Christopher Waller expressed tentative support for a rate cut at the December FOMC meeting, contingent on upcoming data aligning with expectations for inflation to decline toward the 2% target over the medium term.
While stating that he currently "leans toward supporting a cut," Waller emphasized that any unexpected data could alter his forecast and influence his decision.
Waller used a vivid analogy, comparing his efforts to combat inflation to an "MMA fighter" with inflation in a "choke hold". While it keeps "slipping away" at the last minute, he assured that "submission is inevitable" and that inflation isn't escaping the "octagon."
Despite slower progress on taming inflation, he highlighted broader economic stability as a factor supporting further monetary easing. Waller argued that, even after a cumulative 75 basis points in cuts, policy would remain restrictive, with additional easing simply reducing the intensity of Fed’s brake on economic activity.
Elliott Wave View S&P 500 (SPX) Wave 5 in Progress
Short Term Elliott Wave view on SP500 (SPX) suggests rally from 8.5.2024 low is in progress as a 5 waves impulse. Up from 8.5.2024 low, wave 1 ended at 5627.56 high and pullback in wave 2 ended at 5402.62 low. The Index then extends higher in wave 3 ending at 5878.46 high. The next pullback built a zigzag Elliott Wave structure to finish wave 4 at 5696.51 low like the 1 hour chart below shows. Actually, the SPX is trading higher in wave 5 developing an impulse or ending diagonal structure.
Wave 5 rally is in progress with internal subdivision as another impulse. Up from wave 4, wave ((i)) ended at 6017.31 high and wave ((ii)) retracement ended at 5853.01 low. Wave ((iii)) has started and it is trading in wave v of (iii) of ((iii)). Up from wave ((ii)), wave (i) ended at 5908.12 and wave (ii) correction ended at 5855.29. Then the SPX built a nest ending wave i at 5923.51 and wave ii at 5860.56. Wave iii of (iii) finished at 6025.42 and wave iv pullback at 5984.87 low. From here, we are expecting that wave v of (iii) completes soon and the index should see a pullback in 3 swings as wave (iv) before resuming higher in wave (v) of ((iii)). Near term, as far as pivot at 5850.8 low stays intact, expect pullback to find support in 3, 7, or 11 swing for more upside
SP500 (SPX) 60 Minutes Elliott Wave Chart

SPX Elliott Wave Video
https://www.youtube.com/watch?v=cftR2W1H_UM
Fed’s Bostic: Labor market cooling in an orderly fashion as inflation progress on track
In an essay, Atlanta Fed President Raphael Bostic expressed cautious optimism about the US economy, highlighting that the labor market is cooling in a "largely orderly fashion" despite higher interest rates. "This is welcome news," Bostic noted, echoing perspectives from business contacts.
Besides, he noted that while there are still upside risks to price stability, the "totality of the data" suggests that progress toward 2% inflation target remains "on track".
Bostic assessed the broader economy as being "on solid footing," with the labor market stable near maximum employment and price stability within reach. However, he warned against complacency, noting that the monetary policy outlook is not predetermined.
"In making judgments about what this path should look like, my strategy will be to look to the incoming data," he said, emphasizing a need for vigilance as policymakers address remaining challenges.
WTI Near Key Levels: Trading Setups Ahead of OPEC+ Meeting
Fundamental Analysis
WTI crude oil prices have started to recover, trading at $68.90 amidst rising tensions ahead of the key OPEC+ meeting on Thursday. A critical article by a senior Iranian official has highlighted that the group’s production cut policies have kept prices elevated for too long, incentivizing cheaper oil production outside the cartel, particularly in the U.S. This debate could stir internal frictions within OPEC+ and increase uncertainty regarding policy decisions for 2025.
Additionally, the strengthening U.S. Dollar Index (DXY), driven by Trump’s threats against BRICS and the political turmoil in France, adds bearish pressure on crude, as a stronger dollar typically makes commodities more expensive. While the partial shutdown of the Druzhba pipeline in Poland could temporarily support prices, the short-term outlook will depend on whether OPEC+ manages to send clear signals about supply adjustments to stabilize prices in an increasingly competitive global market.
Technical Analysis
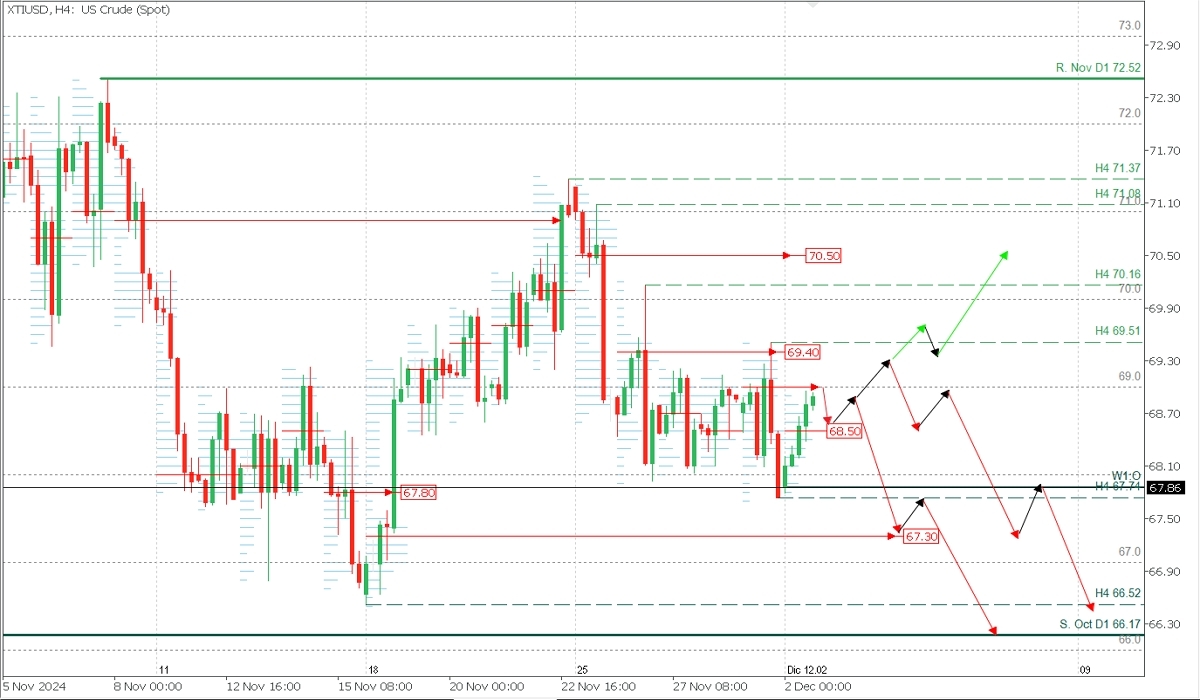
XTIUSD, H2
Supply Zones (Sell Levels): 69.00 and 69.40
Demand Zones (Buy Levels): 68.50, 67.30
Crude oil remains under bearish pressure, hitting the sell targets outlined in the previous analysis here.
The current support sits at 67.74, confirming 69.51 as the most recent validated resistance. This implies that the bearish trend will persist as long as the price remains below this level.
At the time of this analysis, the day's bullish opening drove the price toward Friday’s POC at 69.00, identified as the latest supply zone. New short positions are expected below this zone, targeting Friday's support at 67.74 and the next demand zone around 67.30 intraday.
If a bounce occurs, followed by a break of the indicated demand zone, the price will aim for October's support at 66.17 and the psychological level of 66.00. This scenario will hold unless news emerges concerning risks to crude transportation.
Technical Summary
Bearish Scenario:
- Sell Below 69.00
-
- Take Profits (TP): 68.50, 68.00, 67.74, 67.30 (intraday), and 67.00, 66.52, 66.17, 66.00 (throughout the week).
- As long as the price does not break above the latest validated resistance, currently at 69.51, which will shift lower as the price declines.
Bullish Scenario:
- Buy Above 69.51
- Take Profits (TP): 70.00 and 70.50 (extension).
- Use a stop-loss (SL) of 1% of your capital with a small lot size to allow for market fluctuations.
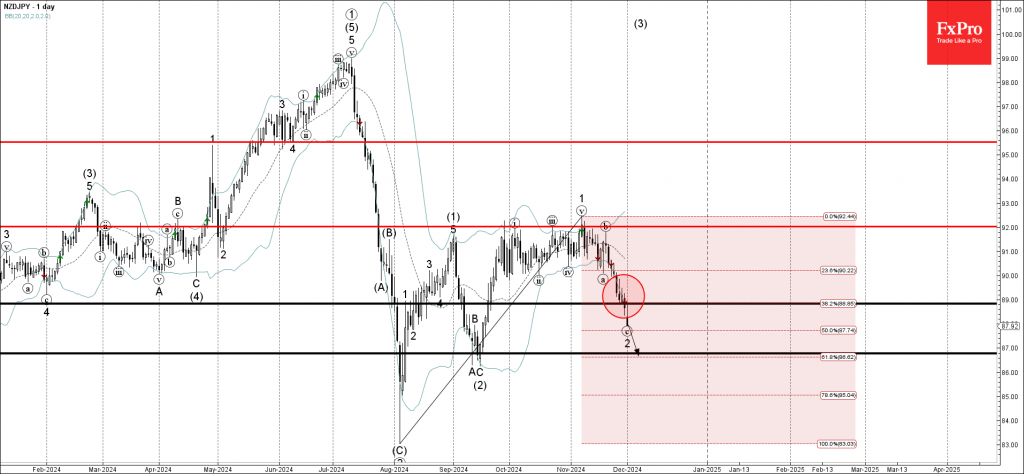
NZDJPY Wave Analysis
- NZDJPY broke support zone
- Likely to fall to support level 86.75
NZDJPY currency pair recently broke the support zone located between the support level 89.00 and the 38.2% Fibonacci correction of the upward price move from the start of August.
The breakout of this support zone accelerated the active c-wave of the ABC correction 2 from the start of November.
Given the strongly bullish yen sentiment seen today, NZDJPY currency pair can be expected to fall to the next support level 86.75 (former support from September and the target price for the completion of the active ABC correction 2).
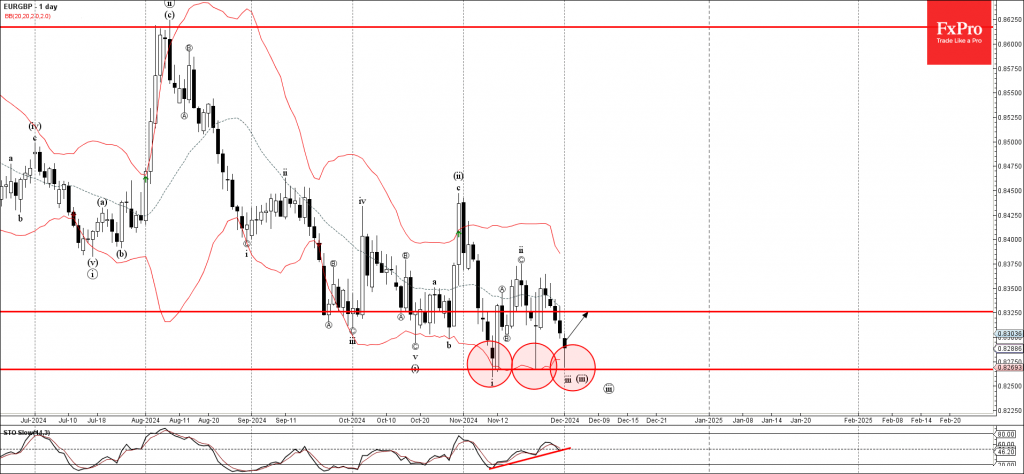
EURGBP Wave Analysis
- EURGBP reversed from support zone
- Likely to rise to resistance level 0.8325
EURGBP currency pair today reversed up from the support zone located between the strong support level 0.8265 (which has been revering the pair from the start of November) and the lower daily Bollinger Band.
The upward reversal from this support zone stopped the earlier impulse waves iii and (iii) –which belong to the downward impulse sequence 1 from August.
Given the strength of the support level 0.8265 and the triple bullish divergence on the daily Stochastic indicator, EURGBP currency pair can be expected to rise to the next resistance level 0.8325.