
Sample Category Title
EUR to Focus on French Presidential Debate
Monday March 20: Five things the markets are talking about
Market volatility remains low across markets from equities to currencies and fixed-income as dealers and investors attempt to evaluate how sustainable the hopeful global economic recovery is.
Investor focus turns away from last week's central bank statements to U.S policy or Trumponomics. The White House is heading for a busy week, with anticipated House health care legislation coming to the floor and the Senate starting hearings on a Supreme Court nominee (Gorsuch).
Currently, the 'mighty' U.S. dollar is heading for its longest losing streak since last Novembers U.S Presidential election, while most major equity indexes falter near their all-time high, while treasury yields trade atop of the recent lows.
On the weekend, the G20 official communiqué upheld their commitment against competitive "devaluation," but also omitted language on promoting free trade (see below).
On the data front, investors this week will be kept busy by Euro and Japanese flash PMI's. In the U.K, price data and retail sales will be released for February. Minutes of the BoJ's January meeting and the RBA's March meeting will be published, while the RBNZ will announce its monetary policy decision.
1. Global stocks see mixed results
Last week was the best week since January for global equities.
However overnight, it was a mixed performance. Equities have retreated in Europe, Australia and New Zealand. Japan's stock market was closed for a holiday, while indexes rose in emerging markets.
The MSCI's broadest index of Asia-Pacific shares ex-Japan added +0.3%. In Hong Kong, the Hang Seng climbed +0.7%, while Chinese shares were mixed with the CSI 300 down -0.1%, while the Shanghai Composite added +0.1%. Down-under, Aussie shares closed down -0.36%.
Elsewhere, the MSCI's emerging markets index added +0.4% to hit its highest level in more than two-years.
In Europe, equity indices are trading lower as market participants digest the weekends G20 communiqué. Banking stocks are putting pressure on the Eurostoxx while energy; commodity and mining stocks trade lower in the FTSE 100.
U.S stocks are set to open in the red (-0.2%).
Indices: Stoxx50 -0.2% at 3,436, FTSE -0.2% at 7,411, DAX -0.3% at 12,055, CAC-40 -0.4% at 5,011, IBEX-35 -0.3% at 10,215, FTSE MIB -0.3% at 20,016, SMI flat at 8,698, S&P 500 Futures -0.2%
2. Higher U.S oil production offsetting OPEC's supply cuts
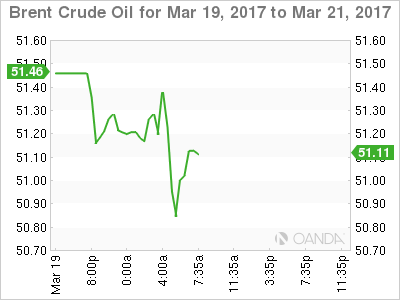
Crude oil prices start the week on the back foot, pressured by rising U.S drilling activity and steady supplies from OPEC countries despite last November's agreement of production cuts.
Ahead of the U.S open, Brent crude futures are down -34c, or -0.66%, at +$51.42 per barrel. U.S West Texas Intermediate (WTI or light crude) has slipped -48c, or -0.98%, to +$48.30 a barrel.
Friday's date from Baker Hughes showed that U.S drillers added +14 oil rigs in the week to March 17, bringing the total count up to +631, the most in 18-months, extending a recovery that is expected to boost U.S shale production by the most in six-months in April.
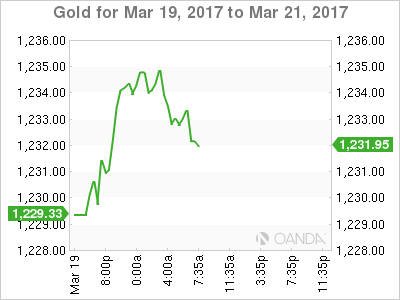
Gold prices have edged up (up +0.2% to +$1,231.05 per ounce) as the 'mighty' dollar stays on the defensive after last week's "less hawkish" tone from the Fed, despite the rate hike. Yellen's cautious guidance has the market pricing in almost no chance of another rate rise in May, but rises to 50-50 for June.
Note: Markets are bracing for a packed week of Fed messaging - this week there are nine different U.S policy makers set to speak, including Chair Janet Yellen on Thursday.
3. U.S Treasury yields lower, ECB futures tightening
Currently, to many the possibility of the ECB raising interest rates before its QE program ends is a "tail risk." However, its not stopping the market from pricing in the possibility of incremental "small" hikes.
Looking at the Euro curve, FI dealers are pricing in some tightening pressures to the ECB's deposit rate (-0.4%) over the next 18-months. Dealers see a +10 bps rise by January 2018, a +15 bps rise by May 18 and a +20 bps rise by August 2018. To many, this would still be considered a "dovish" hike.
Elsewhere, U.S 10-year Treasuries are little changed at +2.50% after falling -4 bps on Friday. The yield on Aussie 10's have dropped -3 bps to +2.82%.
4. EUR to focus on French Presidential Debate
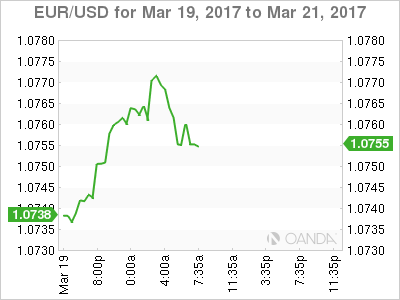
The EUR and GBP have both benefitted from a weaker dollar after the G-20 statement dropped a pledge to promote free trade, reviving concerns about U.S. policy causing disruption to trade. The dollar is also continuing its weakness from a "less hawkish" message from the Fed.
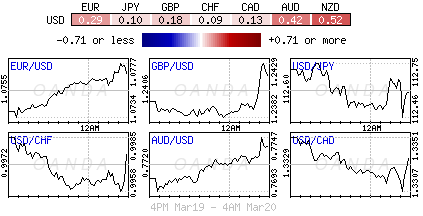
EUR/USD is up +0.2% at €1.0767, while GBP/USD has rallied to a three-week high £1.2436. USD/JPY has dropped to trade atop a three-week low around ¥112.47.
Note: EUR's gains may be limited as market focus shifts to today's French Presidential TV debate. Any narrowing of centrist candidate Macron's lead after the debate could indeed instigate fresh EUR selling.
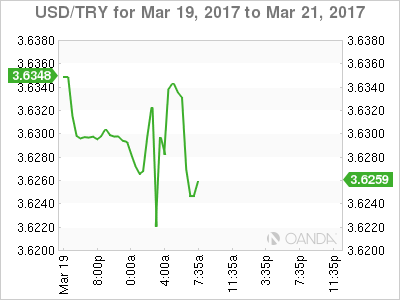
Elsewhere, the KRW (+1.1% to $1,116) trades at a five month high outright amid continued appetite for the currency as the political picture becomes somewhat clearer. TRY ($3.6338) is recovering some of the falls prompted by Moody's downgrading Turkey's sovereign rating outlook to negative from stable late Friday.
5. G20's communiqué
The weekends post-meeting communiqué retained language on avoiding currency manipulation - previously aimed chiefly at Japan and China - but it omitted a call for 'free trade.' This may be considered a win for the U.S as it opens the door to more overt efforts by the Trump administration to shift the balance of its international relationships.
U.S Treasury Sec Mnuchin: U.S wants free, but fair and balanced trade. NAFTA would have to be reviewed, some WTO rules needed to be better enforced and older agreements may have to be renegotiated.
German Fin Min Schaeuble: G20 communiqué was adopted unanimously. G20 trade discussions were complicated; there was broad consensus that 'open trade' is necessary to strengthen global growth.
Bundesbank President Weidmann: Meeting was marked by intense struggle for a common position, still much to discuss on trade. Agreed now is the time to implement structural reforms.
Japan Fin Min Aso: No one at the meeting remarked that they were against free trade and confirmed importance of free trade despite language in communiqué.
China Fin Min Xiao Jie: Unwaveringly supports free trade and investment, opposes protectionism.
IMF's Lagarde: Global cooperation and pursuing the right policies can help achieve "strong, sustained, balanced, and inclusive growth, while the wrong ones could stop the new momentum in its tracks."
Your Weekly Fundamental View
Need to know
The main focus of this week is on GBP CPI and RBNZ rate decision. It is a light week, and we don't expect any big turmoil from the standard news calendar, but there are some important events that traders should be paying attention to. Let's take a look.
Coming up
AUD Monetary Policy Meeting Minutes are released on Tuesday, 21 March.
This is a detailed record of the RBA Reserve Bank Board's most recent meeting, providing in-depth insights into the economic conditions.
Why should you care? The report creates short-term impact in the markets. The RBA might be providing cues in the currency evaluation and traders could look for some short-term trade setups. Through the statement, traders can get a hint of future policy outcomes.
GBP CPI is due on Tuesday, 21 March.
The report measures a change in the price of goods and services purchased by consumer.
Why should you care? This could be the UK's most important inflation data because it's used as the central bank's inflation target.
NZD GDT Price Index is out on Tuesday, 21 March.
GDT measures the change in the average price of dairy products sold at auction.
Why should you care? It's a leading indicator of the nation's trade balance with other countries.
USD Crude Oil Inventories are due on Wednesday, 22 March.
A build-up in crude oil inventories usually signals decreasing demand from refiners. On the other hand, a drop would signal that refiners are still producing at elevated levels and the inventory overhang in oil products could continue.
Why should you care? This is primarily a US indicator, but it also affects CAD due to Canada's huge energy sector. Previous data showed a -0.2m barrels decrease.
NZD Official Cash Rate decision is released on Wednesday, 22 March.
Interest rate at which banks lend balances held at the RBNZ to other banks overnight is also followed by the RBNZ statement that offers clues regarding the outcome of future decisions.
Why should you care? The rate decision might priced into the market, so it tends to be overshadowed by the RBNZ Rate Statement that is focused on the future. NZD basket tends to move heavily with this report. Volatility is expected.
GBP Retail sales will be released on Thursday, 23 March.
Retail sales are the primary gauge of consumer spending, released monthly, approximately 20 days after the month ends.
Why should you care? The report might create a short-term spike that traders might like to trade.
USD Fed Chief Yellen speaks on Thursday, 23 March.
Mrs. Yellen is supposed to deliver opening remarks at the Federal Reserve System Community Development Research Conference in Washington DC, USA.
Why should you care? As the head of the major central bank who's also in control of short term interest rates, Mrs. Yellen has more influence over the nation's currency value than any other person. Traders should pay attention for some subtle cues regarding future monetary policy.
CAD CPI is out on Friday, 24 March.
The report represents the overall change in the price of goods and services purchased by consumers.
Why should you care? CAD currency basket tends to move with this report.
USD Core durable goods orders will be released on Friday, 24 March.
Being a leading indicator of production, these orders might either rise or drop. Rising purchase orders cue that manufacturers might increase activity.
Why should you care? The report tends to have a short-term impact on the dollar movement.
European Market Update: Quiet Start To Week Despite G20 Omitting Language On Promoting Free Trade
Quiet start to week despite G20 omitting language on promoting free trade
Notes/Observations
G20 Finance Ministers official Communique affirmed commitment against competitive devaluation but omitting language on promoting free trade thanks to recent threats of more protectionism from US govt
China home price gains spread in Feb amid stepped up battle against speculators
Weekend/Overnight:
G20 Summary and commentary
G20 Communique: excess FX volatility is bad for growth, affirms commitment against competitive devaluation; omits language on promoting free trade
US Treasury Sec Mnuchin: US wants free but fair and balanced trade. NAFTA would have to be reviewed, some WTO rules needed to be better enforced and older agreements may have to be renegotiated
German Fin Min Schaeuble: G20 Communique was adopted unanimously. G20 trade discussions were complicated; there was broad consensus that open trade is necessary to strengthen global growth. No controversy on FX at G20
Bundesbank President Weidmann: no consensus at G20 meeting on further development of trade system. Meeting was marked by intense struggle for a common position, still much to discuss on trade. Agreed now is the time to implement structural reforms
Japan Fin Min Aso: No one at the meeting remarked that they were against free trade and confirmed importance of free trade despite language in communique
China Fin Min Xiao Jie: Unwaveringly supports free trade and investment, opposes protectionism
IMF's Lagarde: Global cooperation and pursuing the right policies can help achieve strong, sustained, balanced, and inclusive growth, while the wrong ones could stop the new momentum in its tracks
Asia:
North Korea has conducted a test of a new high-thrust engine at its Tongchang-ri rocket launch station would help North Korea achieve world-class satellite launch capability
Europe:
UK Trade officials said to consider proposing a transitional decade-long deal to EU that includes no tariffs under WTO clause if Brexit negotiations ended with no trade deal - Eurogroup chief Dijsselbloem calls for ESM bailout fund to be turned into a European IMF
German Defense Min von der Leyen: "There is no debit account in NATO" (rejects Trump's claim that Germany owes NATO/US large sums of money for defense)
Germany Social Democrats (SPD) officially elected Martin Schulz as their leader and challenger to Chancellor Angela Merkel for the national election in September
German DIHK Chambers of Commerce: Hard Brexit' would severely hit German economy
Americas:
Brazil govt said to detain meatpacking executive after raids in rotten meat probe
President Trump: Meetings on health care bill are going well; North Korea is "acting very badly"
Energy:
Weekly Baker Hughes US Rig Count: 789 v 768 w/w (+2.7%) (9th straight weekly rise)
Economic Data
(NL) Netherlands Mar Consumer Confidence: 16 v 14e
(DE) Germany Feb PPI M/M: 0.2% v 0.4%e; Y/Y: 3.1% v 3.2%e
(TW) Taiwan Feb Export Orders Y/Y: 22.0% v 16.1%e
Fixed Income Issuance:
None seen
Index snapshot (as of 09:30 GMT)
Indices [Stoxx50 -0.2% at 3,436, FTSE -0.2% at 7,411, DAX -0.3% at 12,055, CAC-40 -0.4% at 5,011, IBEX-35 -0.3% at 10,215, FTSE MIB -0.3% at 20,016, SMI flat at 8,698, S&P 500 Futures -0.2%]
Market Focal Points/Key Themes: European equity indices are trading lower in the morning session as market participants digest the G20 Communique from the weekend, and as oil prices trade lower intraday weighing on sentiment; Banking stocks generally lower with sector losses led by shares of Deutsche Bank after releasing its annual report; Energy, commodity and mining stocks trading lower in the FTSE 100 as oil and copper prices trade lower intraday; Chinese markets ending generally higher with the Nikkei closed overnight on Spring Equinox holiday.
Upcoming scheduled US earnings (pre-market) include Destination XL, Gulf Resources, Movado Group, and Shenandoah Telecom.
Equities (as of 09:20 GMT)
Consumer Discretionary: [Ingenico ING.FR -2.1% (Atos refutes speculation that Worldline subsidiary preparing Ingenico bid)]
Financials: [Aviva AV.UK +0.4% (Reportedly working with Goldman Sachs to sell Friends Provident International; said to be valued at $700M), Deutsche Bank DBK.DE -2.0% (annual report), Euronext ENX.FR -0.2% (Collaborates with Morningstar in European Indices and Derivatives Launch), Hansteen Holdings HSTN.UK +2.8% (Confirms disposal of its German and Dutch portfolios for €1.28B to funds advised by affiliates of Blackstone Group and M7 Real estate; FY16 results), Phoenix Group Holdings PHNX.UK +1.6% (FY16 results), Talanx TLX.DE -0.6% (FY16 results)]
Healthcare: [AB Science AB.FR +10.6% (positive top-line results of final analysis from study AB10015 of masitinib in ALS), EKF Diagnostics EKF.UK +5.6% (shareholder update, reorganization, FY16 results)]
Industrials: [GKN GKN.UK +0.3% (may issue £250M in debt to correct £2B pension deficit)]
Speakers
ECB's Visco (Italy): Cannot signal end of QE and still keep rates low; may shorten the break between exit from QE and first rate hike.
ECB: Banks need to implement realistic and ambitious strategies for Non-performing loan (NPL) reduction
Russia Fin Min Siluanov saw 2017 GDP growth between 1.5-2.0% and noted the RUB currency (Ruble) was 10-12 stronger than what fundamentals suggested
India cabinet approved 4 draft laws related to the rollout of the Goods and Service Tax (GST) that is set to begin on July 1st
Currencies
FX markets began the week on a quiet note with the recent Fed rate hike guidance still weighing upon USD upside momentum. G20 omission of language on promoting free trade provided some uncertainty in global markets but limited price action in FX for the time being.
Dealers noted that ECB seemed unable to curb speculation regarding rate increases so long as macroeconomic data remained resilient. EUR/USD was slightly higher in the session around 1.0760 area
GBP/USD was steady above the 1.24 handle as the dealers awaited the pending trigger to Article 50 before the end of March.
Fixed Income:
Bund futures trade at 159.60 down 23 ticks in lackluster trade in a quiet morning trade as Futures decline off the opening gap higher. Support lies at 159.06 initially before testing contract low at 158.73 followed by 158.40. A move back higher targets 160.16 followed by 160.45.
Gilt futures trade at 125.96 down 29 ticks tracking Bunds having opened up above 126 at 126.10. The UK sees £2B of supply this week on Wednesday which is the equivalent of 39K Gilt futures. Support remains at 125.57 with further weakness eyeing 125.24. Resistance moves to 126.44 then 126.75, 126.87 followed by 127.35. Short Sterling futures flat to 2bp with Jun17Jun18 spread remaining at 20bp.
Monday's liquidity report showed Friday's excess liquidity remained unchanged at €1.355T. Use of the marginal lending facility rose to €178M from €157M prior.
Corporate issuance saw $28.2B come to market last week via 31 tranches bringing issuance for the month to $87.3B and issuance for the year to $355B. In Euro denominated issuance last week saw €22.9B come to market via 36 issuers, led by multi tranche offering from Engie, RELX Finance and SCA Hygiene. Monday saw the bulk of the volume with just shy of €6.5B coming to market.
Looking Ahead
06:00 (EU) Euro Zone Q4 Labour Costs Y/Y: No est v 1.5% prior
06:00 (SK) Slovakia Debt Agency (ARDAL) to sell 2023 and 2027 Bonds
06:00 (EU) Lithuania to sell Bonds
06:00 (RO) Romania to sell Bonds
06:00 (ZA) South Africa announces details of upcoming I/L bond sale (held on Fridays)
06:30 (BE) Belgium Debt Agency (BDA) to sell €2.7-3.2B in 2027, 2038 and 2041 OLO Bonds
06:30 (NL) Netherlands Debt Agency (DSTA) to sell €2.0-4.0B in 3-month and 6-month bills
07:00 (IL) Israel to sell 2018, 2021, 2025, 2027 and 2047 bonds
07:25 (BR) Brazil Central Bank Weekly Economists Survey
07:00 (DE) German Bundesbank Monthly Report
07:30 (CL) Chile Q4 GDP Q/Q: -0.2%e v 0.6% prior; Y/Y: 0.5%e v 1.6% prior
07:30 (CL) Chile Q4 Current Account: -$1.2Be v -$2.8B prior
07:45 (US) Daily Libor Fixing
08:00 (IN) India announces details of upcoming bond sale (held on Fridays)
08:30 (US) Feb Chicago Fed National Activity Index: +0.03e v -0.05 prior
08:30 (CA) Canada Jan Wholesale Trade Sales M/M: 0.5%e v 0.7% prior
09:00 (RU) Russia Feb Unemployment Rate: 5.6%e v 5.6% prior
09:00 (RU) Russia Feb Real Retail Sales M/M: -1.5% v -24.5% prior; Y/Y: -2.0%e v -2.3% prior
09:00 (RU) Russia Feb PPI M/M: -0.8%e v 3.3% prior; Y/Y: 13.0%e v 12.7% prior
09:15 (UK) Baltic Dry Bulk Index
09:50 (FR) France Debt Agency (AFT) to sell combined €5.2-6.4B in 3-month, 6-month and 12-month BTF Bills
10:30 (EU) ECB announces Covered-Bond Purchases
10:35 (EU) ECB calls for bids in 7-Day Main Refinancing Tender
10:50 (UK) BoE conducts reverse Gilt auction
11:30 (US) Treasury to sell 3-Month and 6-Month Bills
13:10 (US) Fed's Evans speaks on Economy and Policy in New York
US Oil – Loss Of 200SMA Weakens The Structure After Recovery Stall Under $50 Breakpoint
Oil started the week in red and broke below strong support at $48.68 (200SMA) which held weakness on Thu/Fri after recovery stalled under ke$50 barrier.
Today's fresh weakness cracked psychological $48.00 support (also near Fibo 61.8% of $47.08/$49.61 recovery leg), signaling that correction might be over.
Daily close below $48.05 Fibo support would generate another bearish signal and risk return to $47.08 (14 Mar spike low/the lowest since 30 Nov).
Overall structure remains bearish and $47.08/$49.61 bull-leg that was capped under thick daily cloud, is seen as correction ahead of fresh extension of larger downmove from $55.01 (21 Feb high) for renewed test of $47.17 pivot (Fibo 61.8% of larger $42.19/$55.22 rally).
Broken 200SMA now acts as strong resistance which is expected to ideally cap.
However, daily RSI is entering negative territory and may delay bears, but no bullish signal seen for now.
Res: 48.67, 49.23, 49.61, 50.00
Sup: 47.95, 47.68, 47.17, 47.08
Gold Strong Corrective Bounce In Play, Silver Further Upside Gains, Crude Oil Weak Correct Bounce.
Gold Strong corrective bounce in play.
Gold has risen sharply, nearly invalidating the bearish outlook. A break of 1246 resistance would negate current bearish technical structure. Key resistance is located at 1263 (27/02/2017 high). Hourly support can be found at 1224.10 )16/03/2017 low).
In the long-term, the technical structure suggests that there is a growing upside momentum. A break of 1392 (17/03/2014) is necessary ton confirm it, A major support can be found at 1045 (05/02/2010 low).
Silver Further upside gains.
Silver rose sharply Friday, invalidating the bearish outlook linked to the previous bearish pause. Correct pullback has failed to find seller indicating test of 17.56 resistance (16/03/2017 high). Strong support is given at 16.84 (27/01/2016 low).
In the long-term, the death cross indicates that further downsides are very likely. Resistance is located at 25.11 (28/08/2013 high). Strong support can be found at 11.75 (20/04/2009).
Crude oil Weak correct bounce.
Crude oil's bearish pressures continues despite correct bounce due to a short-squeeze. The commodity had been unable to mount a serious challenge to resistance at 49.61 (08/12/2017 low) hourly support given at 47.09 (016/03/2017 low) Expected to see deeper selling pressures.
In the long-term, crude oil has recovered after its sharp decline last year. However, we consider that further weakness are very likely. Strong support lies at 24.82 (13/11/2002) while resistance can now be found at 55.24 (03/01/2017 high)
EUR/CHF Choppy Sideways Trading, EUR/JPY Grinding Lower, EUR/GBP Bullish Flag Pattern.
EUR/CHF Choppy sideways trading.
EUR/CHF continues to chop between 11.0678 and 1.0762. The medium-term pattern suggests us to see continued bearish pressures towards key support that can be found at 1.0623 (24/06/2016 low).
In the longer term, the technical structure is mixed. Resistance can be found at 1.1200 (04/02/2015 high). Yet,the ECB's QE programme is likely to cause persistent selling pressures on the euro, which should weigh on EUR/CHF. Supports can be found at 1.0184 (28/01/2015 low) and 1.0082 (27/01/2015 low).
EUR/JPY Grinding lower.
EUR/JPY rejection at 122.88 has triggered a correction. Yet, formation of bullish flag pattern indicates reversal of current selling pressure. Supports stand at 1120.55 (17/01/2017low) and 1120.09 (08/03/2017 low). Resistance stands at 122.88 (13/03/0217 high).
In the longer term, the technical structure validates a medium-term succession of lower highs and lower lows. As a result, the resistance at 149.78 (08/12/2014 high) has likely marked the end of the rise that started in July 2012. Strong support at 94.12 (24/07/2012 low) looks nonetheless far away.
EUR/GBP Bullish flag pattern.
EUR/GBP is correcting lower yet formation of bullish flag suggest reversal of current weakness targeting 0.9000. Key resistance is given at 0.8854 (15/01/2017 high). Support is located at 0.864505/02/2017).
In the long-term, the pair has largely recovered from recent lows in 2015. The technical structure suggests a growing upside momentum. The pair is trading above from its 200 DMA. Strong resistance can be found at 0.9500 psychological level.
USD/CHF Bearish Pause, USD/CAD Trying To Bounce, AUD/USD Monitor The Key Resistance At 0.7778.
USD/CHF Bearish pause.
USD/CHF has paused after sharp exit from uptrend channel. Hourly support is given at 0.9862 (31/01/2017 low) has been broken. Key resistance can be found at a distance at 1.0344 (15/12/2016 high). Expected to consolidate.
In the long-term, the pair is still trading in range since 2011 despite some turmoil when the SNB unpegged the CHF. Key support can be found 0.8986 (30/01/2015 low). The technical structure favours nonetheless a long term bullish bias since the unpeg in January 2015.
USD/CAD Trying to bounce.
USD/CAD is trying to bounce near support at 1.3277. However a break of resistance at 1.3353 is needed to invalidate the current short term bearish technical structure. The road seems wide-open for larger decline. Key support is given at 1.2969 (31/01/2017 low).
In the longer term, there is a golden cross with the 50 dma crossing the 200 dma indicating further upside pressures. Strong resistance is given at 1.4690 (22/01/2016 high). Long-term support can be found at 1.2461 (16/03/2015 low).
AUD/USD Monitor the key resistance at 0.7778.
AUD/USD has successfully tested the support at 0.7497. A break of the key resistance at 0.7778 (08/11/2016 high) is needed to open the way for further strength. Hourly supports can be found at 0.7664 (16/03/2017 low).
In the long-term, we are waiting for further signs that the current downtrend is ending. Key supports stand at 0.6009 (31/10/2008 low) . A break of the key resistance at 0.8295 (15/01/2015 high) is needed to invalidate our long-term bearish view.
EUR/USD Challenging Its Rising Channel Top, GBP/USD Challenging Its Declining Trendline, USD/JPY Moving Lower Within Sideways Channel.
EUR/USD Challenging its rising channel top.
EUR/USD is challenging the resistance implied by its rising trendline (around 1.0795). A break of upside would signal persistent buying pressures. Key resistance is still given at a distance 1.0874 (08/12/2017 high). Strong support can be found at 1.0493 (22/02/2017 low). The technical structure suggests deeper increase towards resistance at 1.0874.
In the longer term, the death cross late October indicated a further bearish bias. The pair has broken key support given at 1.0458 (16/03/2015 low). Key resistance holds at 1.1714 (24/08/2015 high). Expected to head towards parity.
GBP/USD Challenging its declining trendline.
GBP/USD has successfully tested the support at 1.2110 and continues to bounce higher. A break of key resistance (at 1.2429) is needed to open the way for further strength. Yet, the pair remains in a clear downtrend suggesting short term correction. Key resistance can be located at 1.2570 (24/02/2017 high). Hourly support is at 1.2324 (03/17/2017 low).
The long-term technical pattern is even more negative since the Brexit vote has paved the way for further decline. Long-term support given at 1.0520 (01/03/85) represents a decent target. Long-term resistance is given at 1.5018 (24/06/2015) and would indicate a long-term reversal in the negative trend. Yet, it is very unlikely at the moment.
USD/JPY Moving lower within sideways channel.
USD/JPY has failed to break key resistance given at 115.62 (19/01/2016 high confirming persistent selling pressure. The pair remains stuck in sideways trading pattern between 111.36 and 115.62. Hourly support given at 112.47 (nitraday low). Hourly resistance can be located at 113.57 (16/03/2017 high).
We favor a long-term bearish bias. Support is now given at 96.57 (10/08/2013 low). A gradual rise towards the major resistance at 135.15 (01/02/2002 high) seems absolutely unlikely. Expected to decline further support at 93.79 (13/06/2013 low).
G20 Eases Stance On Protectionism, USD Tumbles
News and Events:
USD sell-off ahead of busy week for Fed members
The USD started the week on the back foot against the backdrop of easing US yields and growing investor impatience over Trump's tax cut and fiscal stimulus reforms. High-yielding currencies were buoyed this morning as the low volatility environment encouraged investors to load on risk. In the G10 complex, the Aussie and the Kiwi were the best performers, rising 0.44% and 0.63% respectively. The Japanese yen consolidated last week's gains but did not rise further as market participants resumed the 'hunt for yield'.
The single currency continues to gain ground despite the uncertainty stemming from ongoing French elections. It seems now that the market is already pricing in a defeat from Marine Le Pen or at least indicating that it will not jeopardise the future of the eurozone. The spread between German and French two-year yields continues to narrow. After reaching 0.45%, the spread narrowed to 0.33% as German yields recovered.
After an uneventful G20 meeting in Baden-Baden, investors will have limited data to sink their teeth into. Otherwise, it will be a relatively light week, with the exception of a few speeches from Fed members, which could potentially create some waves in the FX market. We expect the USD sell-off to take a breather in the short term; however further down the road, we are not ruling out further dollar weakness as patience grows thin over Trump's promised economic boost.
G20 stumbles, China will be the long term beneficiary
The stakes on risk to global trade have risen on the back of the G20's failure to reject rising protectionism. In a surprise twist, the G20 published a communiqué removing the wording: 'resist all forms of protectionism' - highlighting the diverse group's ineffectiveness to work together to form a compromise. In a complete role reversal, US Secretary Mnuchin refused to cull protectionism, while China's President Xi was vocal in supporting free trade. The compromised statements included commitment to 'strengthening the contribution of trade to our economies'. The effect on markets was muted however, the risk of destabilising US trade policy has increased. Trump's administration has been preoccupied with domestic policy failures, forcing international issues to the side. US Secretary of State Tillerson was in China to ease bilateral tensions. However, key issues such as North Korea, FX policy concerns and trade were not discussed.
Trump's next move on currency & trade policy is anyone's guess. Instead of delivering on his campaign promise to label China a currency manipulator and slap a massive tariff on Chinese's imports from 'day one', Trump has only targeted China for cheap political points. We suspect that Trump is bluffing in regards to an aggressive Chinese policy, yet the risk of radical unilateral action cannot be ruled out. In the long run, we suspect that the biggest gainer from Trump's non-traditional actions (unstable political partner & withdrawal from Trans-Pacific Partnership etc ) will be China, gaining total dominance in the Asian region. In this regard, we continue to value China assets. USDCNY remains stable around 6.90, on a slightly weaker fix at 6.89.
Today's Key Issues (time in GMT):
- mars.17 Domestic Sight Deposits CHF, last 467.4b CHF / 09:00
- 4Q Labour Costs YoY, last 1,50% EUR / 10:00
- Unieuro SpA IPO press presentation EUR / 10:00
- Central Bank Weekly Economists Survey (Table) BRL / 11:25
- Jan Wholesale Trade Sales MoM, exp 0,50%, last 0,70% CAD / 12:30
- Feb Chicago Fed Nat Activity Index, exp 0,03, last -0,05 USD / 12:30
- Feb Unemployment Rate, exp 5,60%, last 5,60% RUB / 13:00
- Feb Real Disposable Income, exp 0,30%, last 8,10% RUB / 13:00
- Feb Real Wages YoY, exp 2,20%, last 3,10% RUB / 13:00
- Feb Retail Sales Real MoM, exp -1,50%, last -24,50% RUB / 13:00
- Feb Retail Sales Real YoY, exp -2,00%, last -2,30% RUB / 13:00
- mars.17 Bloomberg Nanos Confidence, last 58,2 CAD / 14:00
- Bundesbank President Weidmann speaks in Loerrach, Germany EUR / 16:45
- Fed's Evans Speaks on Economy and Policy in New York USD / 17:10
- mars.19 Trade Balance Weekly, last $1725m BRL / 18:00
- BOE Chief Economist Andy Haldane Speaks in London GBP / 18:20
- Feb Net Migration SA, last 6460 NZD / 21:45
- 4Q BoP Current Account Balance, exp -$12.00b, last -$3.40b INR / 22:00
- mars.19 ANZ Roy Morgan Weekly Consumer Confidence Index, last 113,1 AUD / 22:30
- Feb Tax Collections, exp 93000m, last 137392m BRL / 23:00
The Risk Today:
EUR/USD is challenging the resistance implied by its rising trendline (around 1.0795). A break of upside would signal persistent buying pressures. Key resistance is still given at a distance 1.0874 (08/12/2017 high). Strong support can be found at 1.0493 (22/02/2017 low). The technical structure suggests deeper increase towards resistance at 1.0874. In the longer term, the death cross late October indicated a further bearish bias. The pair has broken key support given at 1.0458 (16/03/2015 low). Key resistance holds at 1.1714 (24/08/2015 high). Expected to head towards parity.
GBP/USD has successfully tested the support at 1.2110 and continues to bounce higher. A break of key resistance (at 1.2429) is needed to open the way for further strength. Yet, the pair remains in a clear downtrend suggesting short term correction. Key resistance can be located at 1.2570 (24/02/2017 high). Hourly support is at 1.2324 (03/17/2017 low). The long-term technical pattern is even more negative since the Brexit vote has paved the way for further decline. Long-term support given at 1.0520 (01/03/85) represents a decent target. Long-term resistance is given at 1.5018 (24/06/2015) and would indicate a long-term reversal in the negative trend. Yet, it is very unlikely at the moment.
USD/JPY has failed to break key resistance given at 115.62 (19/01/2016 high confirming persistent selling pressure. The pair remains stuck in sideways trading pattern between 111.36 and 115.62. Hourly support given at 112.47 (nitraday low). Hourly resistance can be located at 113.57 (16/03/2017 high). We favor a long-term bearish bias. Support is now given at 96.57 (10/08/2013 low). A gradual rise towards the major resistance at 135.15 (01/02/2002 high) seems absolutely unlikely. Expected to decline further support at 93.79 (13/06/2013 low).
USD/CHF has paused after sharp exit from uptrend channel. Hourly support is given at 0.9862 (31/01/2017 low) has been broken. Key resistance can be found at a distance at 1.0344 (15/12/2016 high). Expected to consolidate. In the long-term, the pair is still trading in range since 2011 despite some turmoil when the SNB unpegged the CHF. Key support can be found 0.8986 (30/01/2015 low). The technical structure favours nonetheless a long term bullish bias since the unpeg in January 2015.
| EURUSD | GBPUSD | USDCHF | USDJPY |
| 1.1300 | 1.3445 | 1.0652 | 121.69 |
| 1.0954 | 1.3121 | 1.0344 | 118.66 |
| 1.0874 | 1.2771 | 1.0171 | 115.62 |
| 1.0760 | 1.2422 | 0.9979 | 112.75 |
| 1.0454 | 1.1986 | 0.9862 | 111.36 |
| 1.0341 | 1.1841 | 0.9550 | 106.04 |
| 1.0000 | 1.0520 | 0.9444 | 101.20 |
EUR/USD – Euro Shrugs Off Weak German CPI, Markets Eye FOMC Speeches
EUR/USD has started the week quietly, as the pair trades at 1.0754 in the Monday session. It’s also subdued on the release front, with no major releases on the schedule. German CPI slipped to 0.2%, well off the forecast of 0.7%. In the US, President Trump will speak at an event in Louisville, Kentucky. As well, FOMC member Charles Evans will deliver a speech in New York City.
The Federal Reserve raised rates by a quarter-point last week, but the US dollar responded with broad losses. EUR/USD jumped on the bandwagon, climbing to 5-week highs late last week. Why the negative response? Firstly, there was disappointment in the markets with the Fed policy statement, which was more dovish than expected. The rate move was priced in at over 90 percent, and there had been speculation that a red-hot US economy would propel the Fed to accelerate its pace of monetary tightening, with possibly four rate hikes this year. Instead, Fed Chair Janet Yellen reiterated that further rate hikes would be “gradual” and the Fed made no changes to its “dot plot”, with a projection for three rate hikes in 2017. As well, the US dollar may have lost ground due to traders and investors acting on “buy on rumor, sell on fact”. What’s next for Janet Yellen & Co? Analysts do not expect another rate move in May, while a hike in June is currently priced in at 50%. The markets will be looking for clues about the Fed’s monetary plans. A host of FOMC members will be speaking this weak, highlighted by Janet Yellen’s speech on Thursday at an event in Washington. The market will be looking for clues regarding monetary policy. In the past, Fed policymakers have presented conflicting positions, and if the market senses divisions within the Fed, the US dollar could lose ground.
Last week’s Dutch election was good news for backers of the EU. There had been fears that the far right-wing Freedom Party of Geert Wilders would make substantial gains. Wilders is a fierce critic of the EU and pledged to hold a referendum on the Netherland’s membership in the EU (with the catchy slogan “Nexit”). Dutch Prime Minister Mark Rutte won the election handily, bringing a sigh of relief from governments in Western Europe. Still, Wilders commands the second largest party in the country and his party will be a major player on the Dutch political scene. Next stop is France, which goes to the polls in April. Polls have far rightist Marine Le Pen and centrist Emmanuel Macron and running neck and neck in the first round of the presidential election on April 23. Still, Macron is expected to win in the second-round vote in May.