Sample Category Title
AUD Rises As RBA Stays Sidelined
News and Events:
Australia's central bank holds rate, AUD surges
As broadly expected, the Reserve Bank of Australia kept its cash rate target unchanged at a record low of 1.5%. The RBA reiterated its well-known view that the Aussie is overvalued and stated that an appreciating exchange rate would complicate the economic transition that followed the mining investment boost. However, the institution acknowledged the positive development in commodity prices that provided “a significant boost to Australia's national income”.
Despite the RBA's positive assessment of the economy, Governor Lowe maintained a cautious stance about Australia's outlook, recalling that the “medium-term risks to Chinese growth remains”. Indeed, China is Australia's biggest trade partner as it absorbs around 35% of Aussie total exports. From our standpoint, we suspect that the surge in commodity prices - more specifically iron ore prices - is coming to an end and that a reversal is looming as Chinese stockpiles went through roof while crude steel production remain subdued.
For all these reasons, we believe that the RBA is definitely not on its path to tighten its monetary policy as the inflation gauge is still well below the 2%-3% target band. The year-ended trimmed mean inflation reached 1.6% in December 2016, while the headline gauge hit 1.5%. There RBA is therefore in no hurry to tighten; however should commodity prices consolidate the recent gains, inflation will quickly start to pick-up. Looking at the AUD this morning, it seems that investors consider the latter scenario as highly probable as the Aussie rose 0.30% against the greenback and erased partially last week gains to return above the 0.76 threshold. On our side, we maintain our bearish view on AUD/USD with 0.75 as next target.
On the technical side, a first support lies at around 0.7530-40 (200dma and 50dma), then 0.7519 (Fibonacci 38.2% on December-February rally). Should AUD/USD break these levels, the road will be wide open towards 0.73-0.72.
Evidence of FX intervention as SNB Reserves Surge
The Swiss National Bank's foreign exchange reserves surged 3.8% to 668.2bn CHF. While the SNB does not generally comment on intervention, the size of the balance sheet expansion indicates that the SNB has been very active in FX markets. This has been the fastest accumulation since December 2014 when the SNB was under siege to defend the 1.200 floor. Data published today suggests that the SNB greater exchange rate flexibility did not account for fear-driven flight of capital out of Europe. The strong demand for CHF indicates just how worried European investors are regarding political developments. Despite an improvement in inflation and the growth backdrop, SNB Jordan continues to define the CHF as “significantly overvalued.” Unfortunately for the SNB the short EURCHF trade remains the cleanest way to hedge mounting European political risk. We anticipate that despite SNB intervention the EURCHF will continue to grind lower. On a side note, judging from the SNB actions they are not concerned about US President Trump administration labelling Switzerland a “Currency Manipulator”.
German factory orders collapse
Financial markets always tend to closely monitor German's economic data as the country is always acting as the locomotive of the European economy. In particular its industry is the strongest of the Eurozone. Early this morning, factory orders data have been released and have sharply declined to -7.4% which is the worst month decline since 2009. The read is well below the consensus. A decline of -2.5% was expected.
The low interest rates era has helped the German economy but this does not seem sufficient as the demand is clearly weakening. Fundamental data must be compared with survey such as the IFO business climate or expectations which are showing some positivity
The euro barely reacted to that data and remains below $1.06. Optimism still seems to prevail on the market. The German DAX index is trading at all-time high and there is no reason for this move to stop in the short-term as economic expectations are strong for the time being. The ECB next Thursday should not change anything about the monetary policy and whatever the data, we believe that the euro should stay weak and stocks markets overvalued.
Today's Key Issues (time in GMT):
- Jan Industrial Production MoM, exp -2,50%, last 0,90%, rev 2,30% DKK / 08:00
- Feb Foreign Currency Reserves, last 643.7b, rev 643.9b CHF / 08:00
- Feb Foreign Reserves, exp $2969.0b, last $2998.2b CNY / 08:00
- Feb Budget Balance, last 8.7b SEK / 08:30
- Feb Halifax House Prices MoM, exp 0,40%, last -0,90%, rev -1,10% GBP / 08:30
- Feb Halifax House Price 3Mths/Year, exp 5,30%, last 5,70% GBP / 08:30
- Feb CPI YTD, exp 0,90%, last 0,60% RUB / 09:00
- Feb CPI MoM, exp 0,30%, last 0,60% RUB / 09:00
- Feb CPI YoY, exp 4,60%, last 5,00% RUB / 09:00
- Feb CPI Core MoM, exp 0,40%, last 0,40% RUB / 09:00
- Feb CPI Core YoY, exp 5,20%, last 5,50% RUB / 09:00
- Feb Region Survey: Output Past 3M, last 0,6 NOK / 09:00
- Feb Region Survey: Output Next 6M, last 0,73 NOK / 09:00
- Jan PPI MoM, last 0,60% EUR / 09:00
- Jan PPI YoY, last 0,90% EUR / 09:00
- 4Q GDP Annualized QoQ, exp 0,00%, last 0,20% ZAR / 09:30
- 4Q GDP YoY, exp 0,60%, last 0,70% ZAR / 09:30
- 4Q Gross Fix Cap QoQ, exp 0,60%, last 0,20%, rev -0,50% EUR / 10:00
- 4Q Govt Expend QoQ, exp 0,40%, last 0,50%, rev 0,40% EUR / 10:00
- 4Q Household Cons QoQ, exp 0,50%, last 0,30% EUR / 10:00
- Istat Releases the Monthly Economic Note EUR / 10:00
- OECD Interim Economic Outlook EUR / 10:00
- 4Q F GDP SA QoQ, exp 0,40%, last 0,40% EUR / 10:00
- 4Q F GDP SA YoY, exp 1,70%, last 1,70% EUR / 10:00
- Feb FGV Inflation IGP-DI MoM, exp 0,05%, last 0,43% BRL / 11:00
- Feb FGV Inflation IGP-DI YoY, exp 5,22%, last 6,02% BRL / 11:00
- Jan PPI Manufacturing MoM, last 0,70% BRL / 12:00
- Jan PPI Manufacturing YoY, last 0,78% BRL / 12:00
- 4Q GDP QoQ, exp -0,50%, last -0,80% BRL / 12:00
- 4Q GDP YoY, exp -2,40%, last -2,90% BRL / 12:00
- 4Q GDP 4Qtrs Accumulated, exp -3,60%, last -4,40% BRL / 12:00
- Feb Official Reserve Assets, exp 395.5b, last 390.6b RUB / 13:00
- Jan Trade Balance, exp -$48.5b, last -$44.3b USD / 13:30
- Jan Int'l Merchandise Trade, exp 0.75b, last 0.92b CAD / 13:30
- Feb Vehicle Production Anfavea, last 174064 BRL / 14:20
- Feb Vehicle Sales Anfavea, last 147219 BRL / 14:20
- Feb Vehicle Exports Anfavea, last 37189 BRL / 14:20
- Bank of England Bond Buying Operation GBP / 14:50
- Feb Ivey Purchasing Managers Index SA, exp 58,5, last 57,2 CAD / 15:00
- Jan Consumer Credit, exp $17.250b, last $14.160b USD / 20:00
- Feb ANZ Truckometer Heavy MoM, last -0,80% NZD / 21:00
- 4Q Mfg Activity Volume QoQ, last 2,10% NZD / 21:45
- 4Q Mfg Activity SA QoQ, last 0,40% NZD / 21:45
The Risk Today:
EUR/USD is moving lower. Hourly resistance is given at 1.0679 (16/02/2017 high). Hourly support at 1.0521 (15/02/2017 low) has been broken. The technical structure suggests deeper consolidation below 1.0600. In the longer term, the death cross late October indicated a further bearish bias. The pair has broken key support given at 1.0458 (16/03/2015 low). Key resistance holds at 1.1714 (24/08/2015 high). Expected to head towards parity.
GBP/USD has broken support given at 1.2254 (19/01/2017 low). The road is wide-open for further decline. Hourly resistance is given at 1.2570 (24/02/2017 high). The long-term technical pattern is even more negative since the Brexit vote has paved the way for further decline. Long-term support given at 1.0520 (01/03/85) represents a decent target. Long-term resistance is given at 1.5018 (24/06/2015) and would indicate a long-term reversal in the negative trend. Yet, it is very unlikely at the moment.
USD/JPY is showing limited short-terms buying interest after reversing off base lows. Key resistance is given at 115.62 (19/01/2016 high). The technical structure suggests further weakening towards 112.00. We favor a long-term bearish bias. Support is now given at 96.57 (10/08/2013 low). A gradual rise towards the major resistance at 135.15 (01/02/2002 high) seems absolutely unlikely. Expected to decline further support at 93.79 (13/06/2013 low).
USD/CHF continues to improves after testing 1.0021 support. Hourly resistance is implied by upper bound of the uptrend channel. Key resistance is given at a distance at 1.0344 (15/12/2016 high). Expected to see further strengthening. In the long-term, the pair is still trading in range since 2011 despite some turmoil when the SNB unpegged the CHF. Key support can be found 0.8986 (30/01/2015 low). The technical structure favours nonetheless a long term bullish bias since the unpeg in January 2015.
| EURUSD | GBPUSD | USDCHF | USDJPY |
| 1.1300 | 1.3445 | 1.1731 | 121.69 |
| 1.0954 | 1.3121 | 1.0652 | 118.66 |
| 1.0874 | 1.2771 | 1.0344 | 115.62 |
| 1.0558 | 1.2188 | 1.0152 | 114.02 |
| 1.0454 | 1.1986 | 0.9967 | 111.36 |
| 1.0341 | 1.1841 | 0.9862 | 106.04 |
| 1.0000 | 1.0520 | 0.9550 | 101.20 |
EUR/USD – Euro Shrugs Off Dismal German Factory Orders
EUR/USD has ticked lower in the Tuesday session. Currently, the pair is trading at 1.0560. On the release front, German Factory Orders declined 7.4%, well below the estimate of a 2.5% decline. Eurozone Revised GDP edged up to 0.4%, matching the forecast. In the US, today’s highlight is Trade Balance, with an expected deficit of 47.0 billion. On Wednesday, the US releases ADP Nonfarm Employment Change, ahead of the official Nonfarm Payrolls report on Friday.
After some solid data last week, German numbers have looked dreadful early in the week. The markets were braced for a soft reading from Factory Orders in February, but the sharp drop of 7.4% was much worse than expected. On Monday, retail sales, the primary gauge of consumer spending, declined 0.8%, compared to an estimate of 0.2%. This marked a fifth decline of six releases, as the German consumer continues to hold tight to her purse strings. The euro has held steady despite these weak readings, but if the negative trend continues from the Eurozone’s largest economy, investors could get edgy and the euro could again head south towards the 1.05 level.
Donald Trump continues to create controversy on an almost basis, much to the consternation of the markets. Still, the dollar remains strong, buoyed by a strong economy and the increasing likelihood of a rate hike at the upcoming Fed policy meeting on March 15. The likelihood of a March hike as jumped to 84%, according to the CME group, compared to 33% just a week ago. Why the huge jump in odds? One reason is that Fed policymakers have sent out strong hints that the Fed is leaning towards raising rates next week. Earlier in the year, the Fed sent out signals Fed sent out signals that it would stay on the sidelines until it had a clearer picture of Trump’s economic agenda, such as an outline of tax reform or fiscal spending plans. That has changed, as the Fed appears poised to move ahead despite the lack of any details about the administration’s economic policy. This week’s job numbers will be critically important, as strong numbers will likely boost the odds of a March move as well as push the greenback to higher levels.
AUDUSD – Prolonged Consolidation Expected On Mixed Technicals
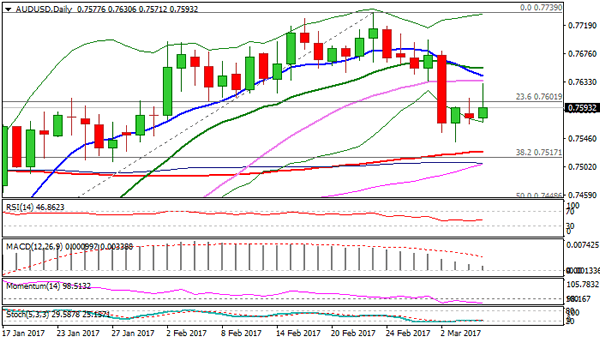
The pair returned below 0.7600 handle on Tuesday after probe above pivot at 0.7616 (Fibo 38.2% of 0.7739/0.7541 pullback) failed to sustain break, as rally was capped by 55SMA at 0.7634.
Studies on daily chart remain mixed and lacking clearer direction signals that may result in prolonged consolidation.
Downside is expected to remain at risk as pullback from 0.7739 doesn't look completed.
Increased downside pressure could be expected on violation of 0.7541 (Friday's low) that would expose a cluster of strong supports, consisting of 200 / 100 and 55 SMA's (0.7526/0.7509/0.07508 respectively) and Fibo 38.2% of 0.7158/0.7739 rally that marks downside breakpoint.
Conversely, bounce above upper triggers at 0.7634 / 0.7641 / 0.7653 (55 / 10 / 20 SMA's) is needed to generate stronger bullish signal for fresh recovery.
Res: 0.7634, 0.7641, 0.7653, 0.7697
Sup: 0.7571, 0.7541, 0.7526, 0.7509
Trade Idea: EUR/JPY – Buy at 119.65
EUR/JPY - 120.47
Recent wave: wave v of (C) ended at 94.12 and major correction in wave A has ended at 149.79
Trend: Sideways
Original strategy:
Buy at 119.65, Target: 121.35, Stop: 119.05
Position: -
Target: -
Stop: -
New strategy :
Buy at 119.65, Target: 121.35, Stop: 119.05
Position: -
Target: -
Stop:-
Euro’s retreat after rising to 121.19 late last week suggests consolidation below this level would be seen and pullback to 120.00 is likely, however, reckon downside would be limited to 119.60-65 and bring another rise later, above said resistance at 121.19 would extend the rebound from 118.24 low for retracement of recent decline to 121.30-35 but overbought condition should limit upside to 121.90-00 and price should falter well below resistance at 122.52, bring another decline later.
In view of this, we are looking to buy euro on dips as 119.60-65 should limit downside. Below previous resistance at 119.47 would defer and risk weakness to 119.00-10 but reckon support at 118.67 would contain downside and bring further consolidation. Only below this support would signal the rebound from 118.24 has ended, bring retest of this level later. A drop below there would extend recent decline from 124.10 top to 118.00 and later towards 117.50.
Our latest preferred count is that wave (ii) is ABC-X-ABC which ended at 123.33 and wave (iii) is unfolding with wave iii ended at 100.77, followed by wave iv at 111.57 and wave v as well as the wave (iii) has ended at 97.04, followed by wave (iv) at 111.43 and wave (v) has ended at 94.12 which is also the end of the larger degree v, this also implied the major wave (C) has also ended there, hence major correction has commenced from there with (A) leg unfolding in its lower degree wave c which has possibly ended at 145.69. Under this count, A-B-C wave (B) has commenced with A leg ended at 136.23, wave B at 143.79 and wave C has possibly ended at 149.79.
Our larger degree count is that the decline from 139.26 is wave (C) and is sub-divided into a diagonal triangle i-ii-iii-iv-v with wave i - 105.44, wave ii- 123.33, wave iii - 97.03, wave iv - 111.43, followed by the final wave v as well as the end of wave (C) at 94.12, this also mark the bottom of larger degree wave B. Under this count, major rise in wave C has commenced as an impulsive wave with minor wave III ended at 145.69, wave V is still in progress for further gain to 150.00. Having said that, this so-called wave V could well be the first leg of larger degree 5-waver wave C and this wave C should bring at least a retest of wave A top at 169.97 (July 2008).

Trade Idea: AUD/USD – Sell at 0.7605
AUD/USD – 0.7587
Recent wave: Wave 5 ended at 1.1081 and major correction has commenced for fall to 0.7000 and then towards 0.6500-10
Trend: Near term up
New strategy :
Sell at 0.7605, Target: 0.7450, Stop: 0.7665
Position: -
Target: -
Stop:-
Although aussie recovered after falling to 0.7543 late last week, reckon upside would be limited to 0.7640-45 (50% Fibonacci retracement of 0.7741-0.7543) and bring another decline later, below said support at 0.7543 would extend the fall from 0.7741 top for retracement of recent upmove to 0.7512 support but oversold condition should prevent sharp fall below previous support at 0.7493 and price should stay above support at 0.7449, bring rebound later.
In view of this, we are looking to sell aussie on recovery as 0.7605-10 should limit upside. Only above 0.7665 (61.8% Fibonacci retracement of 0.7741-0.7543) would abort and suggest the retreat from 0.7741 has ended, bring a stronger rebound to 0.7700 but price should falter well below said resistance at 0.7741, bring another decline.
On the 4-hour chart, the move from 0.8066 is the wave 5 with i: 0.8860, ii: 0.8315, wave iii is an extended move ended at 1.0183, iv: 0.9706 and wave v has ended at 1.1081 (also the top of entire wave 5). The subsequent selloff is the major correction which is unfolding as ABC-X-ABC and 2nd A leg has ended at 0.8848, followed by a-b-c wave B which ended at 0.9758, hence, 2nd C wave is now in progress and indicated downside target at 0.7000 and 0.6950 had been met, so further fall to 0.6710-20 cannot be ruled out.

USDJPY – Monday’s Doji Signals Indecision, Cloud Twist Could Signal Fresh Upside, Key Supports At 113.56/30
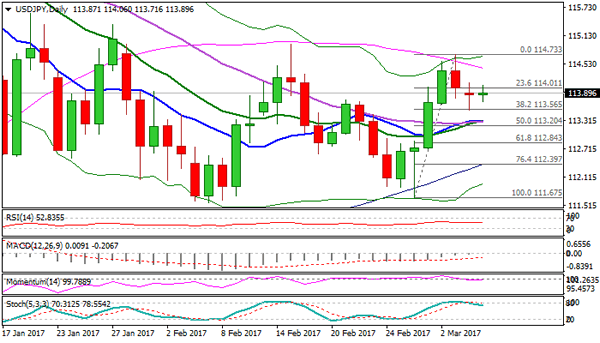
Pullback from last Friday's recovery top at 114.73 was so far contained at 113.56 (Fibo 38.2% of 111.67/114.73 upleg), with yesterday's action shaped in Doji candle and signaling indecision.
Plethora of strong supports that lies just below (converged 10/20/30 SMA's at 113.30 zone) stays intact for now and firm break here is needed for stronger bearish signal.
However, daily cloud is twisting up on Wednesday and could attract for fresh upside attempts.
Current action could be seen as consolidation ahead of renewed bulls, with 113.56/30 zone required to hold and keep scenario in play.
Daily studies show mixed signals, as MA's are bullishly aligned but other indicators are holding in neutrality zone.
Initial bullish signal could be expected on firm break above 114.00 handle, with lift above 114.30 needed to confirm and signal further upside for attack at upper triggers at 114.73 (Friday's recovery rejection) and 114.94 (15 Feb spike high).
Res: 114.11, 114.30, 114.73, 114.94
Sup: 113.56, 113.30, 113.00, 112.84
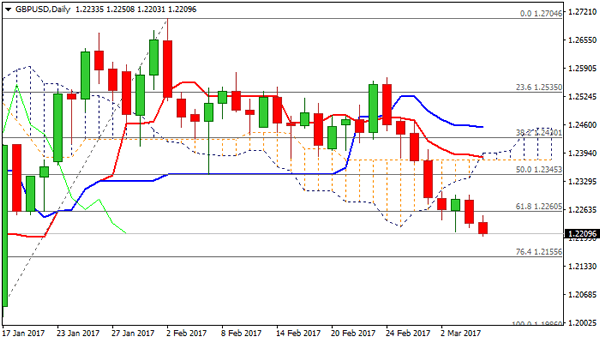
GBPUSD – Fresh Bearish Extension Was Triggered On Close Below Fibo 61.8% Support At 1.2260
Fresh weakness on Tuesday is probing below new 7-week low at 1.2212, after bearish acceleration on Monday managed to close below 1.2260 Fibo support on third attempt.
This gives fresh bearish signal for extension of the downleg from 1.2568 (24 Feb lower top) towards next target at 1.2155 (Fibo 76.4% of 1.1986/1.2704 rally).
Daily studies are in firm bearish setup, with fresh bear-crosses of 10/100 and 10/55 SMA's maintain strong downside pressure.
However, slow stochastic is oversold on daily chart and warns of possible bullish signal that would delay bears.
Session high at 1.2250 marks solid resistance which guards more significant barriers at 1.2300 zone (triple upside rejection) where extended upticks should be ideally capped.
Res: 1.2250, 1.2300, 1.2356, 1.2379
Sup: 1.2200, 1.2155, 1.2119, 1.2035
RBA Remains on Hold; Maintains its Neutral Bias
Overnight, the Reserve Bank of Australia kept its borrowing costs unchanged and maintained its neutral bias with regards to policy. The meeting statement was more or less a repetition of the previous one, offering little fresh information to investors. The Bank reiterated that the domestic economy remains robust, and for the umpteenth time it noted that it prefers a weaker currency, as an appreciating Aussie could complicate economic adjustments. Perhaps the most noteworthy point was that the officials are still worried about high housing prices posing a risk to financial stability. This suggests that the bar for any further easing remains high, reinforcing our view that the Bank is likely to stay on hold for a while. Perhaps due to the lack of fresh forward guidance from the RBA, the reaction in the Aussie was relatively limited on the decision, though the currency moved a bit higher against its major counterparts in the following minutes.
Looking ahead, the outlook for the Aussie appears cautiously positive in our view, at least against most of its major counterparts. The RBA has shown little appetite for further easing, and has maintained a neutral stance in all its latest communications. At the same time, Governor Lowe recently indicated that it's hard to say that the Australian dollar is overvalued, implying that the RBA may be tolerant of some further gains in the currency. What's more, iron ore prices have surged in recent months, something likely to continue to support Australia's commodity-exporting economy. However, we prefer to avoid the USD as a counterpart to exploit any future AUD gains, considering the hawkish signals from FOMC policymakers regarding a March rate hike. Instead, EUR/AUD appears a much better play, having in mind that Eurozone's political uncertainties have begun to escalate (see below).
EUR/AUD slid yesterday after it hit resistance near the psychological round figure of 1.4000 (R2) and the lower bound of the falling wedge that had been containing the price action from December 2015 until February 2017. That move supports our view that the broader path remains negative and that the recovery started on the 22nd of February was just a corrective phase. We expect the bears to continue pushing the rate lower in the foreseeable future and perhaps challenge the 1.3840 (S1) level soon. A clear break below that area is possible to see scope for extensions towards our next support of 1.3725 (S2).
European political risks come back into the spotlight
European political risks emanating from the French Presidential election came back under the market's microscope yesterday, as the Republican Party formally announced that its candidate will be Francois Fillon. Prior to this, there was some chatter about Fillon dropping out of the race and being replaced by Alain Juppe, since Fillon's chances to win were seen as diminishing following the recent allegations over payments to his family members for parliamentary work.
Juppe announced yesterday that he will not challenge Fillon, which implies that Republicans may not even make it to the second round as Fillon is currently third in most polls, behind Macron and Le Pen. Therefore, this may have been interpreted as increasing the odds for Le Pen to win the presidency, something that pushed the euro somewhat lower. EUR/USD edged south after it hit resistance near the 1.0630 (R1) obstacle, which is the upper bound of the sideways range that has been containing the price action since the 17th of February. Nevertheless, the slide was stopped by the 1.0570 (S1) support level. We still expect the common currency to remain on the back foot in coming weeks, at least ahead of the upcoming Dutch and French elections, with the former vote due to take place next week. A decisive dip below 1.0570 (S1) is possible to open the way for another test near the psychological territory of 1.0500 (S2), which also happens to be the lower bound of the aforementioned range. Besides EUR/USD, our other favorite proxy for any potential near-term EUR weakness is EUR/JPY, due to the possibility of the yen attracting some safe haven flows amid this political uncertainty in the EU.
Today's highlights: During the European day, Germany's factory orders for January are due out, though no forecast is presently available. We also get Eurozone's final GDP for Q4. The forecast is for the final figure to confirm the preliminary estimate and as such, the reaction in EUR may remain limited.
From the US, we get the trade balance for January. Expectations are for the nation's trade deficit to have widened, something that could hurt the dollar somewhat on the news. However, considering the bullish sentiment currently surrounding the currency amid hawkish signals from key FOMC officials, we expect any negative reaction from the trade data to remain short-lived.
We also get Canada's trade data for January, as well as the nation's Ivey PMI for February. The trade surplus is expected to have narrowed, albeit slightly, while no forecast is available for the Ivey figure.
EUR/AUD
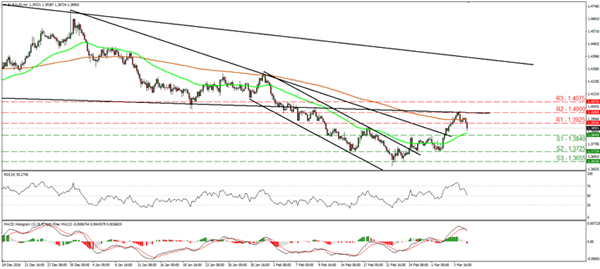
Support: 1.3840 (S1), 1.3725 (S2), 1.3655 (S3)
Resistance: 1.3925 (R1), 1.4000 (R2), 1.4075 (R3)
EUR/USD
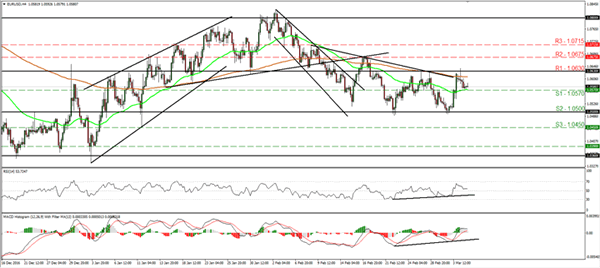
Support: 1.0570 (S1), 1.0500 (S2), 1.0450 (S3)
Resistance: 1.0630 (R1), 1.0675 (R2), 1.0715 (R3)
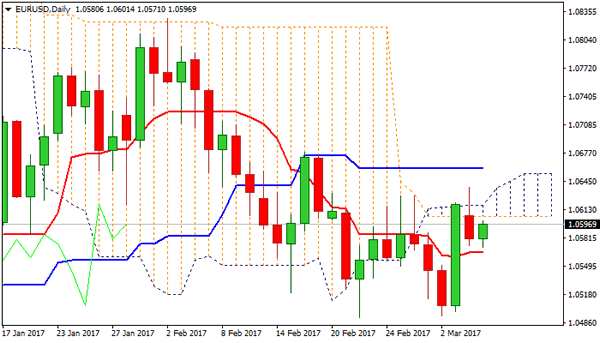
EURUSD – Monday’s Upside Rejection And Close Below Daily Cloud Keeps The Downside At Risk
Upside extensions after Friday's strong rally was short-lived, as the rally stalled at 1.0638 and closed under daily Ichimoku cloud on Monday that could be seen as negative signal.
Initial lower pivot at 1.0572 (Fibo 38.2% of Friday's rally / converged 5/10SMA's) was tested but is holding for now.
Overall structure remains weak with fresh 20/55 SMA bear-cross adding on existing negative outlook.
In addition, daily cloud that twisted on 01 Mar and is starting to widen, also weighs on market.
Bearish scenario requires firm break below 1.0572 and 1.0566 (daily Tenkan-sen) lower pivots to signal lower top and open way for further retracement of Fri/Mon 1.0499/1.0638 rally.
At the upside, daily cloud (currently spanned between 1.0605 and 1.0618) marks initial resistance, ahead of falling 30SMA (1.0641) and 100SMA (currently at 1.0668) which marks the upper trigger for stronger recovery action of larger 1.0827/1.0493 descend.
Res: 1.0605, 1.0618, 1.0641, 1.0668
Sup: 1.0572, 1.0566, 1.0552, 1.0520
S&P500 Intraday View
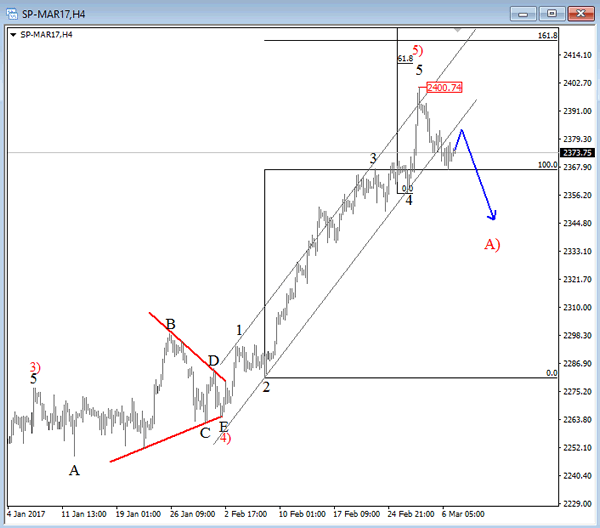
E-mini S&P500 has five waves down from 2400 so index can be moving into a new bearish phase, which can be only a correction of a higher degree. But in either case there should be more downside coming after a three wave; a-b-c rally that may find resistance today near 2383.
S&P500, 1H