

Sample Category Title
USD/CHF: Swiss Franc Trading Marginally Higher In The Morning Session
For the 24 hours to 23:00 GMT, the USD rose 0.41% against the CHF and closed at 1.0115.
In the Asian session, at GMT0400, the pair is trading at 1.0111, with the USD trading a tad lower against the CHF from yesterday’s close.
The pair is expected to find support at 1.0077, and a fall through could take it to the next support level of 1.0043. The pair is expected to find its first resistance at 1.0137, and a rise through could take it to the next resistance level of 1.0163.
With no major economic releases in Switzerland today, investor sentiment would be governed by global macroeconomic events.
The currency pair is showing convergence with its 20 Hr and 50 Hr moving averages.

USD/CAD: Loonie Trading On A Stronger Footing, Ahead Of Canada’s Ivey PMI
For the 24 hours to 23:00 GMT, the USD rose 0.22% against the CAD and closed at 1.3410.
In the Asian session, at GMT0400, the pair is trading at 1.3390, with the USD trading 0.15% lower against the CAD from yesterday's close.
The pair is expected to find support at 1.3365, and a fall through could take it to the next support level of 1.3339. The pair is expected to find its first resistance at 1.3420, and a rise through could take it to the next resistance level of 1.3449.
Ahead in the day, market participants will closely monitor Canada's Ivey PMI for February and international merchandise trade balance data for January.
The currency pair is showing convergence with its 20 Hr and 50 Hr moving averages.

EUR/USD Reaches Fibonacci Of Wave-B In Consolidation Zone
Currency pair EUR/USD
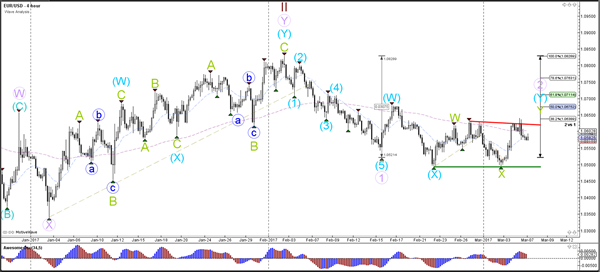
The EUR/USD indeed bounced at the resistance trend line (red) but the reaction has been mild and choppy, which makes an expanded correction within waves Y (green/blue) likely. A break above resistance (red) could see price move higher to test the Fibonacci levels of wave 2 (purple) but a push above the 100% level invalidates the wave structure. A break below support (green) could see the downtrend continue.
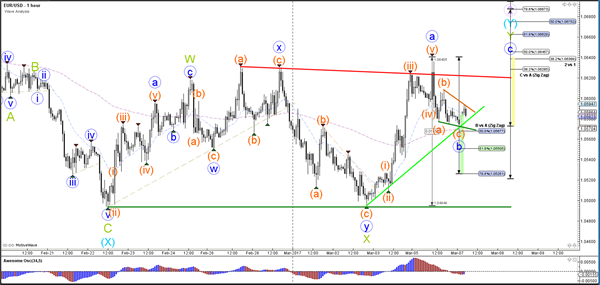
The EUR/USD tested the resistance trend line (red) one more time, which could be a wave 5 (orange) within wave A (blue). Price has bounced at the 50% Fib and could continue towards the wave C (blue) targets at the Fibonacci levels. A break below the support line (green) invalidates the ABC (blue) whereas the other Fibonacci levels of wave B vs A could act as support.
Currency pair GBP/USD
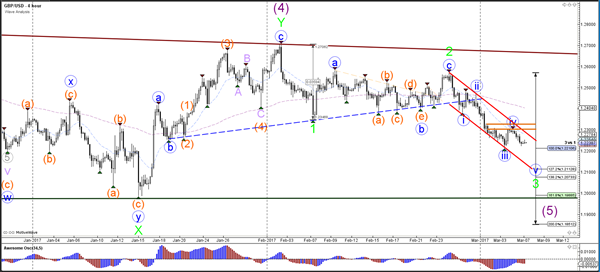
The GBP/USD bounced at the top of the bearish channel (red lines) and is now approaching the previous bottom and 100% Fibonacci target. A bearish breakout could see price fall towards the Fibonacci levels of waves 3 (green). A bullish retracement see price test the resistance again (orange/red).
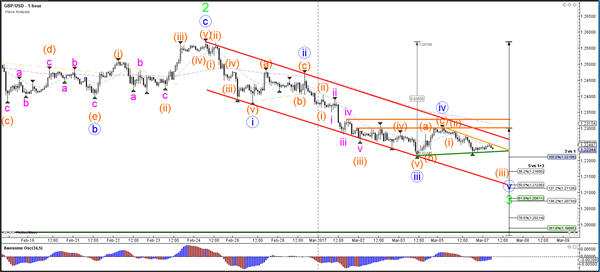
The GBP/USD break below the support trend line (green) could see price continue with wave 5 (blue) of wave 3 (green). A break above the inner resistance line (light orange) could see price expand with the wave 4 (blue) retracement towards the previous resistance (orange/red lines).
Currency pair USD/JPY
The USD/JPY bounced at the resistance level (red line) and a break above it could see the USD/JPY continue with the uptrend and the waves 3 (blue/brown).
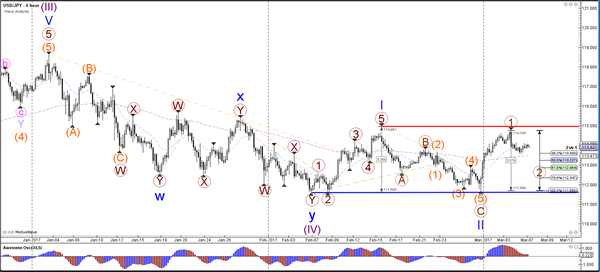
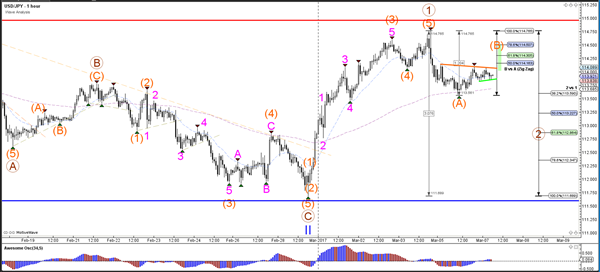
The USD/JPY used the strong resistance (red) to bounce and could be building an ABC (orange) within wave 2 (brown) and retrace back to the Fibonacci levels of wave 2 vs 1 (brown).
Asian Market Update: RBA On Hold With Slightly Rosier View Of Domestic Economy
RBA on hold with slightly rosier view of domestic economy
Asia Mid-Session Market Update: RBA on hold with slightly rosier view of domestic economy; THAAD system components start to arrive in Korea
US Session Highlights
(US) Trump trade adviser Navarro: Questions Chinese, Japanese, German and Indian trade fairness; Can reduce trade deficit through negotiations
(MX) Mexico central bank begins auction of $1B in non-deliverable forwards (start of $20B program to bolster the peso)
(MX) MEXICO FEB CONSUMER CONFIDENCE: 75.7 V 68.6E
(US) JAN FACTORY ORDERS: 1.2% V 1.0%E
IEA Chief Economist Birol: beginning to see a second wave of US shale growth, the size of which will determine the oil price direction
US markets on close: Dow -0.2%, S&P500 -0.3%, Nasdaq -0.4%
Best Sector in S&P500: Energy
Worst Sector in S&P500: Materials
Biggest gainers: RRC +4.1%, COG +3.5%, SWN +3.0%, NFLX +2.0%, MRO +1.8%
Biggest losers: ENDP -6.9%, CSRA -4.3%, FTR -3.8%, FSLR -3.7%, RIG -3.6%
At the close: VIX 11.2 (+0.3pts); Treasuries: 2-yr 1.31% (flat), 10-yr 2.49% (flat), 30-yr 3.10% (+1bps)
US movers afterhours
MEET: Reports Q4 $0.19 v $0.19e, R$29.2M v $28.7Me; +18.5% afterhours
WFT: Names Mark A. McCollum new CEO effective in late April; +14.6% afterhours
ASNA: Reports Q2 -$0.07 v -$0.10e, R$1.75B v $1.75Be; +7.8% afterhours
DISH: To be added to S&P500 Index, effective at the open on March 13th; +5.3% afterhours
PIR: Guides Q4 $0.32-0.34 v $0.30e; Rev -2.6%; SSS +0.2% - We are raising our estimates for earnings per share and adjusted earnings per share for the fourth quarter and full year as a result of a number of key factors; +5.0% afterhours
CRM: IBM and Salesforce announce global strategic partnership centered on artificial intelligence; +2.1% afterhours
THO: Reports Q2 $1.23 v $1.26e, R$1.59B v $1.51Be- Q2 Consolidated RV backlog $1.38B v $1.21B q.qq; -2.5% afterhours
CASY: Reports Q3 $0.58 v $0.88e, R$1.77B v $1.82Be; To repurchase up to $300M in common stock (6.7% of market cap); -4.6% afterhours
PCRX: Files to sell $300M aggregate principal amount of convertible senior notes due 2022; -4.9% afterhours
KTWO: Reports Q4 -$0.30 v -$0.26e, R$61.8M v $61.5Me- Guides initial FY17 R$263-270M v $270Me - Guides initial FY17 adj EBITDA $6-10M; -8.0% afterhours
Politics
(US) House releases text of Obamacare replacement bill: To include refundable tax credits tied to age and income
Asia Key economic data:
(AU) RESERVE BANK OF AUSTRALIA (RBA) LEAVES CASH RATE TARGET UNCHANGED AT 1.50% (AS EXPECTED)
(AU) AUSTRALIA FEB AIG PERFORMANCE OF CONSTRUCTION INDEX: 53.1 V 47.7 PRIOR (1st expansion in 5-months)
(TW) TAIWAN FEB CPI Y/Y: 0.0% V 0.7%E; WPI Y/Y: 2.2% V 3.0%E
Asia Session Notable Observations, Speakers and Press
Asia indices are mixed as investors shrugged political drama in Washington. Energy led other sectors in US session despite lower oil prices, while Financials and Materials slumped. Nikkei225 put in a modest drop as USD/JPY sank back below ¥114. AUD/USD was also volatile, with RBA delivering a modest upgrade of economic conditions, but not enough to materially shift expectations for a rate hike this year.
AUD rose going into the decision to session highs of 0.7630 on expectations of hawkish language and then fell back below 0.76 on release of another neutral statement. Most notably, RBA added that "exports have risen strongly and non-mining business investment has risen over the past year" and also acknowledged better Q4 GDP by noting that "consumption growth was stronger towards the end of the year". However, RBA also reiterated that inflation remains quite low and cheered depreciating exchange rate in assisting economy transition from its mining boom. Fixed income markets were pricing in about a 30% chance of a rate hike this year going into the statement, and after the decision those odds rose only about 3pts.
Tensions on the Korean peninsula continued to simmer as White House released a statement that President Trump spoke with leaders of Japan and South Korea. Trump said the North Korea launch is a violation of UN resolutions and poses a "serious threat". On a related note, US commander in the region said the launch justifies THAAD deployment which started today and may begin operating as soon as next month. Recall that China has been a vocal opponent of THAAD deployment in the region, cancelling joint exercises with South Korea and urging termination of the system.
China
(CN) China NDRC: Sees coal prices falling steadily, coal supply is sufficient
(CN) UBS Economist Hu: Sees PBOC cutting RRR 4x in 2017; benchmark rate hike unlikely this year
(CN) PBOC Dep Gov Yi Gang: Will seek to prevent systemic risk and moral hazard in markets - Chinese press
Japan
(JP) Japan Fin Min Aso: China needs to address overcapacity and debt issues
(JP) Japan Center for Economic Research (JCER): Japan Jan GDP estimated at -0.5% m/m v -0.5% prior - Nikkei
Australia
(AU) AMP's Oliver: RBA to remain on hold until H2 of 2018 - SMH
(NZ) IMF: New Zealand household debt continues to be a risk to financial stability
Korea
(KR) Commander of US Pacific Command: North Korea's latest missile launch confirms the need for THAAD deployment; some equipment, including 2 launch pads for Thaad US missile defense system, has arrived in South Korea; Thaad may start operating as soon as April
(KR) White House: Pres Trump spoke to Japan PM Abe and South Korea acting Pres Hwang; North Korea poses a "serious threat" and latest missile launch is a clear violation of UN resolutions - press
(KR) South Korea govt think tank (KDI): Modest economic recovery losing momentum due to faltering consumption - Korean press
Asian Equity Indices/Futures (00:00ET)
Nikkei -0.2%, Hang Seng +0.4%, Shanghai Composite -0.1%, ASX200 +0.2%, Kospi +0.7%
Equity Futures: S&P500 flat; Nasdaq flat; Dax +0.3%; FTSE100 +0.2%
FX ranges/Commodities/Fixed Income (00:00ET)
EUR 1.0570-1.0595; JPY 113.85-114.10; AUD 0.7575-0.7630; NZD 0.6980-0.7020
Apr Gold flat at $1,225/oz; Apr Crude Oil flat at $53.20/brl; May Copper +0.1% at $2.66/lb
(IQ) Iraq energy min: Iraq would participate if OPEC decides to extend the cut agreement past June 30th, but too soon to say if it should be extended - Ceraweek conf comments
(AU) Australia Port Hedland Feb Iron Ore Exports 35.7Mt v 40.3Mt m/m
GLD SPDR Gold Trust ETF daily holdings fall 3.8 tonnes to 836.8 tonnes; lowest since Feb 10th; 2nd straight decline
(CN) PBOC SETS YUAN MID POINT AT 6.8957 V 6.8790 PRIOR; weakest CNY setting since Jan 17th
(CN) PBOC to inject combined CNY30B v CNY40B prior in 7-day, 14-day and 28-day reverse repos
(JP) Japan MoF sells ¥723B in 0.8% (0.6% prior) 30-yr bonds; Avg yield: 0.821% v 0.907% prior; Bid to cover: 3.14x v 3.23x prior
(KR) South Korea sells 30-yr Govt bonds at 2.369%
Asia equities/Notables/movers by sector
Consumer discretionary: 848.HK Maoye International Holdings -1.3% (profit warning); 7956.JP Pigeon Corp +1.5% (FY16/17 result)
Financials: 6030.HK CITIC Securities +1.6% (Feb result); 1918.HK Sunac China Holdings +3.4%, 688.HK China Overseas Land +1.3% (Feb result); WFD.AU Westfield Corp -1.5% (Credit Suisse cuts rating)
Industrials: 2333.HK Great Wall Motor +0.8% (Feb result); 4005.JP Sumitomo Chemical Co +2.3% (to triple OLED screen capacity); 6103.JP Okuma Corp +2.4% (Goldman Sachs raises rating); 7211.JP Mitsubishi Motors -1.5% (Nomura cuts rating)
Technology: 066570.KR LG Electronics Inc +5.0% (strong preorders of G6 smartphone); 7751.JP Canon +2.1% (efforts to form profit structure); 7974.JP Nintendo Co +1.9% (Switch device sales)
Materials: RRL.AU Regis Resources -3.5%, RSG.AU Resolute Mining -3.6%, SBM.AU St Barbara -1.5% (gold declines)
Utilities: 5803.JP Fujikura -2.5% (Nomura cuts rating)
Foreign Exchange Market Commentary
EUR/USD
The week started in a dull fashion, with investors lacking motivation to push currencies one way of the other, amid the absence of macroeconomic and political news. The EUR/USD pair eased modestly after attempting a bullish breakout early London, having, however, set a fresh 3-week high of 1.0639, but settled a handful of pips below the 1.0600 threshold. There were some minor macroeconomic releases, including the EU Sentix Investor Confidence Index for March, which reached a 10-year high of 20.7, and US Factory Orders for January, up 1.2% as expected, the second consecutive monthly increase. Nevertheless, investors held in wait-and-see mode ahead of the main events of the week, the ECB monetary policy meeting on Thursday, and the US Nonfarm Payroll report on Friday.
The European Central Bank is expected to remain on hold, as despite inflation has been advancing during the last two months, it has been driven by volatile components such as energy and food, with the underlying inflation still at 0.9%. Still, the Central Bank will reduce its monthly amount of purchases to €60b starting next April, which may arise speculation of tapering, although the most likely scenario is another form of easing planned to 2018.
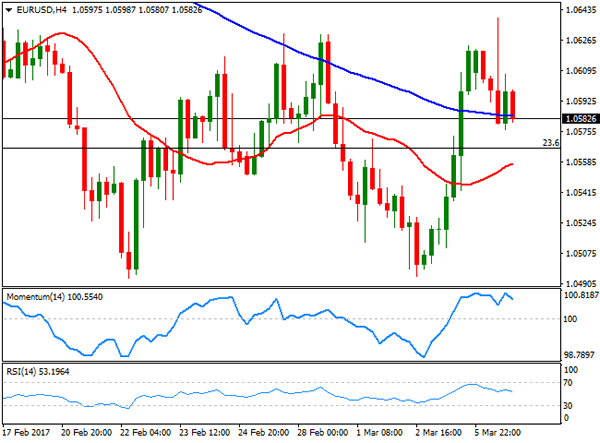
In the meantime, the pair trades uneventfully above the 1.0565 Fibonacci support. The 4 hours chart shows that technical indicators have lost their upward strength and turned south within positive territory, but are still above previous daily lows, whilst the price is moving back and forth around a bearish 100 SMA, and above a slightly bullish 20 SMA, indicating limited directional strength. The key support is the 1.0520 region, as renewed selling interest below the level could see the pair extending its slide towards 1.0340, this year low, while the upside remains well-limited as long as the price remains below the 1.0700/20 price zone.
Support levels: 1.0565 1.0520 1.0470
Resistance levels: 1.0635 1.0660 1.0710
USD/JPY
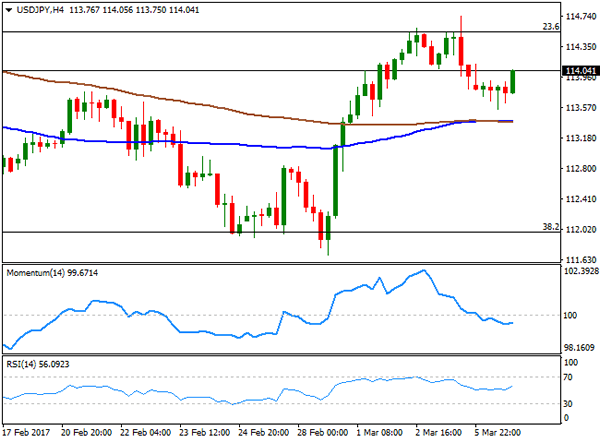
The USD/JPY pair ends the day unchanged from Friday's close, although recovering from a daily low of 113.55 achieved at the beginning of the day. As usual, yields differentials are dominating price action, but given that US treasury notes' yields are pretty much unchanged intraday, the pair is mute. The 10-year benchmark advanced to 2.50% from previous 2.49%, while the 2-year note remained flat. There's little ahead in Japan this Tuesday, with attention centered in early Wednesday GDP and Trade balance figures. The pair fell briefly below its 100 DMA, but settled above it, although selling interest around 114.50 keeps limiting advances. Shorter term, the 4 hours chart shows that the 100 and 200 SMA converge around 113.25 with no directional strength, reflecting the absence of a clear trend, whilst technical indicators have lost their bearish tone after entering bearish territory, with the RSI indicator already above its mid-line, heading north around 55. Still, the pair needs to advance beyond 114.95, February 15th high, to shrug off at least partially, the bearish tone.
Support levels: 113.50 113.25 112.90
Resistance levels: 114.55 114.95 115.30
GBP/USD
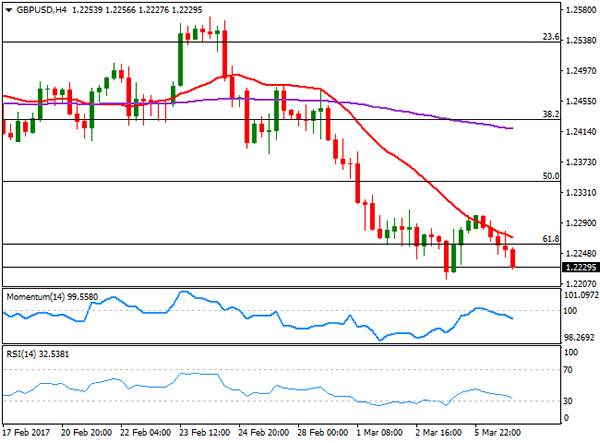
After failing to surpass the 1.2300 level, the GBP/USD pair fell towards its recent multi-week low, ending the day not far from last week low of 1.2213. The macroeconomic calendar was scarce in the UK, and will remain so until next Friday, which means attention will center in Brexit woes. This Monday, a spokesman from the government said that Theresa May will not allow the Parliament to vote over her Brexit deal, if such votes means bad trade terms for the UK. On Tuesday, the House of Lords will vote parliamentary veto rights. The pair is biased lower according to technical readings in the 4 hours chart, as the price was unable to advance beyond 1.2300 before finally breaking below a critical Fibonacci support, now resistance at 1.2260. In the same chart, attempts to advance have been contained by a bearish 20 SMA, whilst technical indicators have turned south after failing to overcome their mid-lines, all of which suggests that the pair may extend its decline, particularly on a break below the mentioned six-week low.
Support levels: 1.2215 1.2170 1.2230
Resistance levels: 1.2260 1.2300 1.2345
GOLD
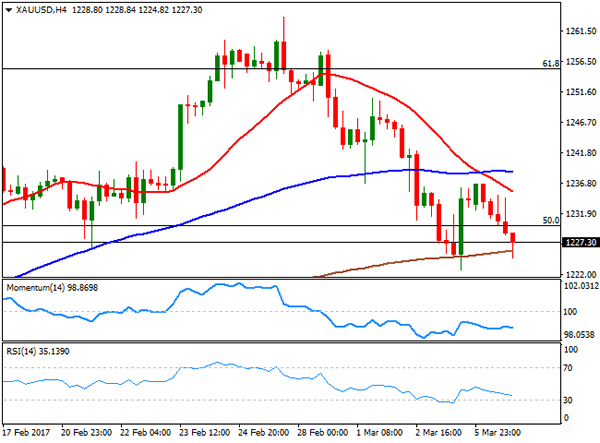
Gold prices edged lower on Monday, with spot settling around $1,227.20 a troy ounce, as the greenback regained some of its charm after Friday's setback. Expectations of a March hate hike weighed on the safe-haven metal, despite the sour tone of worldwide equities that started early Asia when North Korea launched some missiles in the Japanese sea, triggering risk aversion. The commodity neared March's low of 1,222.80, the immediate support, and the daily chart shows that the price remained contained by a horizontal 20 DMA currently at 1,239.25, whilst technical indicators entered bearish territory with nice bearish slopes. Also, the commodity is finishing the day below the 50% retracement of the post-US election decline at 1,230.00, although a break below the mentioned monthly low is required to confirm a steeper decline. Shorter term, the 4 hours chart shows that attempts to recover were rejected by a bearish 20 SMA that already crossed below the 100 SMA, whilst technical indicators head south within negative territory, in line with the longer term perspective.
Support levels1,222.80 1,210.90 1,201.15
Resistance levels: 1,230.00 1,239.25 1,245.50
WTI CRUDE
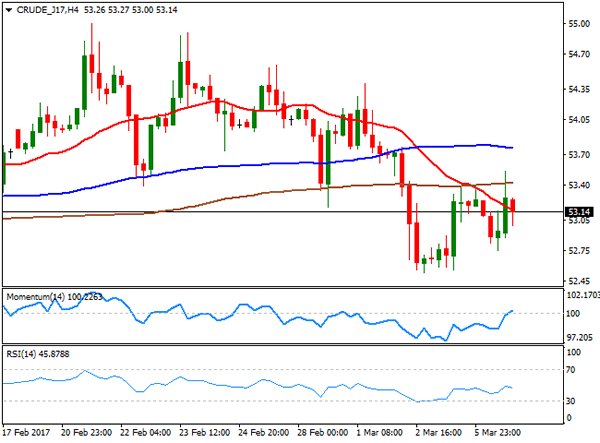
Crude oil prices saw little action at the beginning of the week, with West Texas Intermediate futures ending the day pretty much unchanged at $53.14 a troy ounce. Oil prices slipped in Asian trading on doubts about Russia's compliance with the output cut deal, although it later recovered after Iraq said that the OPEC will likely need to extend its output cut into the second half of 2017, and that the country is ready to do so if needed. From a technical point of view, the black gold presents a neutral-to-bearish stance as in the daily chart, as the price remains below its 20 DMA, while technical indicators have turned modestly lower around their mid-lines. In the same chart, however, the 100 DMA heads modestly higher around 51.60, providing a strong dynamic support in the case of further declines. In the 4 hours chart, the 20 SMA has extended its decline below the 100 and 200 SMAs, maintaining its bearish slope, whilst technical indicators have recovered from near oversold readings, losing upward strength around their mid-lines, indicating a limited upward potential.
Support levels: 52.50 51.90 51.40
Resistance levels: 53.70 54.20 54.80
DJIA
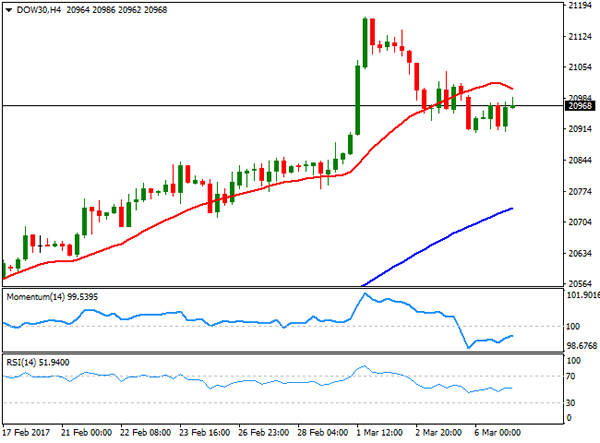
Wall Street closed in the red, with the Dow Jones Industrial Average down 51 points or 0.24%, to 20,954.34. The Nasdaq Composite lost 21 points and settled at 5,849.18, while the S&P shed 0.33%, to 2,375.31. Within the Dow, most components closed lower, with Travelers Cos leading the decline, down 1.22%, followed by JPMorgan Chase that shed 0.92%, as banks were weighed by their European counterparts. Caterpillar led gainers, adding 0.76%, followed by Exxon Mobil that gained 0.47%. US equities were undermined by Fed's hawkish rhetoric, as investors eye now a downward corrective move following the run to records seen last week. The daily chart for the Dow shows that the positive tone persists, despite the latest slide, as the index remains far above bullish moving averages, whilst the RSI indicator corrected within extreme overbought levels, bouncing now from 70 and the Momentum indicator also resuming its advance within positive territory. In the 4 hours chart, however, the benchmark develops below a modestly bearish 20 SMA, currently at 21,004, whilst the Momentum indicator aims higher within bearish territory and the RSI indicator stands pat in neutral territory.
Support levels: 20,905 20,849 20,800
Resistance levels: 21,017 21,064 21,114
FTSE 100
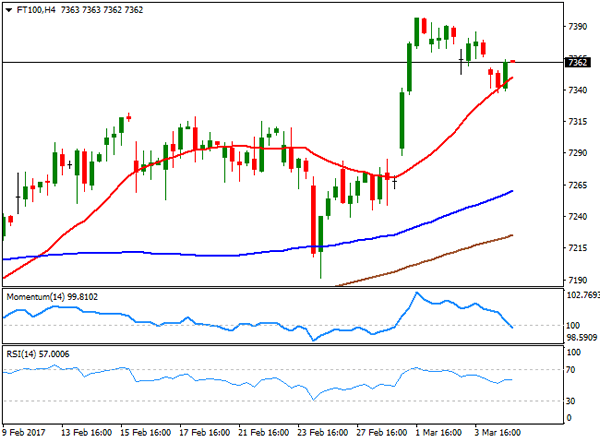
The FTSE 100 closed the day 0.33% lower at 7,350.12, weighed by a decline in commodities that dragged lower the mining sector, and despite a merge news that sent Standard Life to the top of the list, as the share added 5.68% after the Scotland’s largest insurer agreed to acquire Aberdeen Asset Management Plc, creating one of Europe’s biggest fund managers. Copper led miners lower, with Glencore topping losers' list, down by 3.47%, followed by Anglo American that shed 2.71%. The banking sector also suffered on Deutsche Bank news, with Royal Bank of Scotland ending the day 2.59% lower. From a technical point of view, the decline has been little relevant, as the index remains well above its moving averages and near record highs, whilst technical indicators have turned modestly lower, but held within positive territory. In the 4 hours chart, the index bounced from a bullish 20 SMA, but the Momentum indicator is entering negative territory, whilst the RSI hovers around 57 with no clear directional strength, indicating a limited upward potential at the time being.
Support levels: 7,352 7,320 7,287
Resistance levels: 7,397 7,420 7,450
DAX
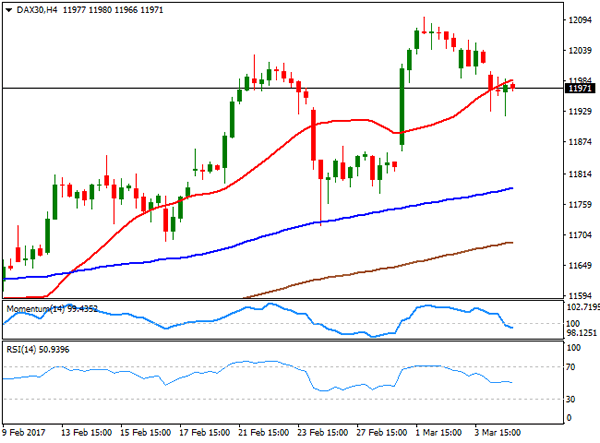
European equities closed in the red, with the German DAX down 68 points or 0.57%, to 11,958.40. Deutsche Bank led the way lower across the region, on news that the biggest European lender is facing legal action over foreign currency trading practices, from an US firm. The bank was the worst performer, shedding 3.46%, and leading the sector lower all across the region. ThyssenKrupp followed, down by 1.69%. Only eight components closed higher, with Muenchener being the best performer, up 0.61%. The daily chart for the index shows that, despite the intraday slide, it's still holding above a bullish 20 DMA at 11,838, while technical indicators retreat within positive territory with limited bearish strength. In the 4 hours chart, the index present an increased bearish potential, as it stands below a still bullish 20 SMA, whilst the Momentum indicator entered bearish territory and the RSI holds around neutral territory, indicating that further declines are likely on a break below 11,920, the daily low.
Support levels: 11,920 11,867 11,816
Resistance levels: 12,001 12,053 12,100
Trade Idea : EUR/USD – Buy at 1.0545
EUR/USD - 1.0583
Most recent candlesticks pattern : N/A
Trend : Sideways
Tenkan-Sen level : 1.0583
Kijun-Sen level : 1.0607
Ichimoku cloud top : 1.0590
Ichimoku cloud bottom : 1.0561
New strategy :
Buy at 1.0545, Target: 1.0645, Stop: 1.0510
Position : -
Target : -
Stop : -
Although the single currency retreated after rising to 1.0640 yesterday and consolidation with initial downside bias is seen for weakness to 1.0560, reckon downside would be limited to 1.0540-45 and bring another rebound later, above said resistance at 1.0640 would extend the erratic rise from 1.0493 lo for retracement of early decline to 1.0660-65 (50% Fibonacci retracement of 1.0829-1.0493) and possibly towards resistance at 1.0680, however, price should falter well below 1.0700-05 (61.8% Fibonacci retracement).
In view of this, we are looking to buy euro on dips. Below 1.0510 would abort and risk retest of 1.0493 but only break there would shift risk back to the downside and signal recent decline from 1.0829 has resumed for further selloff to 1.0470 and then towards previous support at 1.0454.

RBA Maintains Neutral Bias In March. Fed Funds Rate Hike Alleviates Pressure On Aussie Appreciation
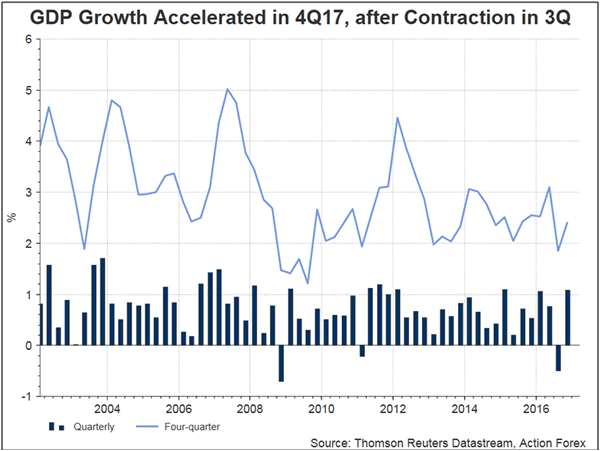
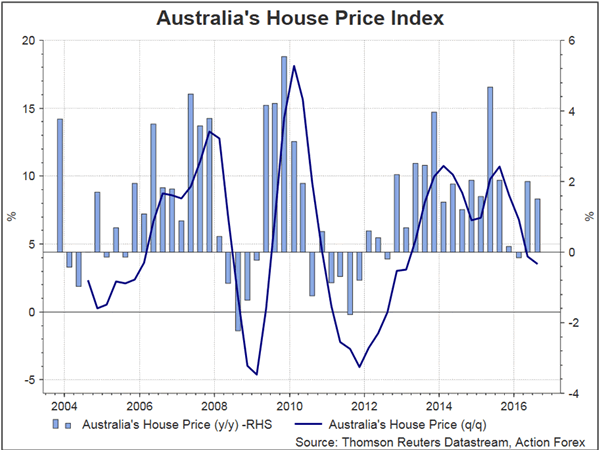
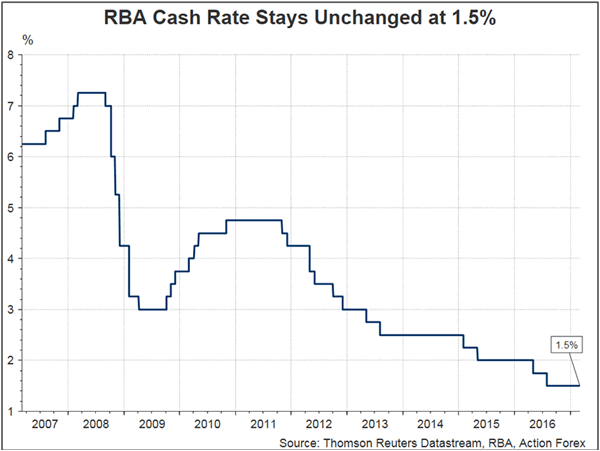
As expected, RBA left the cash rate unchanged at 1.5% in March. Despite few changes in the monetary statement, policymakers appeared more upbeat on both the global and domestic economic outlook. The major change on RBA's view was on the housing market with the central bank now seeing the conditions 'strong' and prices 'rising briskly' in some markets. On the monetary front, RBA acknowledged further rate hike is coming in the US and 'there is no longer an expectation of additional monetary easing in other major economies'. With no explicit guidance on RBA's monetary policy outlook, we see it maintain a neutral bias with future rate decision dependent on incoming data.
RBA indicated that global market conditions have 'continued to improve over recent months' and 'business and consumer confidence have both picked up'. It also remained cautiously optimistic over China's outlook noting that the country's 'growth is being supported by higher spending on infrastructure and property construction. This composition of growth and the rapid increase in borrowing mean that the medium-term risks to Chinese growth remain'. The central bank noted that higher commodity prices have been 'providing a significant boost to Australia's national income'.
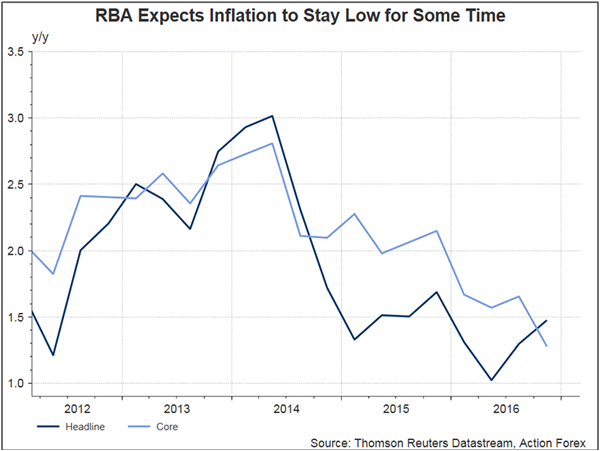
Domestically, policymakers acknowledged that 'most measures of business and consumer confidence are at, or above, average', whilst 'consumption growth was stronger towards the end of the year, although growth in household income remains low'. The statement, however, added that 'with growth in labor costs remaining subdued, underlying inflation is likely to stay low for some time'. On the housing market, RBA noted that the conditions 'vary considerably around the country'. In some markets, conditions are strong and prices are rising briskly. In other markets, prices are declining. In the eastern capital cities, a considerable additional supply of apartments is scheduled to come on stream over the next couple of years. Growth in rents is the slowest for two decades. Borrowing for housing by investors has picked up over recent months. Supervisory measures have contributed to some strengthening of lending standards.
On the monetary policy front, RBA mentioned that the Fed funds rate is 'expected to increase further' and it is less likely for other major central banks to add more monetary policy easing. We believe further normalization on the US monetary policy should help alleviate concerns over the strength in Australian dollar. For Australia, the central bank judged that the current monetary policy remains appropriate and is 'consistent with sustainable growth in the economy and achieving the inflation target over time'.
Trade Idea : USD/JPY – Sell at 114.50
USD/JPY - 113.96
Most recent candlesticks pattern : N/A
Trend : Near term up
Tenkan-Sen level : 113.97
Kijun-Sen level : 113.83
Ichimoku cloud top : 114.25
Ichimoku cloud bottom : 114.08
Original strategy :
Sell at 114.35, Target: 113.35, Stop: 114.70
Position : -
Target : -
Stop : -
New strategy :
Sell at 114.50, Target: 113.35, Stop: 114.80
Position : -
Target : -
Stop : -
As the greenback recovered after finding support at 113.56 yesterday, suggesting consolidation with initial upside bias would be seen and corrective bounce to 114.30-35 cannot be ruled out, however, if our view that a temporary top formed at 114.75 last week is correct, upside should be limited to 114.50-55 and bring another decline later, below said support at 113.56 would bring retracement of recent rise to 113.20-25 (50% Fibonacci retracement of 111.69-114.75), however, downside would be limited to 113.00 and 112.84-86 (previous resistance and 61.8% Fibonacci retracement), bring rebound later.
In view of this, we are looking to sell dollar on recovery for such move as 114.50 should limit upside, bring another decline. Only above said resistance at 114.75 would abort and signal the rise from 111.69 has resumed and extend gain to 114.96 (previous resistance) but price should falter well below resistance at 115.38.

(RBA) Statement by Philip Lowe, Governor: Monetary Policy Decision
At its meeting today, the Board decided to leave the cash rate unchanged at 1.50 per cent.
Conditions in the global economy have continued to improve over recent months. Business and consumer confidence have both picked up. Above-trend growth is expected in a number of advanced economies, although uncertainties remain. In China, growth is being supported by higher spending on infrastructure and property construction. This composition of growth and the rapid increase in borrowing mean that the medium-term risks to Chinese growth remain. The improvement in the global economy has contributed to higher commodity prices, which are providing a significant boost to Australia's national income.
Headline inflation rates have moved higher in most countries, partly reflecting the higher commodity prices. Long-term bond yields are higher than last year, although in a historical context they remain low. Interest rates are expected to increase further in the United States and there is no longer an expectation of additional monetary easing in other major economies. Financial markets have been functioning effectively and stock markets have mostly risen.
The Australian economy is continuing its transition following the end of the mining investment boom, expanding by around 2½ per cent in 2016. Exports have risen strongly and non-mining business investment has risen over the past year. Most measures of business and consumer confidence are at, or above, average. Consumption growth was stronger towards the end of the year, although growth in household income remains low.
The outlook continues to be supported by the low level of interest rates. Financial institutions remain in a good position to lend. The depreciation of the exchange rate since 2013 has also assisted the economy in its transition following the mining investment boom. An appreciating exchange rate would complicate this adjustment.
Labour market indicators continue to be mixed and there is considerable variation in employment outcomes across the country. The unemployment rate has been steady at around 5¾ per cent over the past year, with employment growth concentrated in part-time jobs. The forward-looking indicators point to continued expansion in employment over the period ahead.
Inflation remains quite low. With growth in labour costs remaining subdued, underlying inflation is likely to stay low for some time. Headline inflation is expected to pick up over the course of 2017 to be above 2 per cent, with the rise in underlying inflation expected to be a bit more gradual.
Conditions in the housing market vary considerably around the country. In some markets, conditions are strong and prices are rising briskly. In other markets, prices are declining. In the eastern capital cities, a considerable additional supply of apartments is scheduled to come on stream over the next couple of years. Growth in rents is the slowest for two decades. Borrowing for housing by investors has picked up over recent months. Supervisory measures have contributed to some strengthening of lending standards.
Taking account of the available information the Board judged that holding the stance of policy unchanged at this meeting would be consistent with sustainable growth in the economy and achieving the inflation target over time.
Is It Time For Gold To Resume Its Rally?
Key Points:
- Reaching a turning point in the Elliot wave.
- EMA bias remains highly bullish.
- Rate hike fears could hinder further gains.
Sentiment should be returning to the gold markets this week as the metal looks as though it’s ready to begin tracking higher once more. Specifically, we seem to have reached another turning point in the long-term pattern that could signal that we are about to see another push towards the elusive 1300.00 handle.
First and foremost, we should probably define exactly which long-term pattern is likely shaping up for the metal. Looking at the price action during the recent upswing, there is a fairly convincing Elliot wave becoming apparent, even if we would ideally like to see that third leg be slightly longer prior to retracing. Regardless, as a result of the wave, we are now expecting to see the final leg take place which could mean some rather substantial gains are due to be realised.
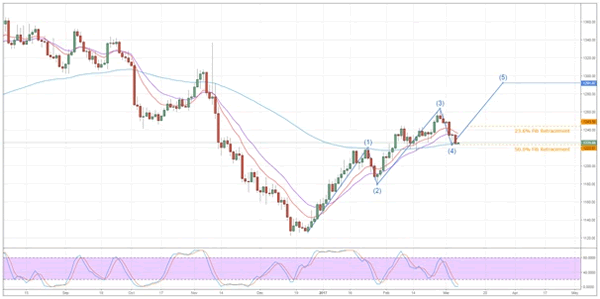
Indeed, this imminent reversal seems to have quite a bit of support from a technical perspective as a number of measures are suggestive of a move to the upside. Firstly, we have the 100 day EMA acting as a source of dynamic support which is already doing an excellent job of halting further slides lower. In addition to this, the 12 and 20 day averages are in a bullish configuration despite the near-term downtrend.
Setting aside the moving averages, the movement of the Stochastics reading into oversold territory will be providing some solid buying pressure. Combined with the other factors mentioned above, this should see the bears begin to retreat which could give the bulls the opening needed to wrest control of gold back from their counterparts.
From a fundamental perspective, we have a handful of risk events on offer but the US employment data will likely be taking centre stage. More precisely, we have both the ADP and Official NFP numbers as well as the Unemployment Rate due out this week and these could generate some significant movement. As one would expect, any notable weakness in the results could set a fire under the metal once again and this would help the technical forecast to be realised in full.
Ultimately, we can’t escape the threat of a US rate hike that currently looms of much of the market. As a result, we could find any gains to be fairly hard won and prone to being eroded as the FOMC meeting draws nearer. Alternatively, this could provide a good litmus test for just how resilient the metal’s rally is. If gold continues to rise, we could infer that fears over the current US administration trump the influence of the Fed’s monetary policy.