

Sample Category Title
Daily Technical Analysis
EURUSD
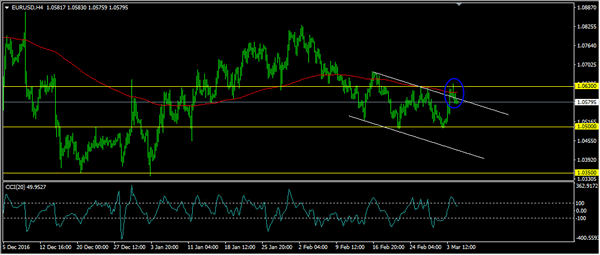
The EURUSD attempted to push higher yesterday topped at 1.0640 but closed lower at 1.0581. As you can see on my H4 chart below price is moving back inside the bearish channel, keeps the bearish phase intact. The bias is neutral in nearest term probably with a little bearish bias testing 1.0500 support area. On the upside, 1.0630/50 region remains a key resistance and good place to sell with a tight stop loss as a clear break and daily close above that area could trigger further bullish pressure testing 1.0700 – 1.0750 region. Overall I remain neutral.
GBPUSD
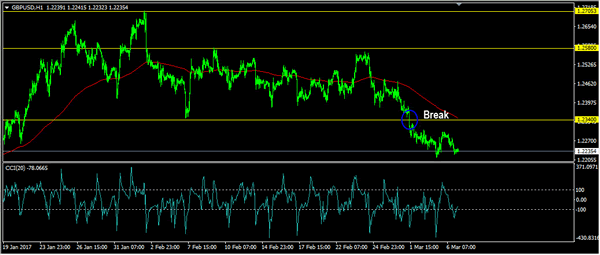
The GBPUSD had a moderate bearish momentum yesterday bottomed at 1.2224. The bias is bearish in nearest term testing 1.2150 region. Immediate resistance is seen around 1.2275. A clear break above that area could lead price to neutral zone in nearest term testing 1.2340 resistance area which remains a good place to sell with a tight stop loss. Overall I remain neutral.
USDJPY
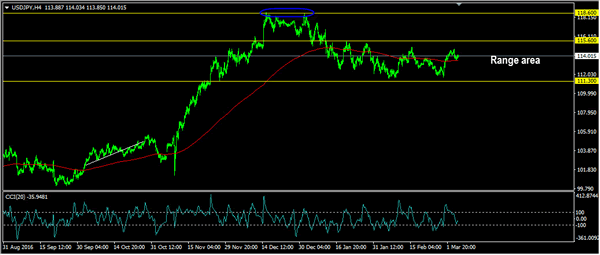
The USDJPY was indecisive yesterday. The bias remains neutral in nearest term. Overall I still prefer a bearish scenario but as you can see on my H4 chart below price has been moving sideways in a range area. Immediate support is seen around 113.50. A clear break and daily close below that area could trigger further bearish pressure testing 113.00 – 112.50 region. Immediate resistance is seen around 114.70 but key resistance remains at 115.60 which remains a good place to sell.
USDCHF
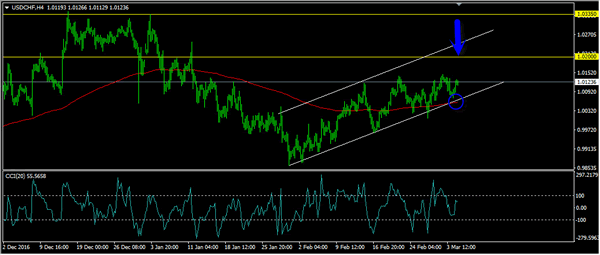
The USDCHF had a moderate bullish momentum yesterday topped at 1.0129. The bias is bullish in nearest term testing 1.0200 area which is a good place to sell with a tight stop loss. Immediate support is seen around 1.0070 and the lower line of the bullish channel as you can see on my H4 chart below. A clear break and daily close below the bullish channel would end the current bullish phase. Overall I remain neutral.
Daily Technical Outlook And Review
A note on lower timeframe confirming price action...
Waiting for lower timeframe confirmation is our main tool to confirm strength within higher timeframe zones, and has really been the key to our trading success. It takes a little time to understand the subtle nuances, however, as each trade is never the same, but once you master the rhythm so to speak, you will be saved from countless unnecessary losing trades. The following is a list of what we look for:
- A break/retest of supply or demand dependent on which way you're trading.
- A trendline break/retest.
- Buying/selling tails ... essentially we look for a cluster of very obvious spikes off of lower timeframe support and resistance levels within the higher timeframe zone.
- Candlestick patterns. We tend to only stick with pin bars and engulfing bars as these have proven to be the most effective.
EUR/USD
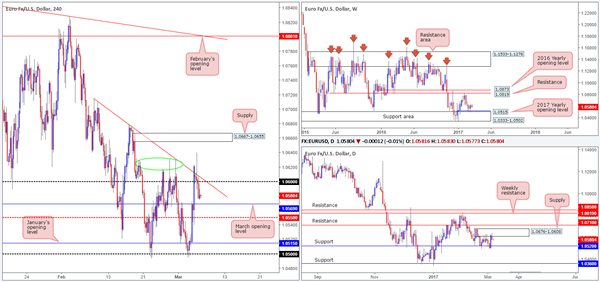
In recent trading, price failed to sustain gains beyond both the H4 trendline resistance extended from the high 1.0714 and the 1.06 handle, and as a result, pushed down to a low of 1.0574 on the day. With the H4 candles now seen trading just ahead of the March opening level at 1.0569, where does one go from here? Well, owing to daily action rebounding from a daily supply at 1.0676-1.0608 yesterday, and weekly price recently bouncing from the top edge of a major weekly support area at 1.0333-1.0502 (that's bolstered by the 2017 yearly opening level at 1.0515), there's certainly some conflict seen here on the higher timeframes!
Our suggestions: On account of the above notes, the only area that really jumps out to us this morning is seen around the 1.05/1.0520 area. The zone comprises of: a round number at 1.05, January's opening level at 1.0515, daily support at 1.0520 as well as being further reinforced by the weekly support area at 1.0333-1.0502. However, seeing as how the 1.05/1.0520 zone has already been tested twice, we would not be comfortable trading from here without additional lower-timeframe confirmation (see the top of this report).
Data points to consider: US trade balance at 1.30pm GMT.
Levels to watch/live orders:
- Buys: 1.05/1.0520 ([wait for a lower-timeframe signal to form before looking to pull the trigger] stop loss: dependent on where one confirms the zone).
- Sells: Flat (stop loss: N/A).
GBP/USD
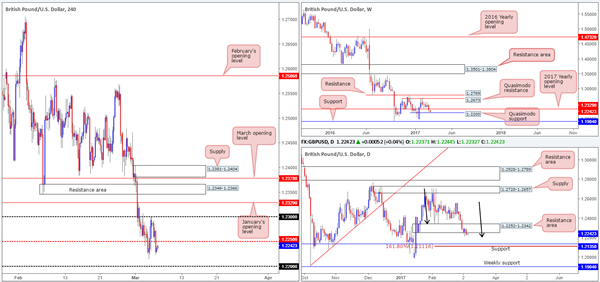
Climbing down from the top this morning, we can see that the weekly chart shows price trading within touching distance of the weekly Quasimodo support drawn from 1.22. In the event of a bounce being seen from here, the next upside hurdle in the firing range is the 2017 yearly opening level at 1.2329. Scooting down to the daily chart, daily demand at 1.2252-1.2342 (now acting resistance area) was taken out during the course of yesterday's segment. This has, as you can probably see, potentially opened up the path south down to daily support coming in at 1.2135, which happens to converge nicely with a H4 AB=CD (see black arrows) Fib 161.8% ext. at 1.2111.
Stepping across to the H4 candles, the H4 mid-way level at 1.2250 was wiped out during the early hours of yesterday's US segment. Below this base sits the psychological handle 1.22, which of course is also a weekly Quasimodo support! Looking to the left of current price from here, there is unfortunately very little H4 structure seen bolstering the 1.22 neighborhood. Couple this with daily price now open to test the daily support mentioned above at 1.2135, we feel 1.22 would be a risky place to simply place a pending buy order.
Our suggestions: In order to trade from 1.22, we would strongly recommend waiting for a lower-timeframe confirming signal to take shape (see the top of this report). Assuming that 1.22 is engulfed, all eyes will be on the aforementioned daily support. This too, would require additional lower-timeframe confirmation to trade, since there's also very little supporting structure seen to the left of price on the H4 scale.
Data points to consider: US trade balance at 1.30pm GMT.
Levels to watch/live orders:
- Buys: 1.22 mark ([wait for a lower-timeframe signal to form before looking to pull the trigger] stop loss: dependent on where one confirms the zone). 1.2135 region ([wait for a lower-timeframe signal to form before looking to pull the trigger] stop loss: dependent on where one confirms the zone).
- Sells: Flat (stop loss: N/A).
AUD/USD
For those who read yesterday's report you may recall that our desk suggested looking for potential lower-timeframe shorting opportunities from the 0.7609/0.76 region (daily resistance/round number). Well done to any of our readers who managed to lock down a position from here as price reacted beautifully and recently crossed swords with the first take-profit target: February's opening base at 0.7577.
As price is now effectively capped between 0.7609/0.76-0.7577, where does one go from here? Given that there is room to extend lower from the daily resistance down to a daily demand base coming in at 0.7511-0.7543, alongside weekly action also showing room to push lower down to a weekly support area at 0.7524-0.7450, our team remains biased to the downside at the moment.
Our suggestions: Based on the above, we see two possible trade scenarios going forward:
Wait and see if price retests the 0.7609/0.76 region. Assuming that this comes to fruition and a lower time-frame confirming signal is seen (see the top of this report) we would look to short from here again.
In the event that price fails to reach 0.7609/0.76 and closes below February's opening level at 0.7577, we would look to short any retest seen at this number assuming that it's backed with a lower-timeframe confirming signal, targeting the H4 mid-way point 0.7550 (positioned directly above the daily demand at 0.7511-0.7543).
Data points to consider: Australian monetary policy meeting minutes at 3.30am. US trade balance at 1.30pm GMT.

Levels to watch/live orders:
- Buys: Flat (stop loss: N/A).
- Sells: 0.7609/0.76 region ([wait for a lower-timeframe signal to form before looking to pull the trigger] stop loss: dependent on where one confirms the zone). Watch for price to engulf 0.7577 and then look to trade any retest seen thereafter (waiting for a lower-timeframe confirming signal to form following the retest is advised] stop loss: dependent on where one confirms the level).
USD/JPY:
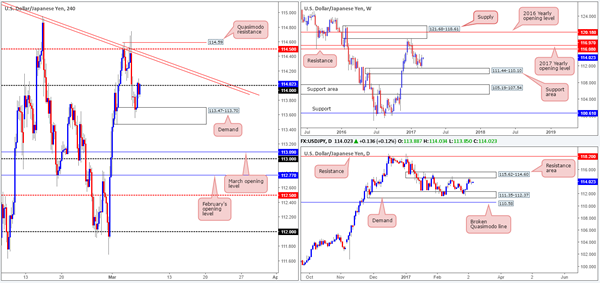
The USD/JPY, as you can see, gapped south at the open on Sunday but failed to generate much follow-through selling as the pair soon after touched gloves with a H4 demand area coming in at 113.47-113.70. As can be seen from the H4 chart, price ended the day pretty much unchanged around the underside of the 114 handle, consequently forming a daily indecision candle.
With weekly action recently printing a strong-looking weekly bullish engulfing candle, and daily movement seen loitering around the underside of a daily resistance area at 115.62-114.60, higher-timeframe technicals are somewhat mixed at the moment.
Our suggestions: While a H4 close above 114 would be considered a bullish signal, and considering that you'd be trading in line with weekly flow, price may very well reach the nearby H4 trendline resistance extended from the high 115.62, followed closely by the H4 mid-way resistance at 114.50. However, this would also place one against daily sellers! It's just not worth the risk, in our opinion. The same goes for shorting this piece. A short would obviously place one in line with daily flow, but against weekly direction!
Therefore, at least for now, we will remain on the sidelines.
Data points to consider: US trade balance at 1.30pm GMT.
Levels to watch/live orders:
- Buys: Flat (stop loss: N/A).
- Sells: Flat (stop loss: N/A).
USD/CAD
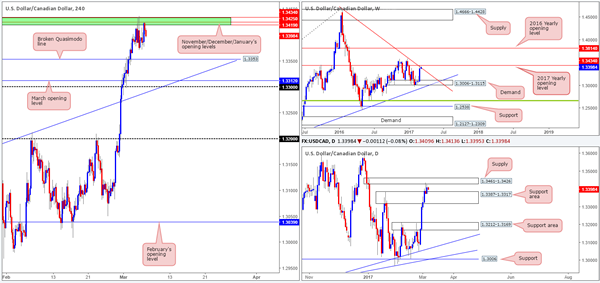
As can be seen from the H4 chart this morning, upside remains capped at 1.3434/1.3419 (November, December and January's opening levels). Also of note here is the converging weekly trendline resistance extended from the high 1.4689 and daily supply coming in at 1.3461-1.3426. Assuming that the bears remain in the driving seat here, the next downside target on the H4 scale is a broken Quasimodo line at 1.3353. While this sounds like a sellers' paradise, it may be worth noting that there is a daily support area seen in play at 1.3387-1.3317 so the bulls still have a hand in this fight.
Our suggestions: If one is able to pin down a lower-timeframe short position (see the top of this report) from the above noted monthly levels, one could consider shorting from here and target the above said broken H4 Quasimodo level at 1.3353. In regards to buying this unit, we would advise against this given the opposing structures seen on the weekly and daily timeframes.
Data points to consider: US trade balance at 1.30pm. Canadian trade balance at 1.30pm GMT.
Levels to watch/live orders:
- Buys: Flat (stop loss: N/A).
- Sells: 1.3434/1.3419 ([wait for a lower-timeframe signal to form before looking to pull the trigger] stop loss: dependent on where one confirms the zone).
USD/CHF:
Kicking this morning's report off with a look at the weekly timeframe, we can see that the bulls have a slight edge this morning and may end the week connecting with the 2017 yearly opening level at 1.0175. Looking down to the daily candles, there's a nearby daily supply seen at 1.0248-1.0168, which happens to encapsulate the aforementioned 2017 yearly opening line.
Despite H4 price being capped by a H4 resistance at 1.0135, our team still has their beady little eye on the 1.02/1.0170 (yellow zone) neighborhood for shorts. The area comprises of the following converging structures: both December and January's opening levels at 1.0170/1.0175, a H4 trendline resistance pegged from the high 1.0118, a H4 Quasimodo resistance at 1.0197, a 1.02 psychological handle and let's not forget that all of this is seen housed within the daily supply zone mentioned above 1.0248-1.0168.
Our suggestions: In light of this confluence, our team will, dependent on the time of day, look to sell from the 1.0175 neighborhood, with stops placed a few pips above 1.02.
Data points to consider: US trade balance at 1.30pm GMT.
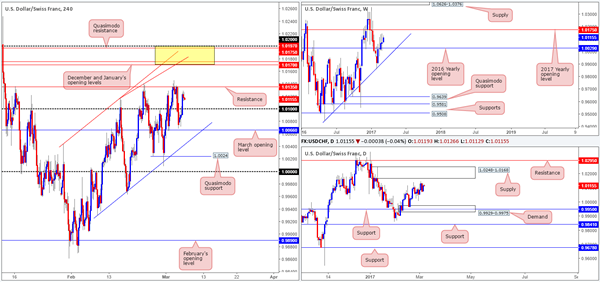
Levels to watch/live orders:
- Buys: Flat (stop loss: N/A).
- Sells: 1.0175 region ([an area one could possibly trade at market] stop loss: 1.0205).
DOW 30
The equity market took on a more sober approach on Monday, ranging a mere 86 points on the day. In light of this, much of the following will report will echo thoughts put forward in yesterday's analysis…
The US equity market continued to climb north last week, registering its fourth consecutive weekly gain! With equities now trading at record highs, where do we go from here? Well, given that there is absolutely no weekly resistance levels in sight, the best we can do for the time being is continue looking to ‘buy the dips'. The closest higher-timeframe area can be seen at 20714-20821: a daily demand zone.
Our suggestions: We still have an eyeball on the area seen between the two H4 demands: 20769-20801/ 20837-20869, which happens to be positioned within the walls of the aforementioned daily demand zone! The interesting thing here is that in between these two H4 barriers (the yellow zone) is March's opening level at 20824 and a possible H4 AB=CD completion point at 20813 (see black arrows). To that end, should we see price strike the yellow zone today/this week, our team would, assuming that a reasonably sized H4 bull candle took shape, look to buy from here with stops either placed below the trigger candle or below the H4 demand at 20769-20801.
Data points to consider: US trade balance at 1.30pm GMT.
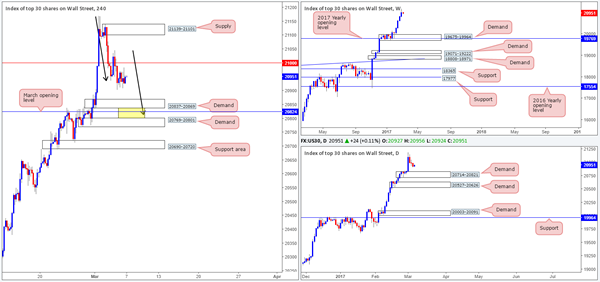
Levels to watch/live orders:
- Buys: 20801/20837 region ([wait for a reasonably sized H4 bull candle to form before looking to pull trigger here] stop loss: ideally beyond the trigger candle).
- Sells: Flat (stop loss: N/A).
GOLD
Across the board, we saw the dollar advance yesterday which helped the yellow metal catch an offer from the underside of the H4 resistance area at 1235.7-1238.1. To our way of seeing things, the next support target on this scale to have an eyeball on is the H4 Quasimodo support drawn in at 1221.7.
Over on the daily chart, it's clear that the bulls are struggling to hold ground around the daily support area seen at 1232.9-1224.5, given yesterday's full-bodied daily bearish candle! Looking up on the weekly chart, recent action chalked up a beautiful-looking weekly bearish engulfing candle around the weekly resistance line of 1241.2.
Our suggestions: However, despite both the weekly and daily timeframes indicating further selling may be on the cards, selling into a H4 Quasimodo support is not something we'd be comfortable with! Nevertheless, in the event that a H4 close beyond this line is seen and is followed up with a retest as well as a lower-timeframe sell signal (see the top of this report), we would look to short bullion, targeting February's opening line at 1211.5 as an initial first take-profit target.
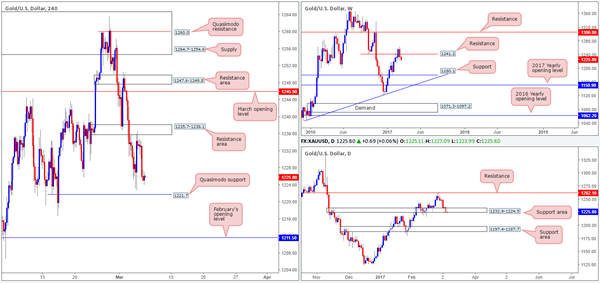
Levels to watch/live orders:
- Buys: Flat (stop loss: N/A).
- Sells: Watch for price to engulf 1221.7 and then look to trade any retest seen thereafter (waiting for a lower-timeframe confirming signal to form following the retest is advised] stop loss: dependent on where one confirms the level).
European Open Briefing
Global Markets:
- Asian stock markets: Nikkei down 0.20 %, Shanghai Composite lost 0.10 %, Hang Seng and ASX 200 both rose 0.30 %
- Commodities: Gold at $1226 (+0.05 %), Silver at $17.78 (+0.05 %), WTI Oil at $53.20 (-0.05 %), Brent Oil at $55.95 (-0.10 %)
- Rates: US 10-year yield at 2.49, UK 10-year yield at 1.22, German 10-year yield at 0.34
News & Data:
- Australia AIG Construction Index (Feb): 53.1 (prev +0.7 to 47.7)
- Japan Foreign Reserves (USD) (Feb): 1232.3bn (prev 1231.6bn)
- UK BRC Retail Sales Monitor like-for-like (YoY) (3m to Feb): -0.40% (est -0.20%, prev -0.60%)
- PBOC sets USD/CNY mid-point today at 6.8957 (vs. yesterday at 6.8790)
- RBA Rate Decision:
- RBA holds Cash Rate at 1.50%, as expected
- Rising Australian dollar could complicate economic transition
- Global economic conditions have improved over recent months
- Unchanged policy consistent with growth, inflation targets
- Labour indicators have been mixed
- Higher commodity prices have supported a rise in Australia's national income
- Headline inflation expected to pick up over the course of 2017
- House prices rising briskly in some markets
- US rates expected to rise further, no longer expectations of further easing in other major economies
- Australian economy continuing to transition after mining boom
Markets Update:
The main event overnight was the RBA rate decision. The central bank left rates unchanged as expected. In its statement, it acknowledged that global economic conditions have improved. Further, the RBA saw inflation rising during the course of the year, though labour conditions have been mixed.
Overall, it was a neutral statement and signalled that the RBA will remain on hold in the near-term. This was in line with expectations.
The Australian Dollar rose nevertheless, on the fact that there were no dovish comments. AUD/USD rallied from 0.7590 to a high of 0.7630 so far.
Price action in the other major pairs was relatively quiet. NZD/USD followed the AUD higher, rising from 0.6980 to 0.7020. The Euro, Yen and Pound are almost unchanged on the day against the Dollar.
Upcoming Events:
- 07:00 GMT – German Factory Orders08:30 GMT – UK Halifax House Price Index
- 10:00 GMT – Euro Zone GDP
- 13:30 GMT – US Trade Balance
- 13:30 GMT – Canadian Trade Balance
- 15:00 GMT – Canadian Ivey PMI
- 23:50 GMT – Japanese GDP
- 23:50 GMT – Japanese Current Account
Market Morning Briefing
STOCKS
Dow (20954.34, -0.24%) and Dax (11958.40, -0.57%) closed a little lower yesterday. Markets seem to be quiet just now allowing some correction in the indices after the recent rally. As mentioned yesterday, Dow may move towards 20750 while Dax could test 11800 on the downside before seeing an immediate bounce back.
Nikkei (19345.49, -0.17%) has not been able to sustain levels above 19600 and while below 19600, we may expect a test of 19200-19000 levels in the near term.
Shanghai (3233.72) is almost stable near current levels. It could try to inch up towards 3250 and higher in the coming sessions. We do not expect a break below 3200 in the near term.
Nifty (8963.45, +0.74%) is in a consolidation mode within the 8800-9000 region and unless we see a break on either side, it would be difficult to get any directional clarity just now. We prefer a corrective fall from current levels before it continues to rally further but lack of immediate rejection may indicate that we need to wait for confirmation from the prices.
COMMODITIES
Gold (1226) is trading within its sideways range of 1212-1275. The bias will remain bearish as long it is trading below 1247-50.
Silver (17.72)also moved lower but somehow managed to hold its upward trend line support of 17.62. A close below 17.45 could be trend reversal from bullish to sideways.
Copper (2.64) looks weak due to its failure to close above 2.73. It is still holding its upward trend line support at 2.63 since October 16, but the bullish momentum is becoming weak. A close below 2.63-60 could open up lower levels of 2.53 and 2.44 respectively.
Brent (55.60) and WTI (53.14) both are trading within their narrow ranges of 54-58 and 52-55 with no directional bias.
FOREX
The RBA decision will be released today though no change is expected, same as the ECB meet on Thursday, 9th March'17. Almost all the currencies are mute with the volatility collapsing.
Dollar Index (101.66) is trading quietly in the range of 100.70-102.25 in line with our expectations and may continue that for the rest of the week.
Euro (1.0607), taking cue from the Dollar, is trading sideways too and the range of 1.0500-1.0630 may remain intact even after the ECB meet on 9th Mar'17.
Dollar-Yen (113.97) hasn't moved much in the last session and the probability of horizontal trade in the range of 113-115 for the week looks much stronger now. The stability in EURJPY (120.63) in the near term may be beneficial for both Euro and Yen but a break above 121.25-35 may take Euro to 1.0630-50 levels once again.
Pound (1.2241) has been consolidating in the narrow range of 1.22-23 for the last 3 sessions as expected but the downside targets of 1.2100-1.2085 remain unchanged.
Aussie (0.7592) remains almost unchanged as it waits for the RBA rate review conclusion. The status quo is expected to be maintained but technically, the currency may test the near term support zone 0.7520-00 before declining further to lower levels of 0.7450.
Dollar-Rupee (66.72) ended the session with a loss in a very grinding manner. The major support 66.50 may be tested in the next couple of sessions but no major movement is expected with 66.90-67.00 capping the upside for the week.
INTEREST RATES
The US 10-5Yr yield spread (0.48%) has bounced from channel support and could move higher in the near term towards 0.50%.
The US yields have moved up. The 5Yr (2.02%), 10YR (2.50%) and the 30Yr (3.10%) are trading higher as compared to previous levels of 2%, 2.47% and 3.06% respectively. The 30YR is exactly at resistance levels and if it breaks on the upside, would indicate further bullishness which could pull up the shorter term yields too.
The US-Japan (2.43%) yield differential has been moving up in the past 2-sessions and if it continues to move higher, it could indicate some more weakness in the Japanese Yen.
The UK 10-5Yr spread (0.61%) has collapsed from levels near 0.93% due to increase in the 5Yr (0.60%) yields must faster and sharper than the 10YR and 20YR yields. The 10-5YR spread may bounce back from current levels to move up towards 0.705 in the next few sessions.
USDJPY – Remains Vulnerable But With Caution
USDJPY - The pair still faces downside pressure though closing higher the past week. On the downside, support comes in at the 114.00 level where a break if seen will aim at the 113.50 level. A cut through here will turn focus to the 113.00 level and possibly lower towards the 112.50 level. Its daily RSI is bearish and pointing lower suggesting further weakness. On the upside, resistance resides at the 114.50 level. Further out, we envisage a possible move towards the 115.00 level. Further out, resistance resides at the 115.50 level with a turn above here aiming at the 116.00 level. On the whole, USDJPY looks to weaken in the nearer term.
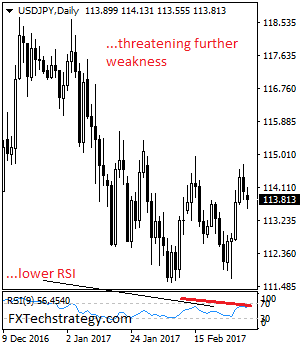
The USD/JPY Narrative Continues
The USD/JPY trade narrative continues on the blog today.
After having bounced out of the daily support zone (in the chart on that last blog I've linked to above), we got the following short term retest for a nice long trade with tight risk:reward:
USD/JPY Hourly:
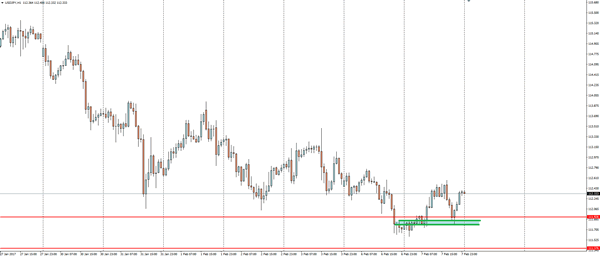
'Find your levels, trade your levels. It's always the same!'
(I had to include that last little quote which I had published in the previous post because once again it is proven so true!)
But now with the pair pushing into the first spot of swing high resistance, we have a decision to make:
USD/JPY Daily:
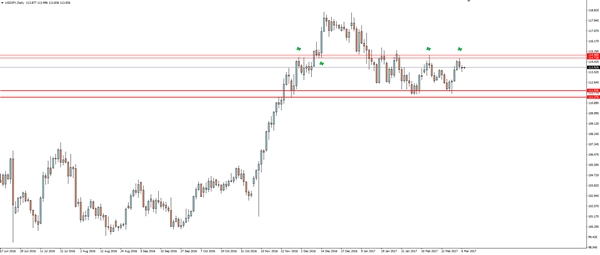
Do we continue trading the pair in the overall daily direction which I would still very much classify as bullish?
Or do we make a smaller, counter-trend play at the swing highs?
French Political Risk Simmers Again
French Political Risk Simmers Again
Risk off sentiment has crept back to the fore as the markets are in a sulk as dealer attempt to decipher the Fed rate trajectory beyond March while shifting their focus to geopolitical concerns as the French election risk continues to simmer. Alain Juppe, seen as a possible replacement for the scandal hobbled conservative candidate Francois Fillon announced; he has no intention to run in the presidential race. Juppe was viewed as more conservative than Fillon and would appeal to a wider element of France’s conservatives and diminishes the odds of an ultra right wing Le Pen victory
Australian Dollar
Not lots of anticipation regarding today’s Reserve Bank of Australia meeting with the futures curve as flat as a pancake, indicating zero expectations on the rate front. With the RBA widely expected to leave rates unchanged in the face of mounting household debt, a change in guidance is equally unlikely. Steady as she goes should be the course directed from the RBA captain.The tail risk for the event is certainly a Hawkish one if any.
AS with most G10 currencies overnight, the Aussie spent most of Monday consolidating as the various market themes and drivers continue to unfold. While Fed and Fiscal continue to dominate the early headlines, ECB and EU risk are starting to pick up steam again. With the later weighing on equity markets, the Aussie simply does not trade well at the slightest hint of risk aversion.
Japanese Yen
With the markets all in on a March rate hike was not ample support to push the market through the critical 115.00, dealers quickly took profit, and the dollar has failed to pick up any real momentum since.And with equity markets looking a bit worse for wear after the recent French election headlines the key 115 seems too far of a reach at this time unless equities reverse significantly higher.
Euro
While election headline risk had abated somewhat, I’m convinced there remains considerable political risk over the coming months but for now with EU interest rate expectations rising, and 1.05 level holding very firm, the EURUSD is not the markets choice to express a long dollar bias. But on the flip side, it’s hard to get excited about the EURO despite the improving macro & inflation trends, at least until the ECB clearly signals a shift in policy. But given the overall balance of risk facing Europe, we should not expect that change to occur at Thursday’s ECB meeting
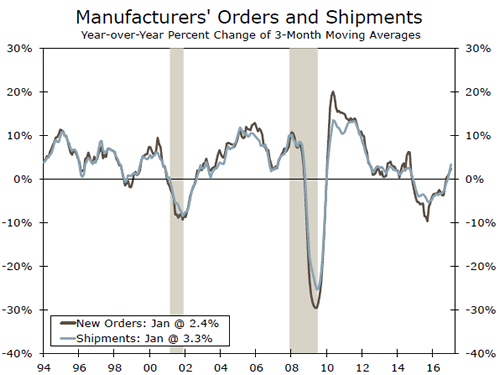
Factory Orders Climb Higher in January
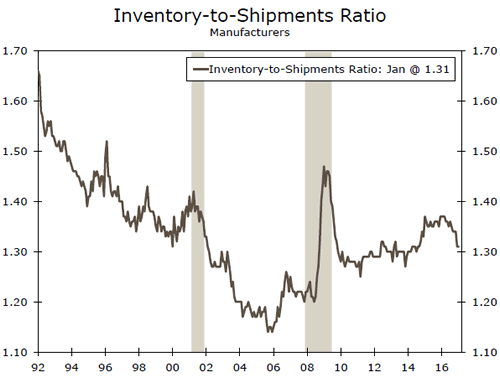
Factory orders rose 1.2 percent to start 2017. On balance, the hard data in the manufacturing sector continue to show improvement, although the pace has been slower than sentiment indicators alone would indicate.
Factory Sector Firming
Factory orders rose 1.2 percent in January, boosted by sizable jumps in the notoriously volatile aircraft components for both defense and nondefense.
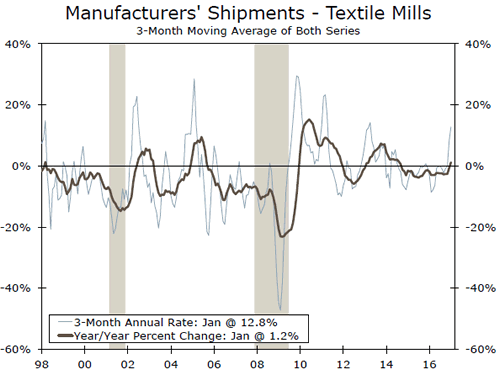
Nondurable shipments rose 0.4 percent, led by growth in textile mills, apparel and petroleum and coal products. Input price pressures are building in the factory sector and have likely helped boost growth in this nominally reported indicator.
Core Orders Signal Stronger Business Investment
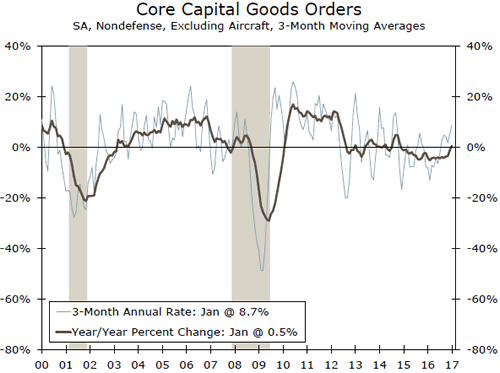
Core capital goods orders fell 0.1 percent, a smaller decline than indicated in the advanced report, but this improvement was largely offset by downward revisions to December's reading.
Through the monthly volatility, core capital goods orders are up 8.7 percent on a three-month average annualized basis. This is the fastest pace since 2014 and corroborates some of the rising sentiment seen in other indicators, such as ISM and NFIB.
Trade Idea Wrap-up: USD/CHF – Stand aside
USD/CHF - 1.0099
Most recent candlesticks pattern : N/A
Trend : Sideways
Tenkan-Sen level : 1.0089
Kijun-Sen level : 1.0104
Ichimoku cloud top : 1.0118
Ichimoku cloud bottom : 1.0106
New strategy :
Stand aside
Position : -
Target : -
Stop : -
As the greenback ran into resistance at 1.0135 and has retreated again after faltering below resistance at 1.0146, suggesting consolidation below this level would be seen and weakness to 1.0060-65 (61.8% Fibonacci retracement of 1.0009-1.0146 and previous support), however, as broad outlook remains consolidative, reckon downside would be limited to 1.0035-40 and price should stay well above support at 1.0009, bring rebound later.
On the upside, expect recovery to be limited to 1.0120 and price should falter well below resistance at 1.0146, bring retreat later. Only above said resistance at 1.0146 would extend recent erratic rise from 0.9661 to 1.0170-80 but reckon 1.0200 would hold from here.

Trade Idea Wrap-up: GBP/USD – Buy at 1.2220
GBP/USD - 1.2258
Most recent candlesticks pattern : N/A
Trend : Near term down
Tenkan-Sen level : 1.2271
Kijun-Sen level : 1.2267
Ichimoku cloud top : 1.2294
Ichimoku cloud bottom : 1.2251
Original strategy :
Buy at 1.2220, Target: 1.2340, Stop: 1.2185
Position : -
Target : -
Stop : -
New strategy :
Buy at 1.2220, Target: 1.2340, Stop: 1.2185
Position : -
Target : -
Stop : -
Although cable dropped to as low as 1.2214 late last week, the subsequent rebound suggests consolidation above this level would be seen with mild upside bias for recovery to 1.2315-20 (38.2% Fibonacci retracement of 1.2479-1.2214), above there would extend gain to 1.2347 (50% Fibonacci retracement and previous support), however, reckon upside would be limited to 1.2375-80 (61.8% Fibonacci retracement of 1.2479-1.2214) and bring another decline later.
In view of this, we are looking to turn long on dips but one should take profit on such a rebound. Below said support at 1.2214 would extend recent decline from 1.2706 top to 1.2200, then towards 1.2170-75 but reckon 1.2150 would hold from here, risk from there is seen for another rebound.
