
A note on lower timeframe confirming price action…
Waiting for lower timeframe confirmation is our main tool to confirm strength within higher timeframe zones, and has really been the key to our trading success. It takes a little time to understand the subtle nuances, however, as each trade is never the same, but once you master the rhythm so to speak, you will be saved from countless unnecessary losing trades. The following is a list of what we look for:
- A break/retest of supply or demand dependent on which way you’re trading.
- A trendline break/retest.
- Buying/selling tails … essentially we look for a cluster of very obvious spikes off of lower timeframe support and resistance levels within the higher timeframe zone.
- Candlestick patterns. We tend to only stick with pin bars and engulfing bars as these have proven to be the most effective.
EUR/USD
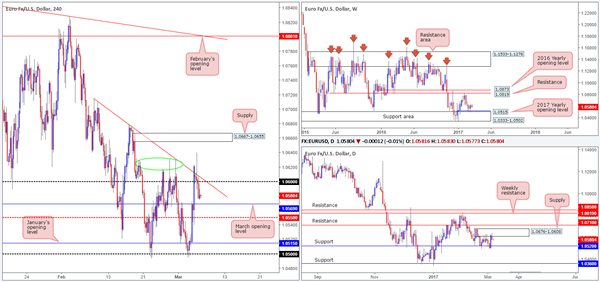
In recent trading, price failed to sustain gains beyond both the H4 trendline resistance extended from the high 1.0714 and the 1.06 handle, and as a result, pushed down to a low of 1.0574 on the day. With the H4 candles now seen trading just ahead of the March opening level at 1.0569, where does one go from here? Well, owing to daily action rebounding from a daily supply at 1.0676-1.0608 yesterday, and weekly price recently bouncing from the top edge of a major weekly support area at 1.0333-1.0502 (that’s bolstered by the 2017 yearly opening level at 1.0515), there’s certainly some conflict seen here on the higher timeframes!
Our suggestions: On account of the above notes, the only area that really jumps out to us this morning is seen around the 1.05/1.0520 area. The zone comprises of: a round number at 1.05, January’s opening level at 1.0515, daily support at 1.0520 as well as being further reinforced by the weekly support area at 1.0333-1.0502. However, seeing as how the 1.05/1.0520 zone has already been tested twice, we would not be comfortable trading from here without additional lower-timeframe confirmation (see the top of this report).
Data points to consider: US trade balance at 1.30pm GMT.
Levels to watch/live orders:
- Buys: 1.05/1.0520 ([wait for a lower-timeframe signal to form before looking to pull the trigger] stop loss: dependent on where one confirms the zone).
- Sells: Flat (stop loss: N/A).
GBP/USD
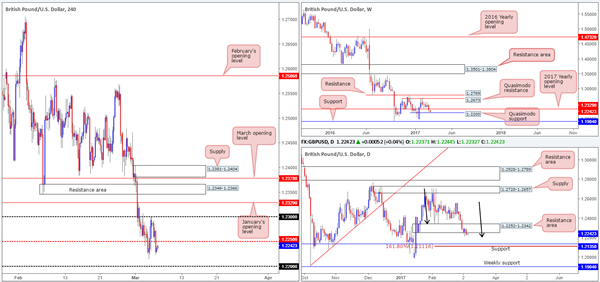
Climbing down from the top this morning, we can see that the weekly chart shows price trading within touching distance of the weekly Quasimodo support drawn from 1.22. In the event of a bounce being seen from here, the next upside hurdle in the firing range is the 2017 yearly opening level at 1.2329. Scooting down to the daily chart, daily demand at 1.2252-1.2342 (now acting resistance area) was taken out during the course of yesterday’s segment. This has, as you can probably see, potentially opened up the path south down to daily support coming in at 1.2135, which happens to converge nicely with a H4 AB=CD (see black arrows) Fib 161.8% ext. at 1.2111.
Stepping across to the H4 candles, the H4 mid-way level at 1.2250 was wiped out during the early hours of yesterday’s US segment. Below this base sits the psychological handle 1.22, which of course is also a weekly Quasimodo support! Looking to the left of current price from here, there is unfortunately very little H4 structure seen bolstering the 1.22 neighborhood. Couple this with daily price now open to test the daily support mentioned above at 1.2135, we feel 1.22 would be a risky place to simply place a pending buy order.
Our suggestions: In order to trade from 1.22, we would strongly recommend waiting for a lower-timeframe confirming signal to take shape (see the top of this report). Assuming that 1.22 is engulfed, all eyes will be on the aforementioned daily support. This too, would require additional lower-timeframe confirmation to trade, since there’s also very little supporting structure seen to the left of price on the H4 scale.
Data points to consider: US trade balance at 1.30pm GMT.
Levels to watch/live orders:
- Buys: 1.22 mark ([wait for a lower-timeframe signal to form before looking to pull the trigger] stop loss: dependent on where one confirms the zone). 1.2135 region ([wait for a lower-timeframe signal to form before looking to pull the trigger] stop loss: dependent on where one confirms the zone).
- Sells: Flat (stop loss: N/A).
AUD/USD
For those who read yesterday’s report you may recall that our desk suggested looking for potential lower-timeframe shorting opportunities from the 0.7609/0.76 region (daily resistance/round number). Well done to any of our readers who managed to lock down a position from here as price reacted beautifully and recently crossed swords with the first take-profit target: February’s opening base at 0.7577.
As price is now effectively capped between 0.7609/0.76-0.7577, where does one go from here? Given that there is room to extend lower from the daily resistance down to a daily demand base coming in at 0.7511-0.7543, alongside weekly action also showing room to push lower down to a weekly support area at 0.7524-0.7450, our team remains biased to the downside at the moment.
Our suggestions: Based on the above, we see two possible trade scenarios going forward:
Wait and see if price retests the 0.7609/0.76 region. Assuming that this comes to fruition and a lower time-frame confirming signal is seen (see the top of this report) we would look to short from here again.
In the event that price fails to reach 0.7609/0.76 and closes below February’s opening level at 0.7577, we would look to short any retest seen at this number assuming that it’s backed with a lower-timeframe confirming signal, targeting the H4 mid-way point 0.7550 (positioned directly above the daily demand at 0.7511-0.7543).
Data points to consider: Australian monetary policy meeting minutes at 3.30am. US trade balance at 1.30pm GMT.

Levels to watch/live orders:
- Buys: Flat (stop loss: N/A).
- Sells: 0.7609/0.76 region ([wait for a lower-timeframe signal to form before looking to pull the trigger] stop loss: dependent on where one confirms the zone). Watch for price to engulf 0.7577 and then look to trade any retest seen thereafter (waiting for a lower-timeframe confirming signal to form following the retest is advised] stop loss: dependent on where one confirms the level).
USD/JPY:
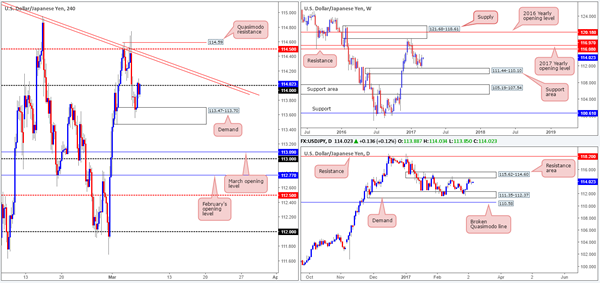
The USD/JPY, as you can see, gapped south at the open on Sunday but failed to generate much follow-through selling as the pair soon after touched gloves with a H4 demand area coming in at 113.47-113.70. As can be seen from the H4 chart, price ended the day pretty much unchanged around the underside of the 114 handle, consequently forming a daily indecision candle.
With weekly action recently printing a strong-looking weekly bullish engulfing candle, and daily movement seen loitering around the underside of a daily resistance area at 115.62-114.60, higher-timeframe technicals are somewhat mixed at the moment.
Our suggestions: While a H4 close above 114 would be considered a bullish signal, and considering that you’d be trading in line with weekly flow, price may very well reach the nearby H4 trendline resistance extended from the high 115.62, followed closely by the H4 mid-way resistance at 114.50. However, this would also place one against daily sellers! It’s just not worth the risk, in our opinion. The same goes for shorting this piece. A short would obviously place one in line with daily flow, but against weekly direction!
Therefore, at least for now, we will remain on the sidelines.
Data points to consider: US trade balance at 1.30pm GMT.
Levels to watch/live orders:
- Buys: Flat (stop loss: N/A).
- Sells: Flat (stop loss: N/A).
USD/CAD
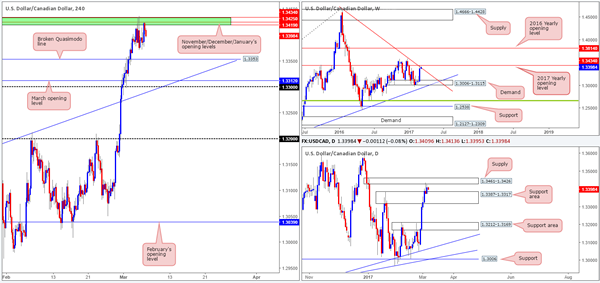
As can be seen from the H4 chart this morning, upside remains capped at 1.3434/1.3419 (November, December and January’s opening levels). Also of note here is the converging weekly trendline resistance extended from the high 1.4689 and daily supply coming in at 1.3461-1.3426. Assuming that the bears remain in the driving seat here, the next downside target on the H4 scale is a broken Quasimodo line at 1.3353. While this sounds like a sellers’ paradise, it may be worth noting that there is a daily support area seen in play at 1.3387-1.3317 so the bulls still have a hand in this fight.
Our suggestions: If one is able to pin down a lower-timeframe short position (see the top of this report) from the above noted monthly levels, one could consider shorting from here and target the above said broken H4 Quasimodo level at 1.3353. In regards to buying this unit, we would advise against this given the opposing structures seen on the weekly and daily timeframes.
Data points to consider: US trade balance at 1.30pm. Canadian trade balance at 1.30pm GMT.
Levels to watch/live orders:
- Buys: Flat (stop loss: N/A).
- Sells: 1.3434/1.3419 ([wait for a lower-timeframe signal to form before looking to pull the trigger] stop loss: dependent on where one confirms the zone).
USD/CHF:
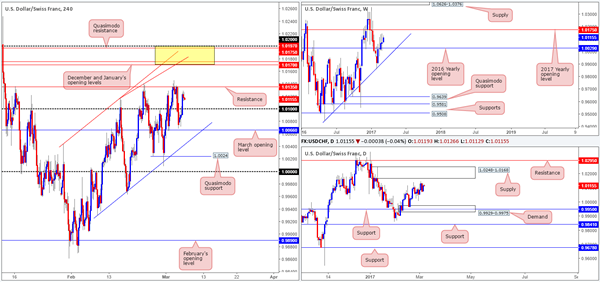
Kicking this morning’s report off with a look at the weekly timeframe, we can see that the bulls have a slight edge this morning and may end the week connecting with the 2017 yearly opening level at 1.0175. Looking down to the daily candles, there’s a nearby daily supply seen at 1.0248-1.0168, which happens to encapsulate the aforementioned 2017 yearly opening line.
Despite H4 price being capped by a H4 resistance at 1.0135, our team still has their beady little eye on the 1.02/1.0170 (yellow zone) neighborhood for shorts. The area comprises of the following converging structures: both December and January’s opening levels at 1.0170/1.0175, a H4 trendline resistance pegged from the high 1.0118, a H4 Quasimodo resistance at 1.0197, a 1.02 psychological handle and let’s not forget that all of this is seen housed within the daily supply zone mentioned above 1.0248-1.0168.
Our suggestions: In light of this confluence, our team will, dependent on the time of day, look to sell from the 1.0175 neighborhood, with stops placed a few pips above 1.02.
Data points to consider: US trade balance at 1.30pm GMT.
Levels to watch/live orders:
- Buys: Flat (stop loss: N/A).
- Sells: 1.0175 region ([an area one could possibly trade at market] stop loss: 1.0205).
DOW 30
The equity market took on a more sober approach on Monday, ranging a mere 86 points on the day. In light of this, much of the following will report will echo thoughts put forward in yesterday’s analysis…
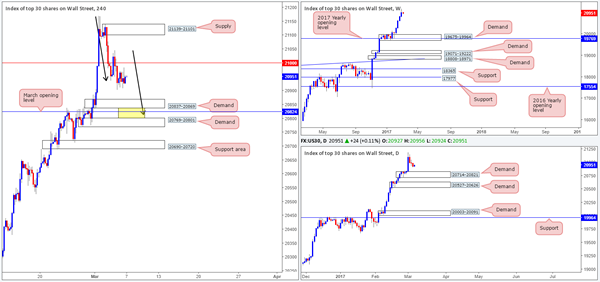
The US equity market continued to climb north last week, registering its fourth consecutive weekly gain! With equities now trading at record highs, where do we go from here? Well, given that there is absolutely no weekly resistance levels in sight, the best we can do for the time being is continue looking to ‘buy the dips’. The closest higher-timeframe area can be seen at 20714-20821: a daily demand zone.
Our suggestions: We still have an eyeball on the area seen between the two H4 demands: 20769-20801/ 20837-20869, which happens to be positioned within the walls of the aforementioned daily demand zone! The interesting thing here is that in between these two H4 barriers (the yellow zone) is March’s opening level at 20824 and a possible H4 AB=CD completion point at 20813 (see black arrows). To that end, should we see price strike the yellow zone today/this week, our team would, assuming that a reasonably sized H4 bull candle took shape, look to buy from here with stops either placed below the trigger candle or below the H4 demand at 20769-20801.
Data points to consider: US trade balance at 1.30pm GMT.
Levels to watch/live orders:
- Buys: 20801/20837 region ([wait for a reasonably sized H4 bull candle to form before looking to pull trigger here] stop loss: ideally beyond the trigger candle).
- Sells: Flat (stop loss: N/A).
GOLD
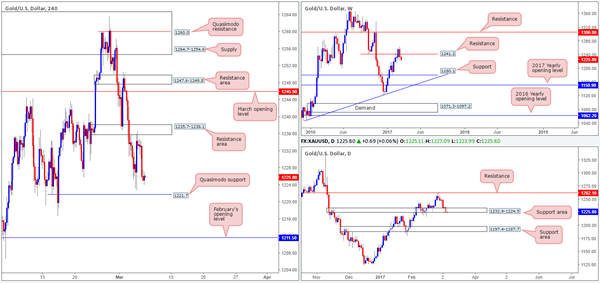
Across the board, we saw the dollar advance yesterday which helped the yellow metal catch an offer from the underside of the H4 resistance area at 1235.7-1238.1. To our way of seeing things, the next support target on this scale to have an eyeball on is the H4 Quasimodo support drawn in at 1221.7.
Over on the daily chart, it’s clear that the bulls are struggling to hold ground around the daily support area seen at 1232.9-1224.5, given yesterday’s full-bodied daily bearish candle! Looking up on the weekly chart, recent action chalked up a beautiful-looking weekly bearish engulfing candle around the weekly resistance line of 1241.2.
Our suggestions: However, despite both the weekly and daily timeframes indicating further selling may be on the cards, selling into a H4 Quasimodo support is not something we’d be comfortable with! Nevertheless, in the event that a H4 close beyond this line is seen and is followed up with a retest as well as a lower-timeframe sell signal (see the top of this report), we would look to short bullion, targeting February’s opening line at 1211.5 as an initial first take-profit target.
Levels to watch/live orders:
- Buys: Flat (stop loss: N/A).
- Sells: Watch for price to engulf 1221.7 and then look to trade any retest seen thereafter (waiting for a lower-timeframe confirming signal to form following the retest is advised] stop loss: dependent on where one confirms the level).


