Sample Category Title
New Zealand Dollar Sinks After RBNZ Cuts by 50 bps
The New Zealand dollar is sharply lower on Wednesday. NZD/USD is trading at 0.6079 in the European session, down 0.96% on the day.
RBNZ slashes rates to 4.75%
The Reserve Bank of New Zealand lowered the cash rate by 50 basis points on Wednesday to 4.75%. The RBNZ cut rates by 25-bps in August, the first rate cut in over four years. The jumbo rate cut had been priced in by the markets but the dramatic move has sent the New Zealand dollar sharply lower.
The rate statement noted that inflation was within the target range and was “converging on the 2% midpoint”. This is a remarkable turnaround by the central bank, which only a few months ago was warning that inflation was too high and could force the Bank to raise rates. The RBNZ had projected that initial rate cut would not occur before mid-2025 but has moved up the timetable in dramatic fashion.
The decision to cut rates by 50 bps is not surprising, given that inflation has been falling and GDP contracted in the second quarter. New Zealand releases the quarterly inflation report next week and if inflation is within expectations, it could set up another rate cut at the November meeting.
The RBNZ would like to continue trimming rates but the sharp decline of the New Zealand dollar is a concern. The New Zealand dollar has plunged 4.25% in October and has slipped to a seven-week low. Today’s oversized cut sent the kiwi sharply lower and further cuts will add downward pressure on the currency.
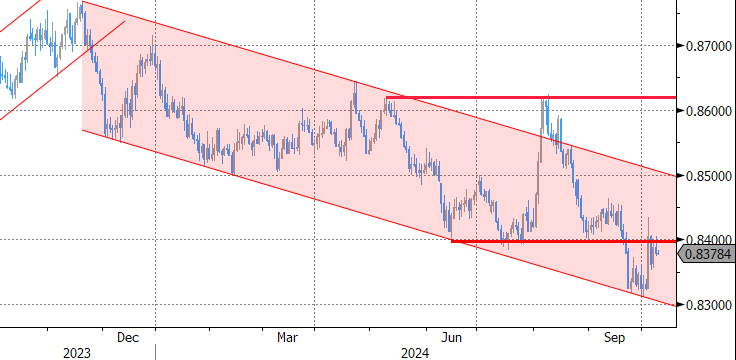
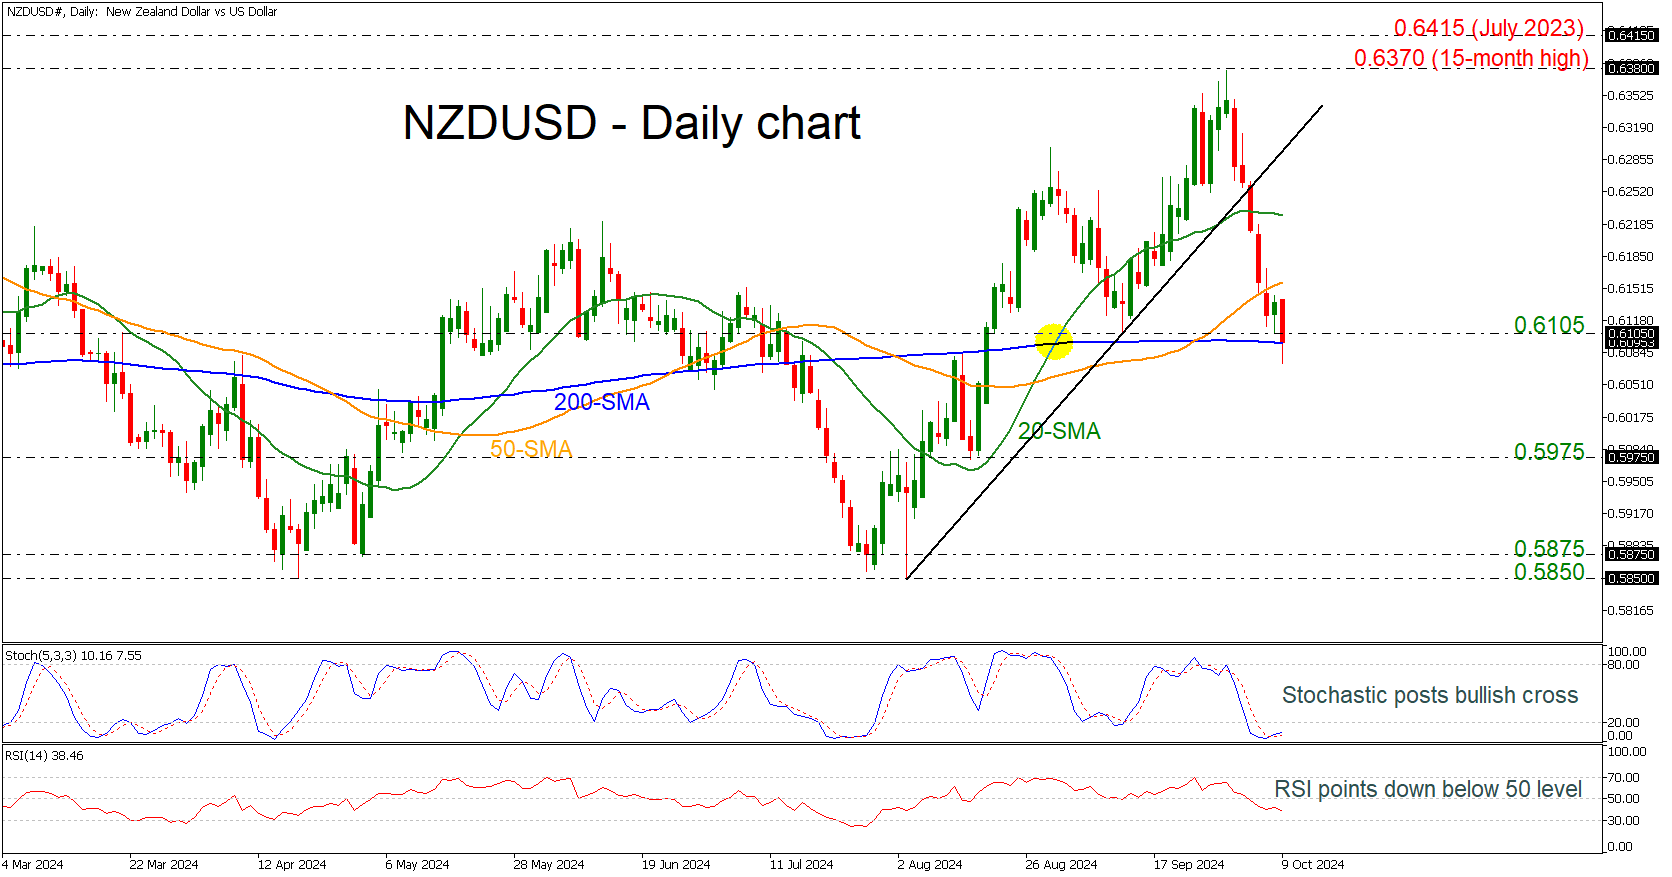
NZD/USD Technical
- NZD/USD has pushed below several support levels and is testing support at 0.6079. Below, there is a monthly support level at 0.5995
- There is resistance at 0.6131 and 0.6153
ECB’s Kazimir not completely convinced on Oct rate cut
ECB Governing Council member Peter Kazimir struck a cautious tone today, signaling that while a rate cut next week is possible, he remains "not completely convinced" that ECB should move based on just one positive inflation reading.
Speaking to reporters, Kazimir acknowledged that September’s CPI dip below 2% for the first time since 2021 has fueled expectations of a rate cut, but he emphasized the need for a more comprehensive view of the economic data. "And we’ll have that key information in December," he added
He also downplayed concerns about the risk of inflation undershooting the 2% target, stating, "I definitely don’t wake up in a sweat thinking that the inflation rate should be well below 2%."
“On the contrary, we still lack sufficient confidence that we’re out of the woods and that the goal of sustainably being at 2% is entirely realistic," he warned.
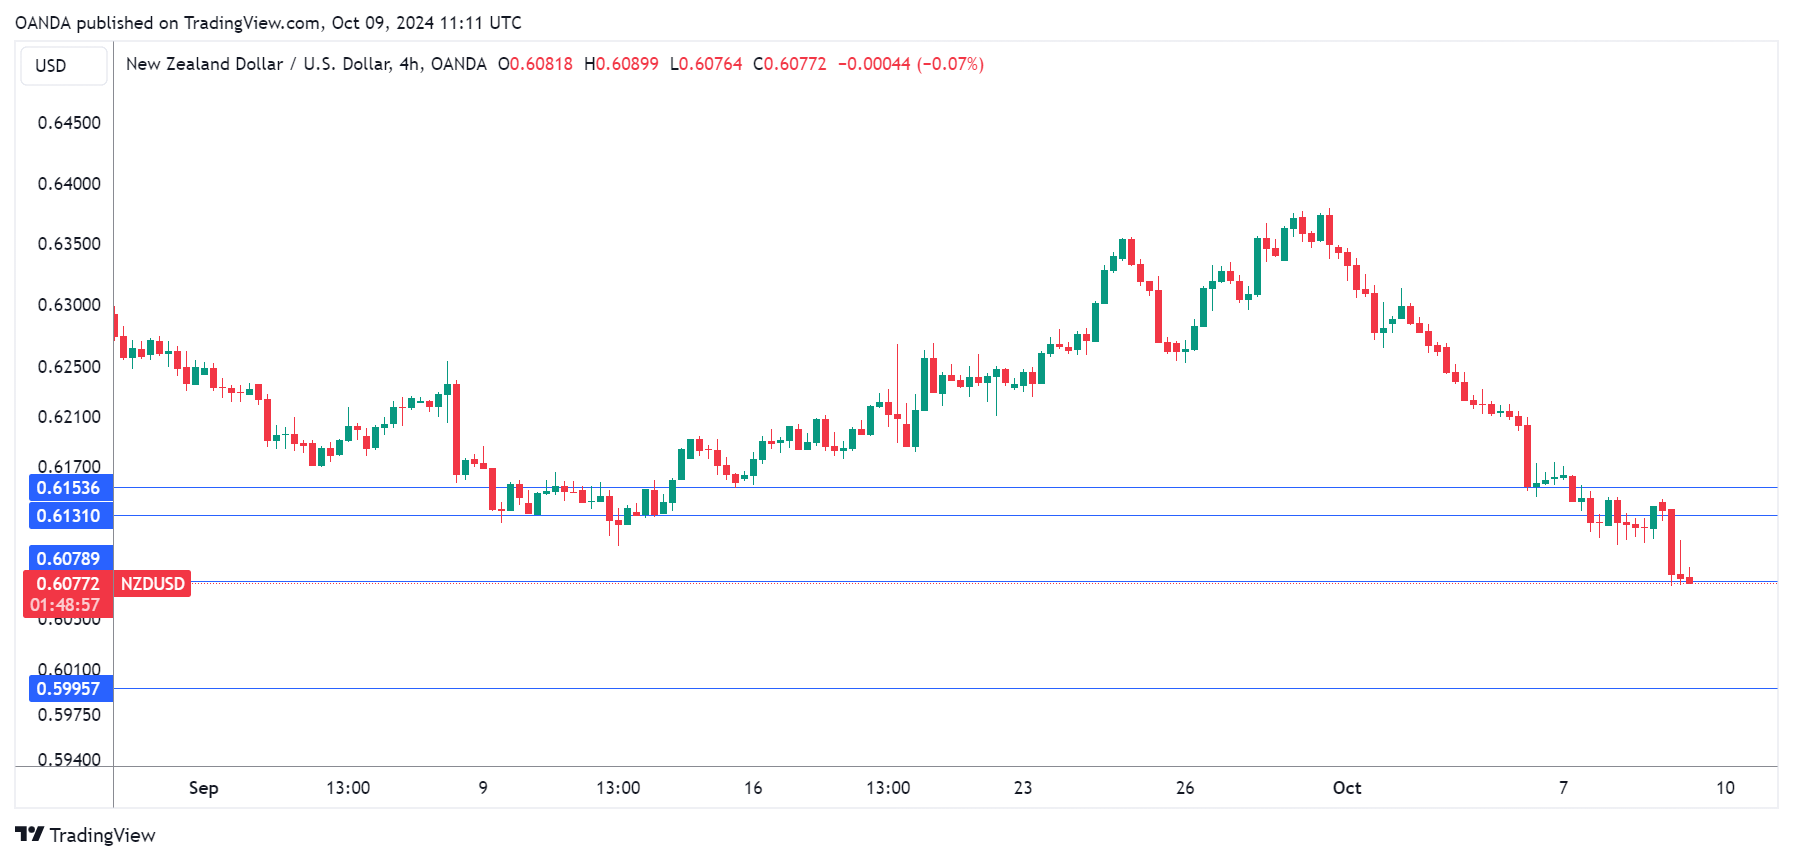
NZD/USD Hits Seven-Week Low Amid Ongoing Sell-off and RBNZ Rate Cuts
The NZD/USD pair has dropped to a seven-week low, touching 0.6091, as the sell-off that started on 1 October continues to intensify. The New Zealand dollar's weakness is largely attributed to the Reserve Bank of New Zealand's (RBNZ) recent decisions to lower interest rates in response to decreasing inflation pressures.
The RBNZ has implemented consecutive rate cuts, most recently reducing the key rate by 50 basis points to 4.75% per annum, following a similar reduction in August. These measures aim to anchor inflation within the target range of 1-3%, with upcoming consumer price data anticipated to potentially show inflation consolidating around 2%, aligning well with the RBNZ’s objectives.
Globally, the focus is on the upcoming publication of the latest US Federal Reserve meeting minutes. These minutes are highly scrutinised as they provide crucial insights into the Fed's future monetary policy direction. Market participants often use this information to gauge the likelihood of further Fed-rate adjustments, which, in turn, influences global currency dynamics.
Technical analysis of NZD/USD
The NZD/USD market has reached the forecasted target of the downward wave at 0.6080. Currently, a new consolidation phase is expected to form above this level. If there is an upward breakout, a corrective movement towards 0.6230 could occur. Following this correction, the potential for a further decline to 0.5944 may be considered. Alternatively, if the consolidation resolves downwards, the downward trend could continue towards 0.5944. The MACD indicator supports this bearish outlook, with the signal line positioned below zero and trending downwards.
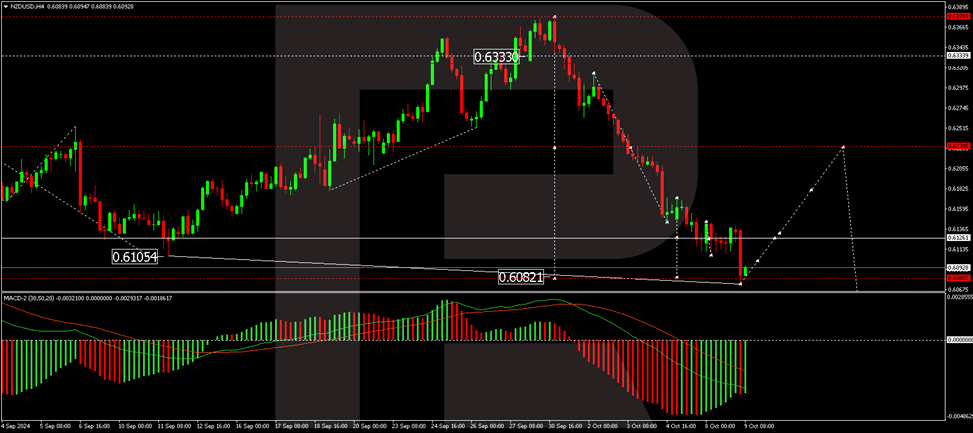
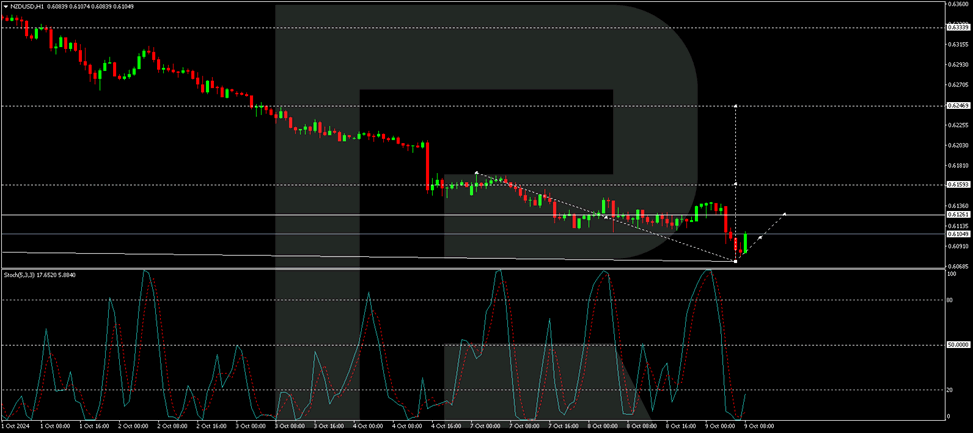
On the hourly chart, after forming a consolidation range around 0.6126, the pair achieved the downward wave target at 0.6080 with a downward exit. An upward movement to 0.6126 is expected today, followed by a retest of 0.6100. The market may develop a new consolidation range at these levels. An upward breakout could initiate a corrective rally towards 0.6230, considered a corrective response to the recent downward trend. The Stochastic oscillator, with its signal line below 20 and pointing upwards, suggests a potential for upward correction.
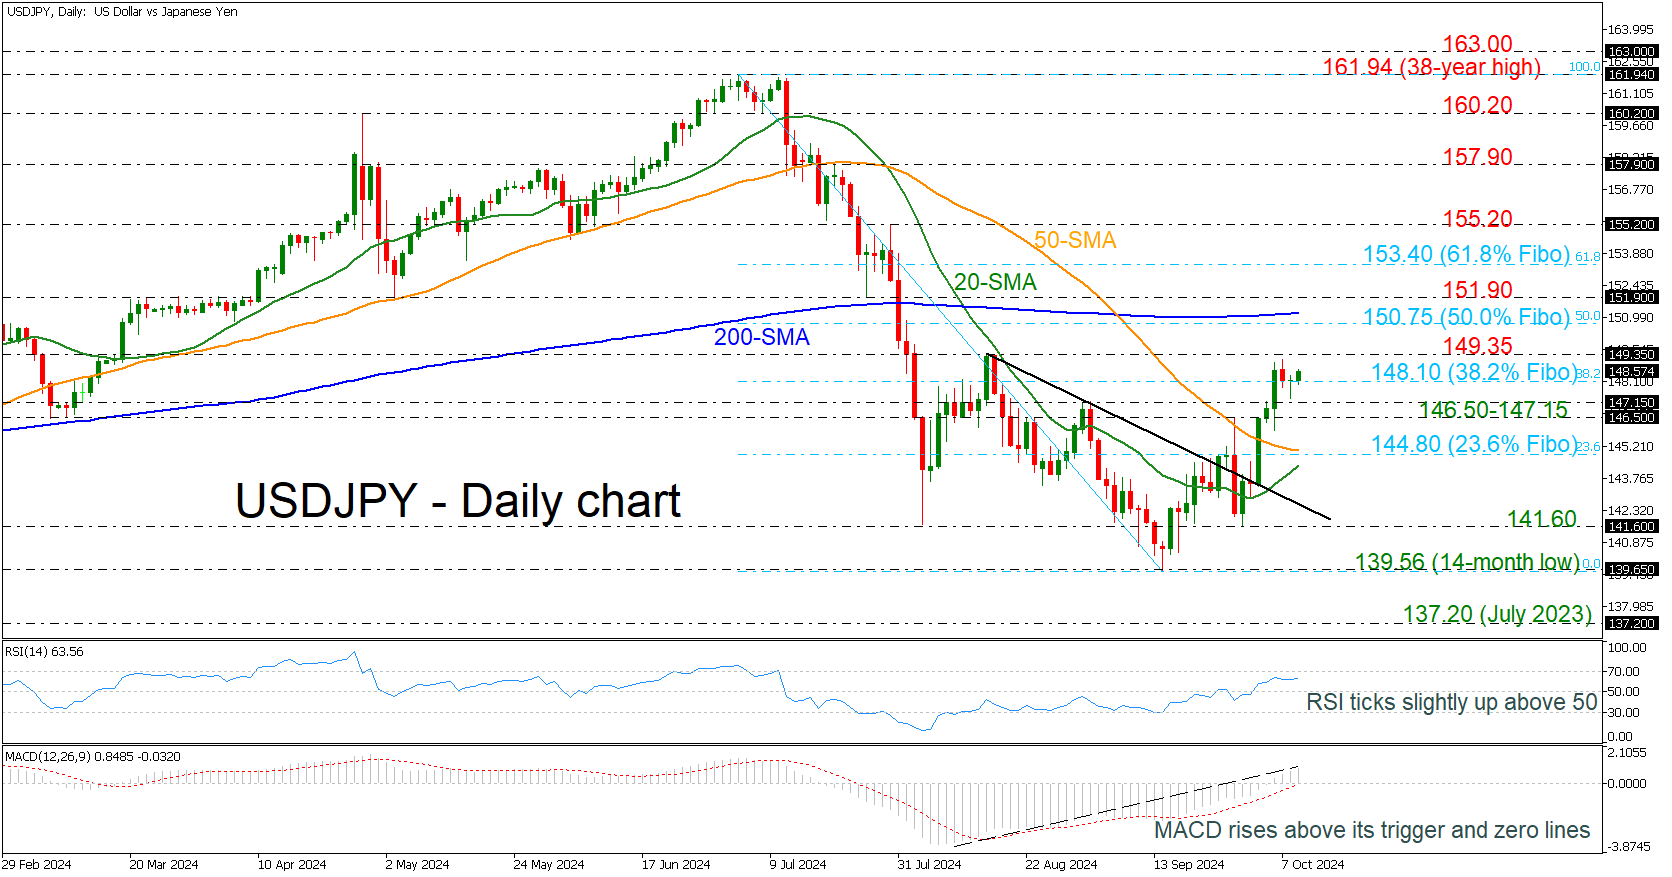
USDJPY Hovers Near 38.2% Fibonacci Level
- USDJPY creates bullish correction from 14-month low
- RSI and MACD stand above their mid-levels
USDJPY is holding above the 38.2% Fibonacci retracement level of the down leg from 161.94 to 136.56 at 148.10 but is failing to extend its rebound from the 14-month low of 139.56 above the previous peak of 149.35.
Having a look at the technical oscillators, the RSI is pointing marginally up above the 50 area, while the MACD is strengthening its bullish momentum above its trigger and zero lines since it bottomed on August 8.
If the buying interest continues and the market surpasses the 149.35 resistance, then a strong obstacle could come from the 50.0% Fibonacci of 150.75 and the 200-day simple moving average (SMA) at 151.20.
In the negative scenario, a slide below the 38.2% Fibo of 148.10 could drive traders towards the immediate support of 146.50-147.15. Below that, the 50-day SMA and the 20-day SMA, where they stand near the 23.6% Fibonacci of 144.80, may pause the descending move.
Summarizing, USDJPY is displaying bullish attitude in the near term; however, only a break above the 200-day SMA could endorse the upside movement.
Analysis of XAU/USD: Gold Price Drops to a Two-Week Low
The XAU/USD chart shows that yesterday, the price of gold fell below $2610, a level not seen since 20th September.
Bearish sentiment has been driven by the continued strengthening of the US dollar. According to Trading Economics:
→ This is due to market participants lowering expectations for an aggressive rate cut by the Federal Reserve.
→ Currently, there is an 89% probability that the Fed will decide on a 25 basis point rate cut in November.
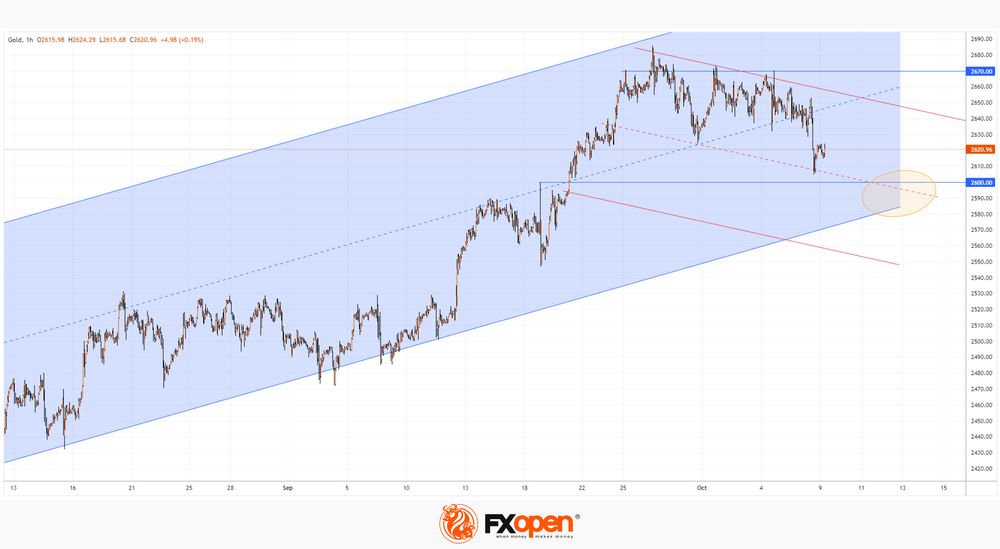
The technical analysis of the XAU/USD chart indicates that gold is still within the upward channel (shown in blue), which began in August 2024. However:
→ The gold price has broken below the median line of the blue channel.
→ The price decline from the historic peak reached on 26th September is forming a descending channel (shown in red), which can be considered a correction within the broader upward trend.
→ The $2670 level is showing signs of resistance, while the psychological level of $2600 could act as support, as seen during the bullish breakout in mid-September.
It is possible that bulls will attempt to resume the upward trend, using the area (marked by an orange circle) created by the following support levels:
→ The lower boundary of the blue channel.
→ The red channel line.
→ The psychological level of $2600.
Be prepared for potential volatility spikes. The FOMC meeting minutes will be released today at 21:00 GMT+3, which could trigger sharp movements in the gold price.
Start trading commodity CFDs with tight spreads. Open your trading account now or learn more about trading commodity CFDs with FXOpen.
This article represents the opinion of the Companies operating under the FXOpen brand only. It is not to be construed as an offer, solicitation, or recommendation with respect to products and services provided by the Companies operating under the FXOpen brand, nor is it to be considered financial advice.
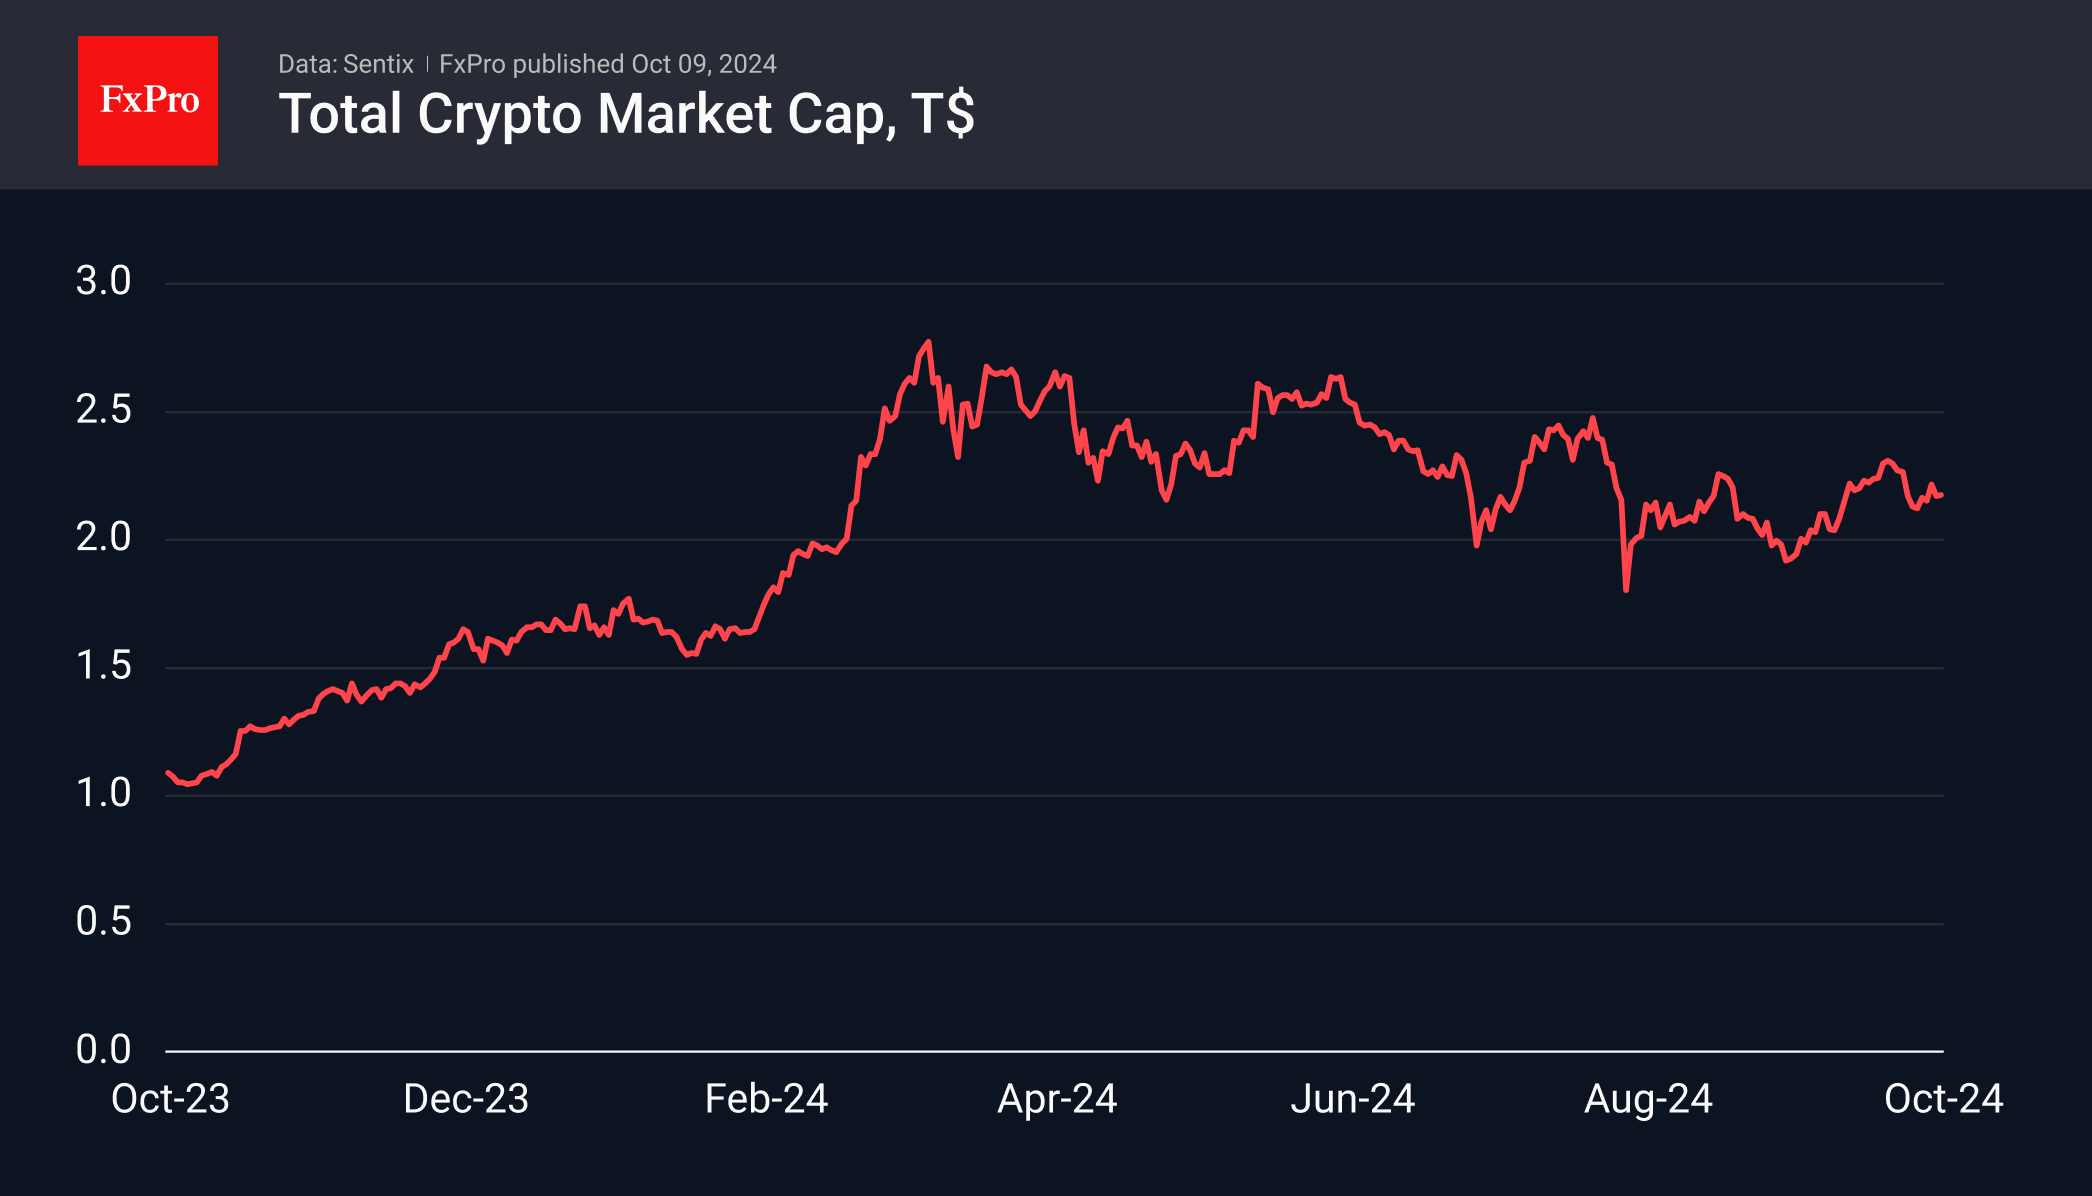
Crypto Maintains Its Equilibrium
Market picture
The cryptocurrency market has stabilised around the $2.17 trillion level where it was a week and a day ago. The sentiment index has remained in the 49-50 (neutral) range for the fifth day, which contrasts with the near ‘extreme greed’ sentiment in the stock market. This wariness among crypto investors has often heralded stock market sell-offs. Still, this time, it could be due to sell-offs in China and expectations of new signals on the Fed’s monetary policy.
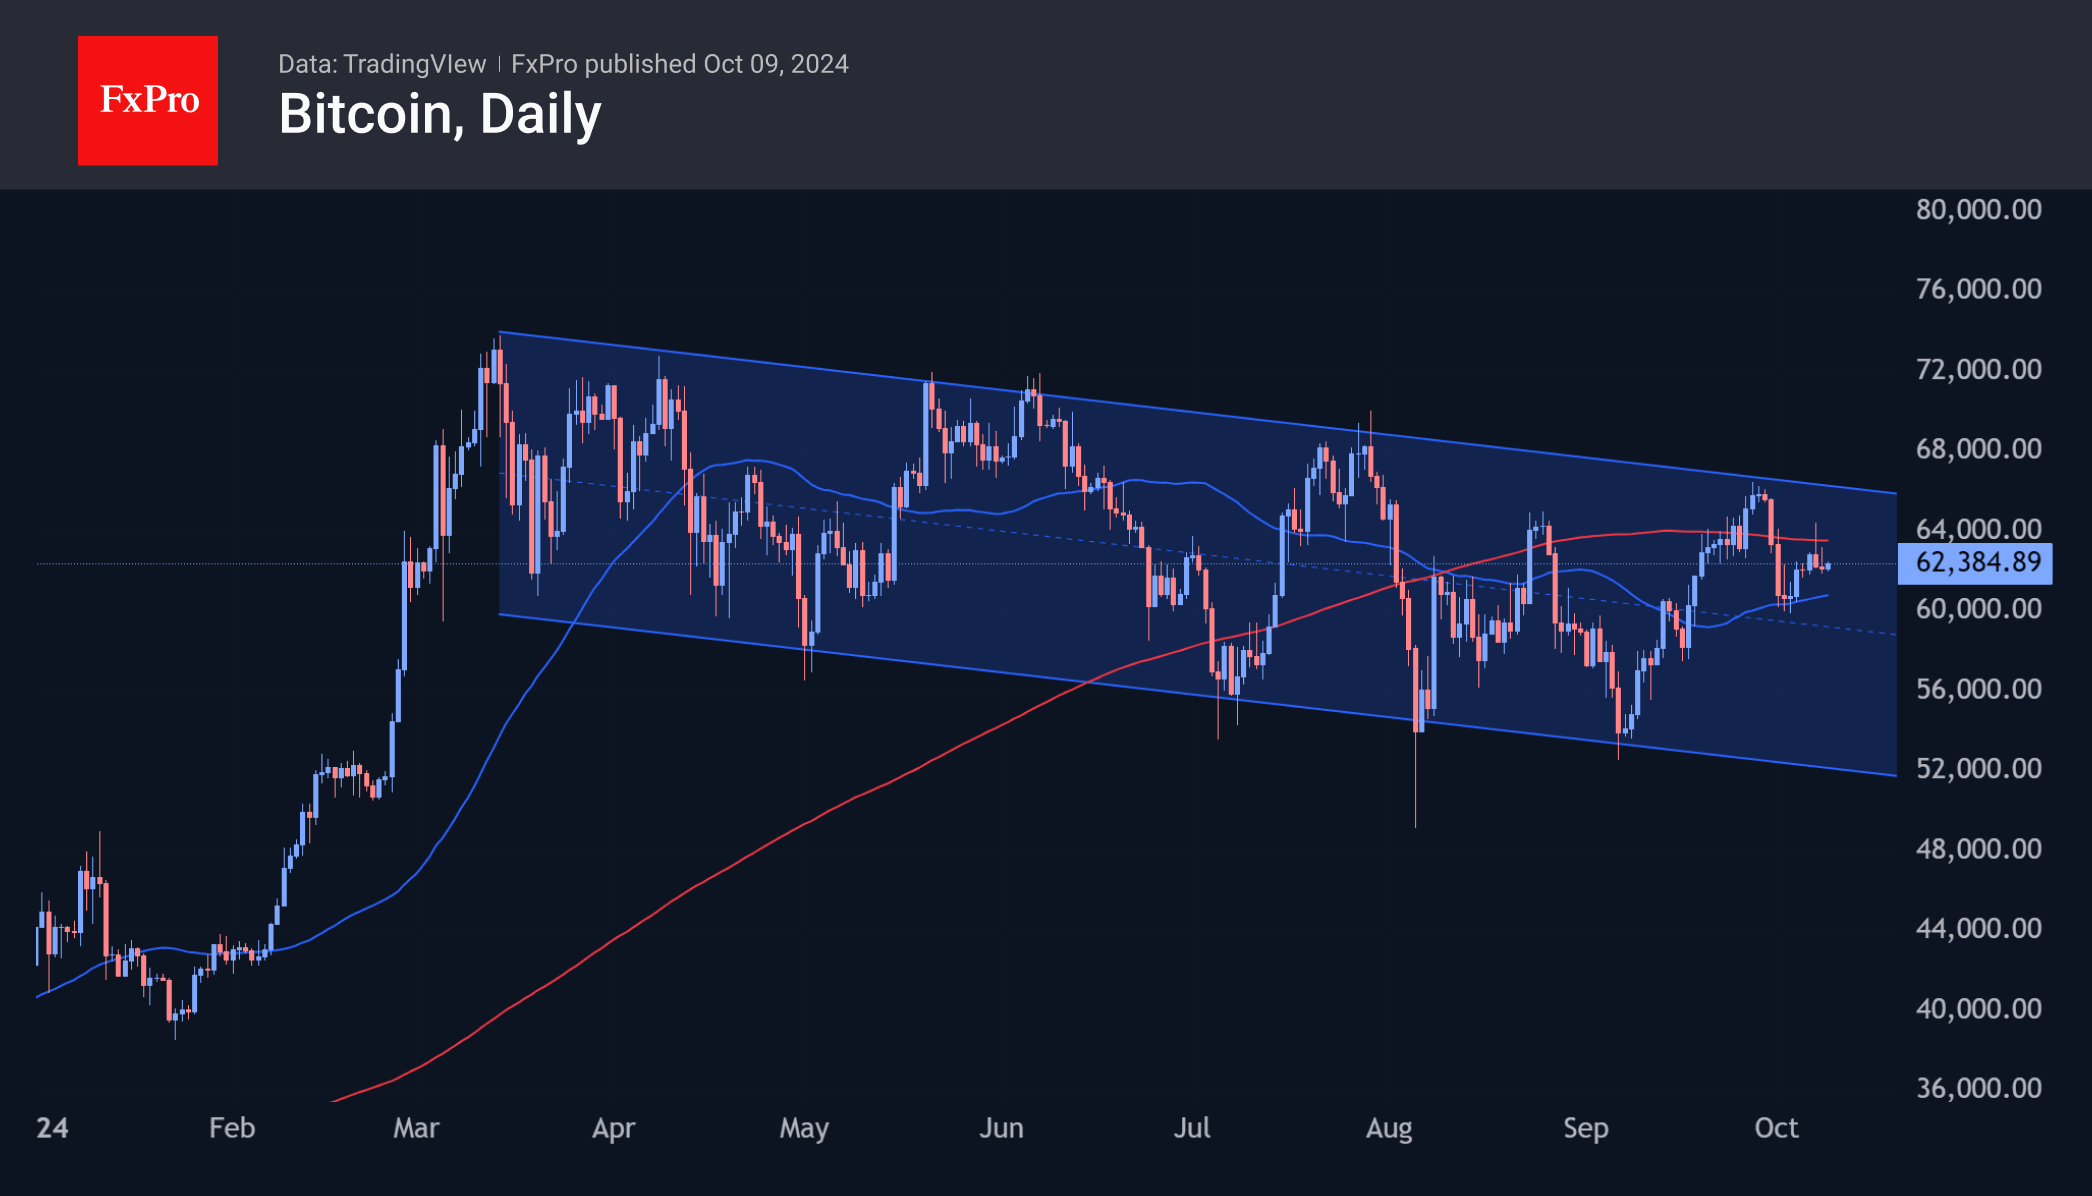
Bitcoin’s price has changed little over the past 24 hours, remaining at $62.4K, sandwiched between the 200-day moving average above and the 50-day below. Potential triggers to break out of this range could be Fed minutes or US inflation data if they lead to a reassessment of expectations in traditional markets. A technical signal could be a move out of the range delineated by the mentioned moving averages at $63.6K and $60.8K, with the potential for further movement towards a breakout.
News background
According to Bitfinex, Bitcoin’s decline from $66,500 to $60,000 last week is a ‘healthy rebuild’ that reduces the risk of a ‘sudden drop’ in the coming days and weeks.
Matrixport expects that miners’ shares may rise as their revenue stabilises after falling and lagging Bitcoin’s momentum. The daily revenue of publicly traded mining companies fell from $70 million to $31 million after the April 2024 halving.
The US Supreme Court has granted permission to sell 69,370 Bitcoins previously seized from the darknet site Silk Road. US authorities declined to comment on whether they plan to sell the bitcoins on the marketplace.
A court in the US has approved a plan to distribute payments to creditors of the collapsed FTX exchange. About 98% of creditors will receive more than $6.8bn in fiat within 60 days of the plan taking effect.
The Crypto.com exchange filed suit against the SEC after receiving a Wells notice. The agency is using the notice to report violations of the law, which is the basis for the planned civil suit.
According to Politico, Robinhood’s general counsel, Dan Gallagher, is the leading candidate to head the SEC if Donald Trump wins the U.S. presidential election. Other contenders include former CFTC Chairman Chris Giancarlo, SEC Commissioner Hester Pearce and former agency general counsel Robert Stebbins.
ECB’s Villeroy signals likely rate cut next week, more to follow gradually
ECB Governing Council member François Villeroy de Galhau indicated today that a rate cut is "very probable" at the upcoming meeting next week.
Speaking on Franceinfo radio, Villeroy emphasized that this move "won’t be the last" in the current easing cycle. However, he added that the pace of future cuts will depend on how inflation evolves over time.
Villeroy stressed ECB’s commitment to gradual policy adjustments, saying the central bank will avoid making any "volatile moves." He remarked, "We are used to acting with gradualism, which means resolutely but without making too significant steps."
On inflation, Villeroy expressed confidence that price levels will stabilize at ECB's 2% target by early next year in France, and later in 2025 across Europe. However, he noted that fluctuations could still occur in the coming months.
NZDUSD Battles With 200-Day SMA After RBNZ’s Rate Cut
- NZDUSD continues the bearish correction
- Technical oscillators are mixed
NZDUSD plunged significantly after the RBNZ’s decision to cut interest rates by 50 bps. The pair remained closed to the 0.6100 round number and is holding near the 200-day simple moving average (SMA), which is acting as a strong support level.
The technical oscillators are showing some contradicting signals. The stochastic oscillator is pointing upwards in the oversold area after a bullish cross within its %K and %D lines; however, the RSI is pointing down below the neutral threshold of 50.
If the market retreats further, the next support to pause the bearish action is coming from the previous troughs on August 15 at 0.5975. Moving lower, the support area of 0.5850-0.5875 may halt the steep negative momentum.
On the other hand, a potential rebound off the 0.6105 barrier may send the pair up to the 50-day SMA at 0.6160 and the 20-day SMA at 0.6225. More increases may take the bulls back towards the 15-month peak of 0.6370 and slightly higher to 0.6415, registered in July 2023, adding some optimism for upside pressure.
To sum up, as long as the market remains above the 200-day SMA, the bias remains positive despite the aggressive selling interest in the last few days.
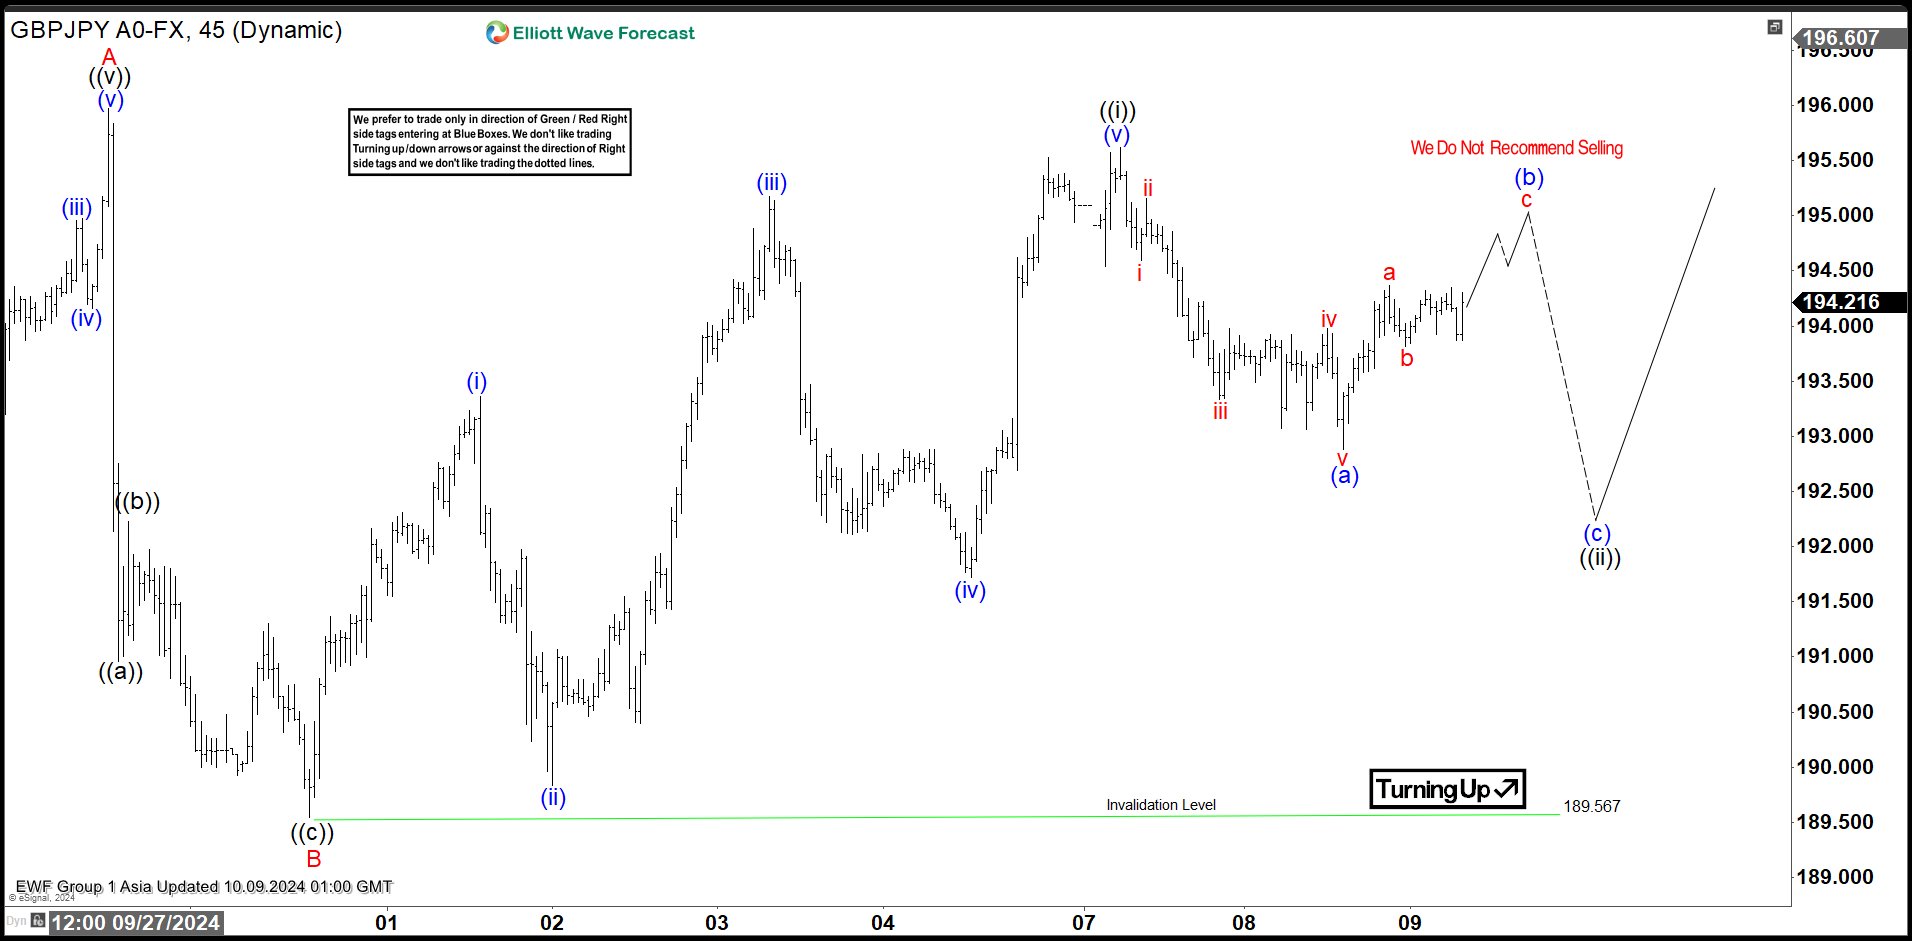
Elliott Wave Intraday View in GBPJPY Looking for Further Upside
Short Term Elliott Wave View in GBPJPY suggests that cycle from 9.11.2024 low is currently in progress as a zigzag. Up from 9.11.2024 low, wave A ended at 195.97. Pullback in wave B also unfolded as a zigzag Elliott Wave structure. Down from wave A, wave ((a)) ended at 190.96 and wave ((b)) ended at 192.22. Wave ((c)) lower ended at 189.56 which completed wave B in higher degree.
The pair has turned higher in wave C. Up from wave B, wave (i) ended at 193.35 and pullback in wave (ii) ended at 189.84. Pair extended higher in wave (iii) towards 195.17 and pullback in wave (iv) ended at 191.72. Final leg wave (v) ended at 195.62 which completed wave ((i)) in higher degree. Pullback in wave ((ii)) is currently in progress to correct cycle from 9.30.2024 low in 3, 7, or 11 swing before it resumes higher. Down from wave ((i)), wave (a) ended at 192.88. Expect pair to rally in wave (b) then turns lower again in wave (c) to complete wave ((ii)). Near term, while pivot at 189.57 low remains intact, expect dips to find buyers in 3, 7, 11 swing for further upside.
GBPJPY 45 Minutes Elliott Wave Chart
GBPJPY Elliott Wave Video
https://www.youtube.com/watch?v=aC6R_B5SrHQ
China Indices Suggest Ongoing Doubts of Efficacy and Amount of Stimulus
Markets
The post payrolls rise in US yields and by extension in yields on other core markets yesterday shifted into a lower gear. Uncertainty whether China (fiscal and monetary) stimulus would be able to kickstart a genuine reacceleration of Chinese growth also left European markets with a risk-off start and modestly lower yields. Sentiment temporarily changed in the US, with yields trying to fight back early in US dealings. The $58 3-y Note action tailed slightly and other metrics also suggested guarded investors interest even after recent sharp rise in yields. Afterall, the impact on the market was limited. At the end of the day, US yields in technical trading eased between 3.7 bps (2-y) and 1.1 bp (30-y). Fed speakers including board member Jefferson repeated that risks to the Fed dual mandate of price stability and maximum employment have been roughly brought into balance. Decisions on further easing will be made on a data-dependent, meeting by meeting approach. Bost Fed president Collins took gave a similar assessment, but apparently is giving a bit more weight to the Fed supporting favourable economic conditions and not putting unnecessary restraint on demand. Aside from market policy expectations, an intraday decline of the oil price maybe also helped to cap the rise in US yields. Moves in German yields were modest (2-y -1.9 bps, 30-y +0.2 bps) as markets see the debate on to additional 25 bps cuts this year as ‘settled’. US equities ignored the China-driven uncertainty data weighted on European indices (S&P 500 +0.97, Nasdaq + 1.45%). The dollar maintained its post-payrolls gains, but nothing more than that (DXY 102.55, EUR/USD even marginally higher at 1.098). After some intraday volatility, sterling gained modestly against the euro (EUR/GBP 0.848) and the dollar (1.3104), but uncertainty on the UK fiscal situation/end October budget might hamper sustained further gains.
This morning, mainland China indices (CSI 300 -3.0%) suggest ongoing market doubts of the efficacy and the amount of stimulus from both monetary and fiscal authorities. Even so, spill-over effects to other regional markets stay limited. US yields are marginally higher. The dollar shows no clear trend (EUR/USD 1.097). Later today, there are no important eco data in Europe or the US. The US Treasury will sell $39 bln US 10-y Notes. Investors will also keep an eye at the Fed minutes of the September 17-18 meeting. Officially there was only one dissenting vote (Michelle Bowman) on the 50 bps rate cut, but especially given the strong payrolls report Friday, markets will look for other MPC members making reservations on the bold start of the easing cycle. For now we expect yields to hold near current levels in the run-up to tomorrow’s US CPI data. The technical picture on the dollar improved (e.g. EUR/USD below 1.1002 neckline), but for now there is no convincing trigger to extend further USD gains.
News & Views
The Reserve Bank of New Zealand cut its policy rate for a second consecutive time this morning, upping the pace from an inaugural 25 bps to 50 bps today. The Official Cash Rate now stands at 4.75% which the RBNZ still sees as being restrictive, leaving monetary policy well-placed to deal with any near-term surprises. The central bank sticks with a data-dependent approach going forward. At the next meeting, a new set of economic forecasts will be available. Money markets discount another 50 bps rate cut. Headline CPI is expected to be withing the 1%-3% target band in Q4 2024 and to remain around the midpoint in the medium-term. Weak demand is restricting the pass-through of increased input costs to prices faced by consumers. Apart from weak consumer growth, also weak business investments and low productivity growth slow the economy. Employment conditions continue to soften. The kiwi dollar extends this month’s losses against a reviving dollar with NZD/USD currently changing hands at 0.61 coming from levels around 0.6350 at the end of Q3.
The US federal budget deficit was $1.8tn in fiscal year 2024 (about 6.4% of GDP) according to estimates by the Congressional Budget Office. That’s $139bn more than the official shortfall recorded during fiscal year 2023. If not for the Supreme Court’s decision to overturn a plan to cancel many borrowers’ outstanding student loans, the 2023 deficit would have been $2tn. Revenues increased over the past year by an estimated $479bn (or 11% to $4.92tn). Outlays rose by an estimated $617bn (or 10% to $6.75tn). The US spent $950bn on interest, up 34% from the prior year, mostly because of higher interest rates. Interest costs surpassed military spending.
Graphs
GE 10y yield
The ECB cut policy rates by 25 bps in June and in September. Stubborn inflation (core, services) still is a source of concern, but very weak PMI’s and soft comments of Lagarde (and other MPC members) suggest the ECB is likely to step up the pace of easing with an October cut. Spill-overs from strong US data prevented a test of the 2.0% barrier. 2.00-2.35% might serve as a ST consolidation range.
US 10-y yield
The Fed kicked off its easing cycle with a 50 bps move. The Fed shifting focus from inflation to a potential slowdown in growth/employment made markets consider more 50 bps steps. Strong US September payrolls suggest the economy doesn’t need aggressive Fed support for now, but the debate might resurface as the economic cycle develops. For the US 10-y, 3.60% serves as strong support. The steepening trend is taking a breather.
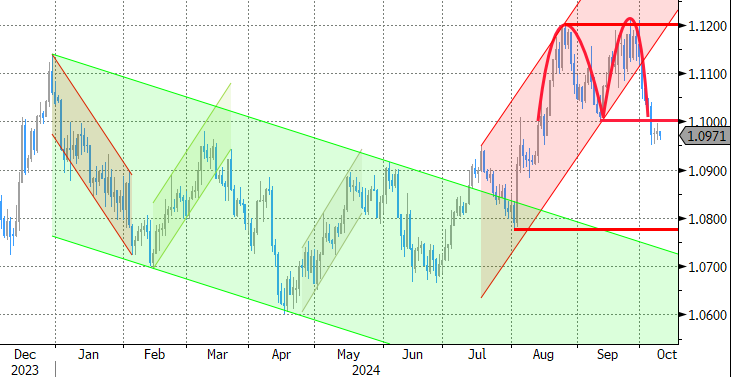
EUR/USD
EUR/USD moved above the 1.09 resistance area and twice tested the 1.12 big figure as the dollar lost interest rate support at stealth pace. Bets on fast and large rate cuts trumped traditional safe haven flows into USD. An ailing euro(pean economy) partially offset some of the general USD weakness. After solid early October US data, the dollar regained traction, with EUR/USD breaking the 1.1002 neckline. Targets of this pattern are near 1.08.
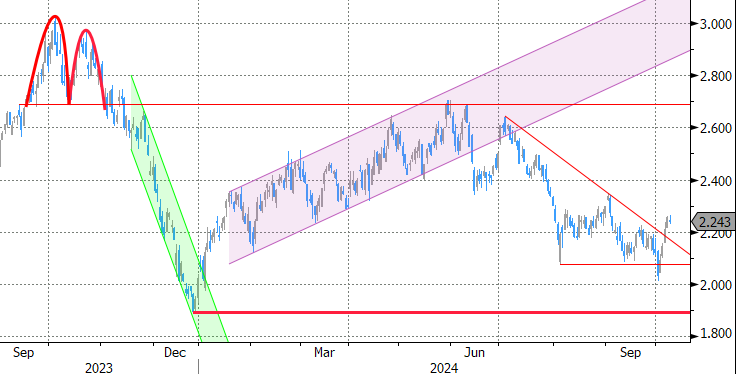
EUR/GBP
The BoE delivered a hawkish cut in August. Policy restrictiveness was indicated to be further unwound gradually. The economic picture between the UK and Europe also was increasingly diverging to the benefit of sterling, pulling EUR/GBP below 0.84 support. Dovish comments by BoE Bailey ended by default GBP-strength.