
Sample Category Title
Oil’s Short-Term Risks Remain Tilted to the Upside
Chinese authorities think that the country could achieve its 5% growth target with the stimulus measures that have already been announced, but investors not much so. On the contrary, the investor community was expecting that the government would announce a fiscal package of as much as 3 trillion yuan to complement the latest monetary measures to boost growth, but the Chinese authorities unveiled a laughable amount of 200 billion yuan in spending for next year. The worry is that the Chinese will throw money into the market without targeting troubled areas, and the lack of a fiscal leg to the Chinese stimulus package will hardly address the major issues and improve the EM giant’s suffering fundamentals. Voila. This is why we see the CSI index down by 5% today. The selloff in the HSI is more reasonable, however, after an almost 10% plunge yesterday. Mining stocks, including BHP and Rio Tinto remained under a decent selling pressure in Australia, but the bleeding in copper and iron ore slowed, the metals were flat to slightly positive in the Asian session.
If we leave our emotions aside, there is hope that the Chinese government rectifies this misstep. Xi understood that he’d better have investors to play along than against him. As such, the Chinese stimulus story can’t end on a disappointing note, there should be more: more stimulus measures, but also be more uncertainty regarding the measures’ ability to reverse fortunes.
Getting ugly
Last week, the EU imposed 45% tariff on Chinese EVs – in a decision that was strongly contested by some European countries – like Germany, and some European carmakers like VW, as they knew that bringing such a massive tariff of Chinese car imports would result in retaliation from the Chinese authorities and would fire back on the European companies. And that’s exactly what happened. The Chinese authorities didn’t take long to announce that they will also put tariffs on European cars, brandy and luxury goods. The news didn’t resonate well across the European markets, but the losses in the Stoxx 600 remained limited to only 0.55% yesterday.
The selloff mainly concerned energy companies like Total and Eni, and their British and American peers as crude oil took a dive on disappointing fiscal spending plans from China.US crude tumbled below the $73pb level and is consolidating near the $74pb this morning. Some suggested that the possibility of a ceasefire in the Middle East helped accelerating yesterday’s selloff. I am little convinced when the first thing I see in the morning is how Israel’s response to Iran would be ‘significant’ (Bloomberg). Therefore, oil’s short-term risks remain tilted to the upside, while the long-term outlook is comfortably bearish due to ample global supply, prospects of weakening global demand, and sluggish Chinese growth until (and if) proven otherwise by the data.
Little concerned
Despite a 10% plunge in Hang Seng, the major US indices did well, yesterday. The S&P500 gained 1%, Nasdaq advanced 1.55% as Nvidia jumped 4% as the US 2-year yield eased below the 4% mark on balanced comments from the Federal Reserve (Fed) members. Some said the Fed should continue to focus on the employment market, while others said that the Fed should remain careful with the inflation leg. Overall, the comments and the economic data would justify a 25bp cut from the Fed in November, and that’s what the activity on Fed funds futures suggests today: a 88% chance of a 25bp cut.
But boy, these probabilities chance so rapidly. Due today, we will have a look at the latest FOMC meeting minutes to understand how and why the Fed opted for a 50bp cut at the latest meeting whereas they had the opportunity to start easing by a safe 25bp and avoid all that volatility, uncertainty and confusion around that decision. Then, we have a CPI update from the US scheduled for Thursday. If we see any undesired strength there, we could see the probability of a no cut take off as rapidly as the probability of a 50bp cut did last week.
Matching fundamentals and technicals
The US dollar index consolidates near a major Fibonacci level, the 38.2% retracement on summer retreat, near the 102.50 level. Parallelly, the EURUSD consolidates near its own major Fibonacci retracement level, 1.0980. A move above or below these levels, respectively, will send the US dollar into a medium-term bullish consolidation zone, and the euro into the medium-term bearish consolidation zone. A sufficiently soft US CPI update could prevent that from happening, while a stronger-than-expected read would leave little doubt about the view that the euro deserves to weaken from the actual levels. There is not much to prevent the European Central Bank (ECB) from announcing a few more rate cuts in the coming meetings to support the slowing European economies when headline inflation has fallen below their 2% target. Core inflation, however, is another story. But the fact is, I like when technicals match the fundamental story, and the US CPI will provide a good basis to justify a fresh move in the USD to one way or the other.
And speaking of central banks, the Reserve Bank of New Zealand (RBNZ) announced a 50bp cut today, as expected. The kiwi-dollar is testing the 200-DMA to the downside this morning, with a stronger case for a slide below the 60 cents level.
Swedish CPI Slightly Higher Than Expected – Supports Our -25 bp Call for November
In focus today
Tonight, FOMC will release the minutes from its September meeting. Markets will focus on any clues regarding the expected size of rate cuts aat the coming meetings.
Economic and market news
What happened overnight
The Reserve Bank of New Zealand (RBNZ) lowered interest rates by 50bp from 5.25% to 4.75%, which was nearly fully priced in the market. RBNZ still views monetary policy as being restrictive even though inflation has returned to the target rate. This message could signal potential further rate cuts going forward, which made NZD/USD drop around 0.7% from 0.613 at the announcement to around 0.609 this morning.
Chinese stocks fell on Wednesday in the onshore market ending a 10-day streak of positive returns. The Shanghai composite index is down over 5% this morning compared to Tuesday's closing price The onshore market was closed for longer during the week-long holiday, though, and has mainly played catch-up with offshore stocks after opening again. Hence the big decline today mostly reflects the sharp 10% sell-off in offshore stocks on Tuesday. Today offshore stocks declined further but by a more moderate 1.5%. The sharp correction in Chinese stocks follows a press briefing yesterday from the National Development and Reform Commission, which disappointed by not providing any details on fiscal stimulus as widely anticipated after the strong stimulus package announced ahead of the holiday. NDRC said the Chinese government is fully confident that it will reach its economic and social development goals for this year (5% growth) and said that some of the 2025-budget will be issued this year to support projects. The anticipation in the market is that more details on stimulus will be given later this month, which we also expect.
What happened yesterday
In Sweden, the new flash CPI for September came in marginally higher than expected. CPIF grew 1.2% y/y and CPIF ex energy at 2.0% y/y. We expected CPIF at 1.14% y/y and CPIF ex energy at 1.94% y/y in line with consensus and one tenth above the Riksbank's forecasts. Hence the print was higher than Riksbank forecast, so overall the print supports for our 25bp cut forecast at the next meeting.
In the Middle East, Israel's military said that it had deployed a fourth army division into Lebanon, which signals an expansion of the ground offensive against Hezbollah. Prime minister Netanyahu further claimed that the Israeli military has "eliminated" the successor leader of the Hezbollah movement after Nasrallah who was killed only two weeks ago in another attack by Israel.
In the US, NFIB Small Business Optimism index moved slightly higher in September to 91.5 from 91.2 in August. Firms reported less trouble finding new workers and a slight increase in hiring plans. Declining share of firms also report sufficient quality of available labour as their most important problem (which is still inflation for the largest share of businesses). Outlook for expansion, credit conditions and price plans remained steady. General uncertainty index reached its all-time-high, but the level is still comparable to the months leading up to 2016 and 2020 elections (= not alarmingly high). Overall, NFIB supports the notion that US economy remains on a steady footing for now.
Fed's Kugler (voting member), spoke about monetary policy, and said that she is ready to vote for further monetary policy easing if inflation continues to decrease.
In Germany, industrial production came in higher than expected at 2.9% m/m (consensus: 0.8% m/m, prior: -2.4% m/m) in August, on the back of especially higher production in the automotive industry.
ECB's Nagel spoke about monetary policy and said that he is open to considering another interest rate cut. This is interesting since Nagel has traditionally been considered too be an inflation hawk. Nagel said that ECB is clearly on the way to the 2% inflation target.
Oil prices slipped back. Weak demand, a stronger USD and lack of retaliation so far from Israel against Iran are likely the main reasons. We think oil prices will stay range bound close to USD 80/bbl as a rising geopolitical premium offsets weaker demand and stronger USD.
Equities: Global equities were higher yesterday, driven by a lift in US markets. Performance, both absolute and relative between regions, turned more or less upside down versus Monday, tempting one to declare a status quo. However, that is not entirely the case. Indeed, yields halted their upward trajectory, but utilities and REITs were significant underperformers again yesterday, while banks and tech ensured that both value and growth sectors performed adequately yesterday. Despite the multitude of factors at play these days, when we summarise the developments over a few weeks, we observe a generally positive reaction to the robust labour market data, including what we see in relative sector and style performance. It may also be pertinent to mention the performance of energy stocks yesterday; a glance at the oil price provides insight into the significant underperformance in that sector.
In the US yesterday, the Dow closed up by +0.3%, the S&P 500 by +1.0%, Nasdaq by +1.5%, and the Russell 2000 by +0.1%. Chinese markets are in focus again this morning. However, today they are experiencing negative performance, with both Hong Kong and especially mainland markets down sharply. The rest of Asia is higher, following the positive session on Wall Street yesterday. US futures are marginally lower, while European markets are mixed despite the uptick late in the US cash session yesterday. With fading optimism in China, there is also a negative impact on European exporters, particularly affecting high-end consumer brands.
FI: There were modest movements in global bond yields yesterday. 2Y and 10Y US Treasuries was trading in a tight range around 4%. We saw a similar picture in European government bond yields where there were also movement in yields. The Schatz-spread once again tightened, and we expect it will continue to tighten like the Bund ASW-spread. We still expect that the Bund ASW-spread will go towards 20bp before year-end.
FX: EUR/SEK ended the day fairly stable with a slight topside surprise to Swedish flash inflation data failing to provide support for the SEK. EUR/USD traded in a tight range with focus shifting to the release of inflation data tomorrow.
GBP/JPY Daily Outlook
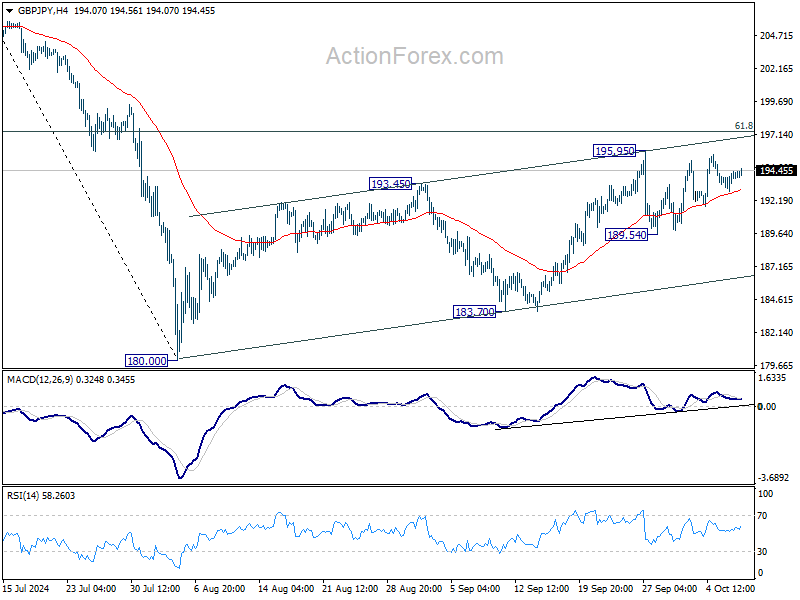
Daily Pivots: (S1) 193.27; (P) 193.83; (R1) 194.76; More...
Intraday bias in GBP/JPY remains neutral for the moment. On the upside break of 195.95 will resume whole rise from 180.00 to 61.8% retracement of 208.09 to 180.00 at 197.35 next. On the downside, break of 189.54 will turn bias back to the downside for 183.70 support instead.
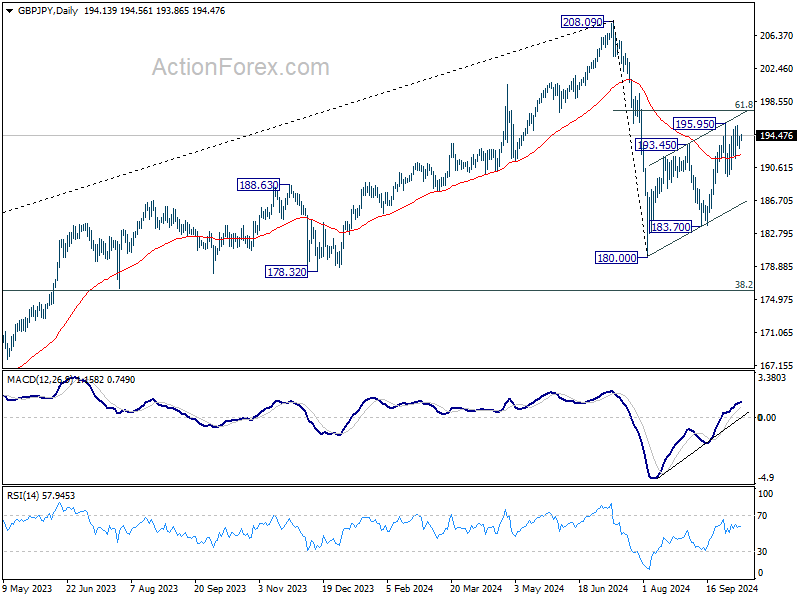
In the bigger picture, price actions from 208.09 are seen as a correction to whole rally from 123.94 (2020 low). The range of consolidation should be set between 38.2% retracement of 123.94 to 208.09 at 175.94 and 208.09. However, decisive break of 175.94 will argue that deeper correction is underway.
EUR/JPY Daily Outlook
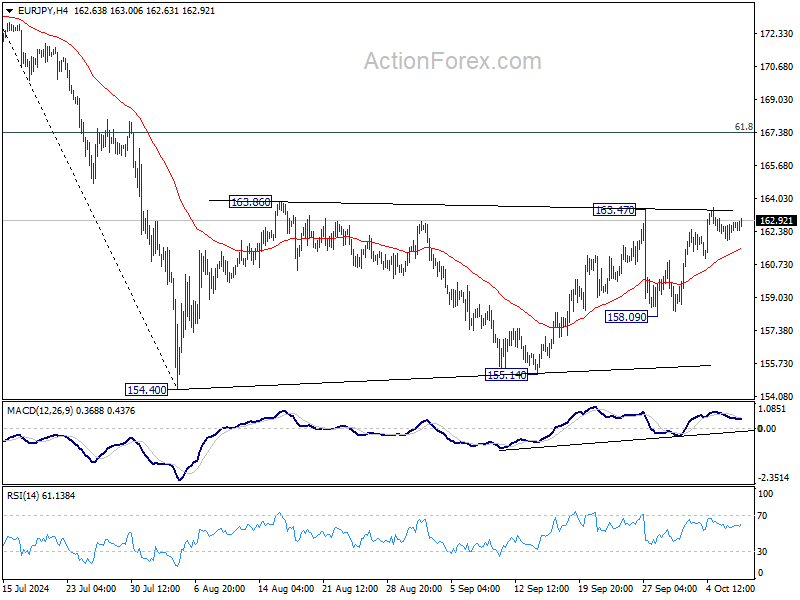
Daily Pivots: (S1) 162.04; (P) 162.62; (R1) 163.32; More....
Intraday bias in EUR/JPY remains neutral for the moment. On the upside, break of 163.47 resistance will resume the rebound from 154.40 to 61.8% retracement of 175.41 to 154.40 at 167.38. On the downside, break of 158.09 will bring deeper fall back to 154.40/155.14 support zone instead.
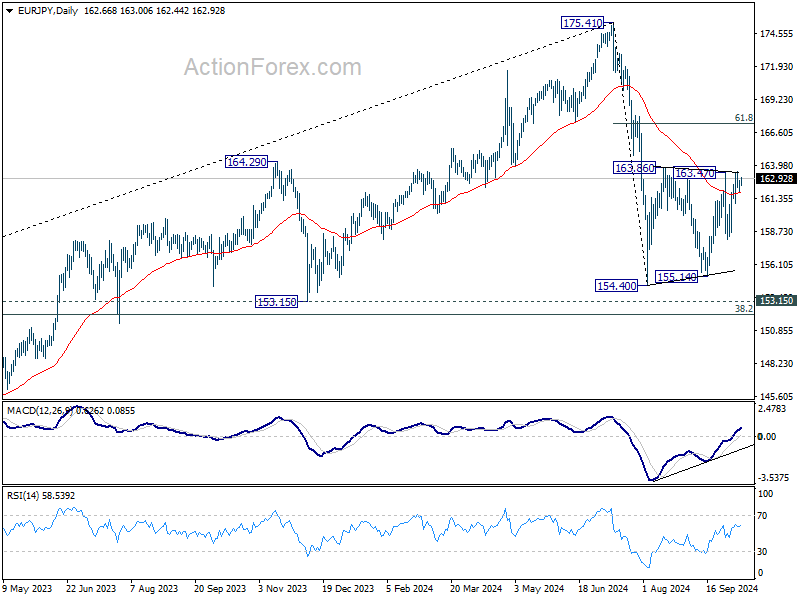
In the bigger picture, price actions from 175.41 are seen as correction to rally from 114.42 (2020 low). The range of consolidation should have been set between 38.2% retracement of 114.42 to 175.41 at 152.11 and 175.41 high. However, decisive break of 152.11 would argue that deeper correction is underway.
EUR/GBP Daily Outlook
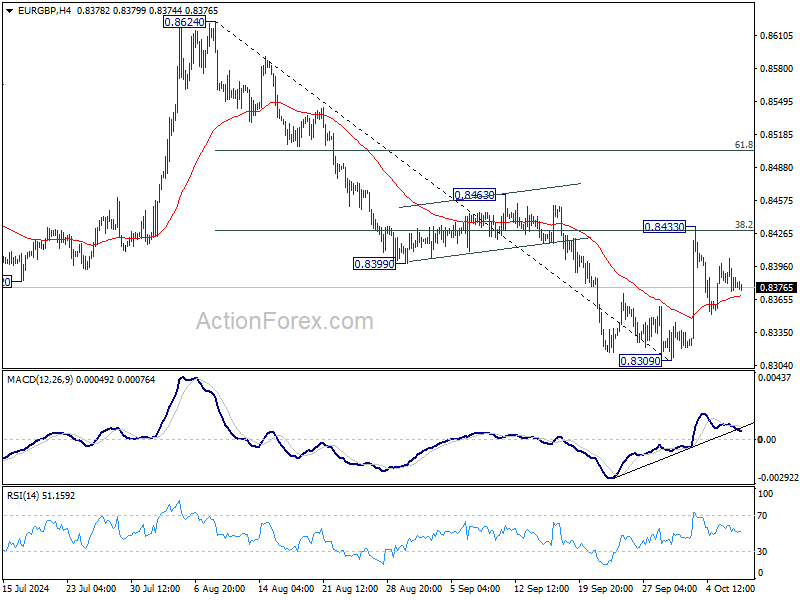
Daily Pivots: (S1) 0.8367; (P) 0.8386; (R1) 0.8398; More...
Intraday bias in EUR/GBP remains neutral and outlook stays bearish for now. On the downside, break of 0.8309 will resume larger down trend to 0.8201 key support next. However, decisive break of 38.2% retracement of 0.8624 to 0.8309 at 0.8429 will pave the way to 61.8% retracement at 0.8504 and possibly above.
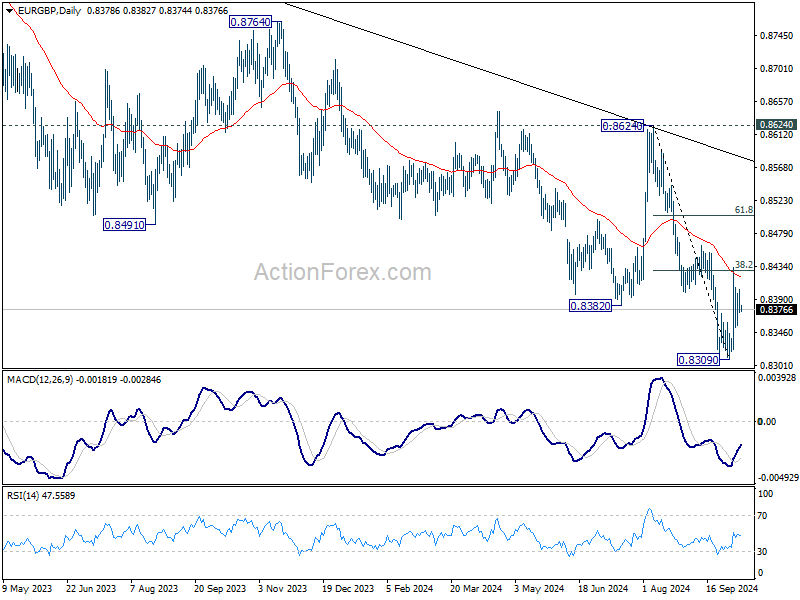
In the bigger picture, down trend from 0.9267 (2022 high) is in progress. Next target is 0.8201 (2022 low), but strong support should be seen there to bring rebound. However, outlook will remain bearish as long as 0.8624 resistance holds even in case of strong rebound.
EUR/AUD Daily Outlook
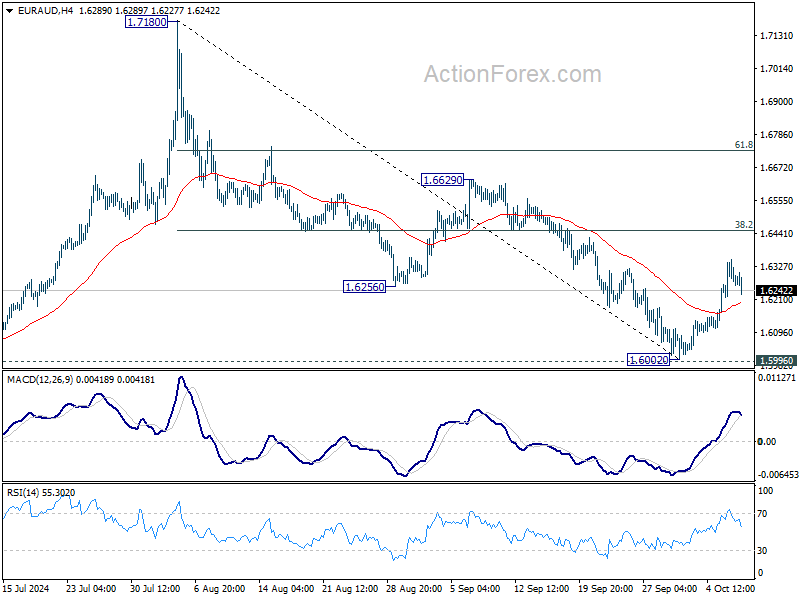
Daily Pivots: (S1) 1.6212; (P) 1.6283; (R1) 1.6345; More...
EUR/AUD's rebound from 1.6002 short term bottom is expected to continue to 38.2% of 1.7180 to 1.6002 at 1.6452. Decisive break there will strengthen the case that whole corrective fall from 1.7180 has completed with three waves down to 1.6002. Further rally should then be seen to 61.8% retracement at 1.6730 next. However, firm break of 55 4H EMA (now at 1.6198) will dampen this view and bring retest of 1.6002 low instead.
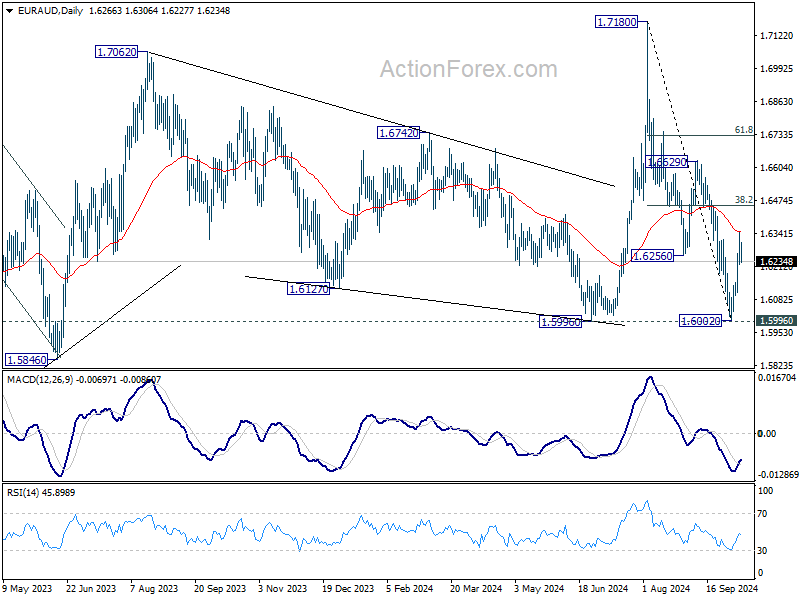
In the bigger picture, as long as 1.5996 support holds, up trend from 1.4281 (2022 low) is still expected to resume at a later stage. However, decisive break of 1.5996 will argue that the medium term trend has reversed and turn outlook bearish.
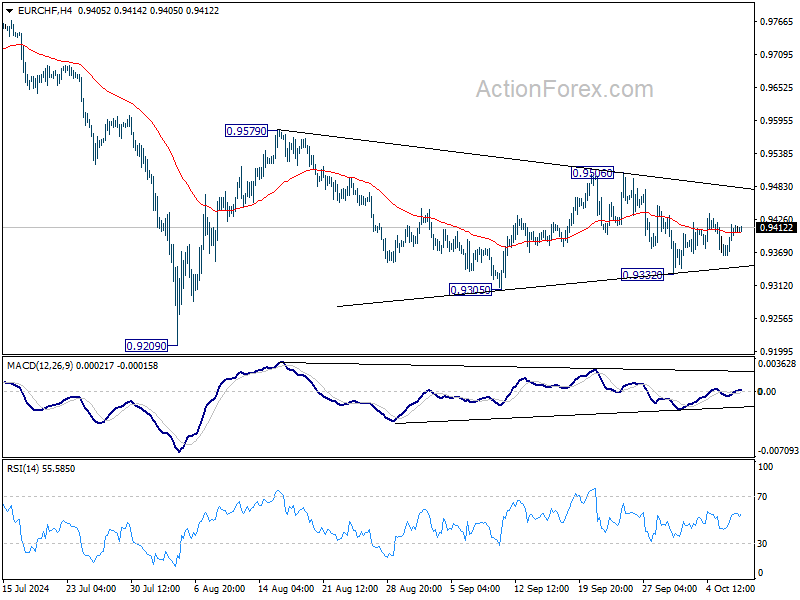
EUR/CHF Daily Outlook
Daily Pivots: (S1) 0.9381; (P) 0.9399; (R1) 0.9433; More....
EUR/CHF continues to trade in converging range and intraday bias stays neutral. For now, the favored case is that rise from 0.9209 low is not finished yet. Break of 0.9506 will turn intraday bias to the upside for 0.9579 resistance and above. However, break of 0.9332 will dampen this view and bring deeper decline through 0.9305 support instead.
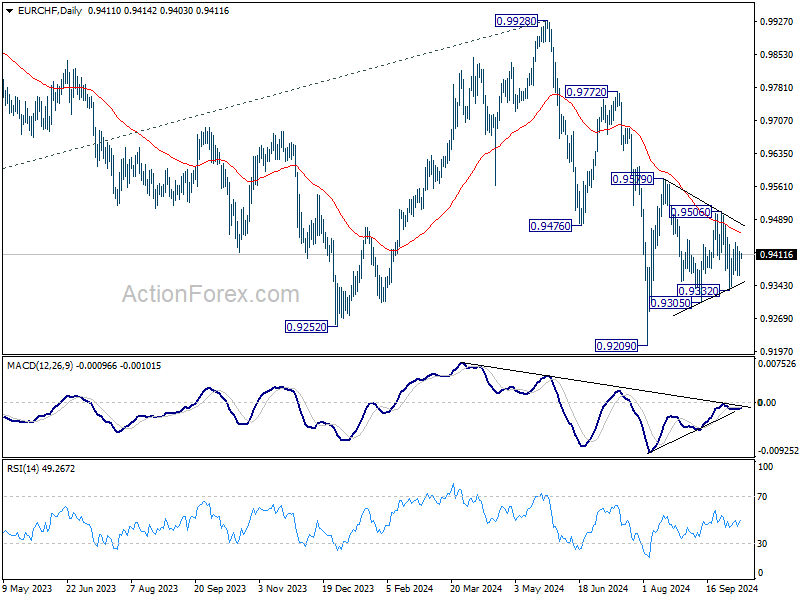
In the bigger picture, medium term corrective pattern from 0.9407 (2022 low) might have completed with three waves to 0.9928. Decisive break of 0.9252 (2023 low) will confirm long term down trend resumption. Next target will be 61.8% projection of 1.1149 to 0.9407 from 0.9928 at 0.8851. For now, outlook will stay bearish as long as 0.9928 resistance holds, even in case of strong rebound.
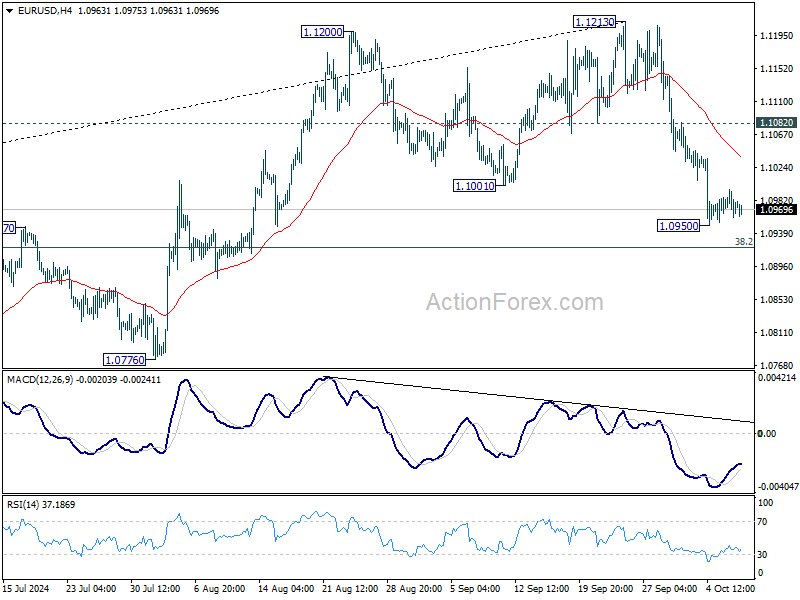
EUR/USD Daily Outlook
Daily Pivots: (S1) 1.0962; (P) 1.0980; (R1) 1.0998; More....
Intraday bias in EUR/USD remains neutral for consolidations above 1.0950 temporary low. Fall from 1.1213 short term top is expected to continue as long as 1.1082 resistance holds. Below 1.0950 will target 38.2% retracement of 1.0447 to 1.1213 at 1.0920. Sustained break there will argue that fall from 1.1213 is the third leg of the corrective pattern from 1.1274. In this case, deeper decline would be seen to 61.8% retracement at 1.0740 next.
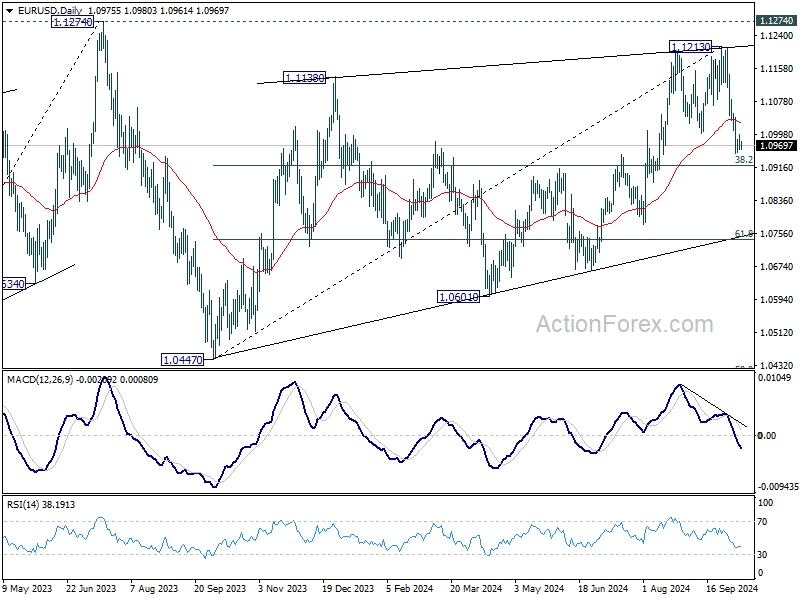
In the bigger picture, rejection by 1.1274 resistance suggests that corrective pattern from 1.1274 (2023 high) is not completed yet. Instead, decline from 1.1213 might be another falling leg. Sustained break of 55 W EMA (now at 1.0877) will validate this case, and bring deeper fall towards 1.0447 support again.
GBP/USD Daily Outlook
Daily Pivots: (S1) 1.3074; (P) 1.3094; (R1) 1.3124; More...
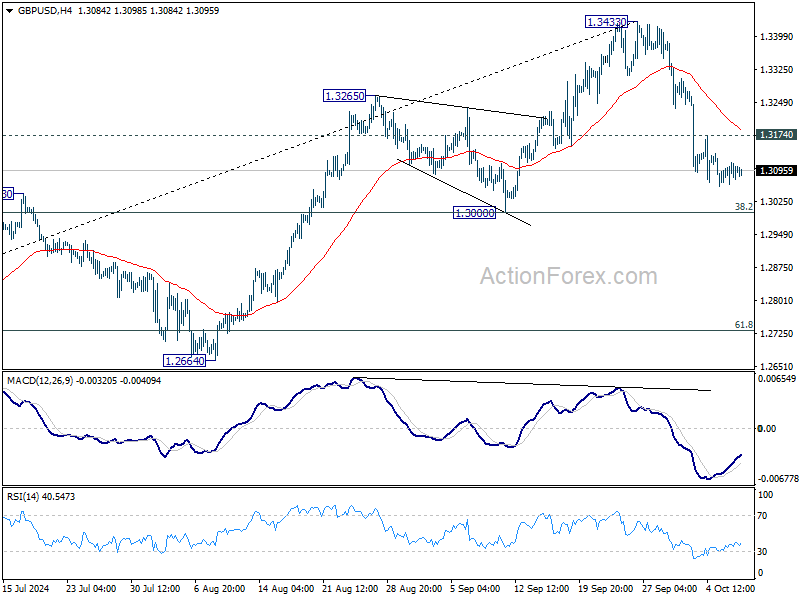
Intraday bias in GBP/USD is turned neutral with loss of downside momentum as seen in 4H MACD. While corrective fall from 1.3433 might extend lower, strong support should be seen from 1.3000 cluster support (38.2% retracement of 1.2298 to 1.3433 at 1.2999) to contained downside. Above 1.3174 minor resistance will turn bias back to the upside for stronger rebound. However, decisive break of 1.3000 will carry larger bearish implications.
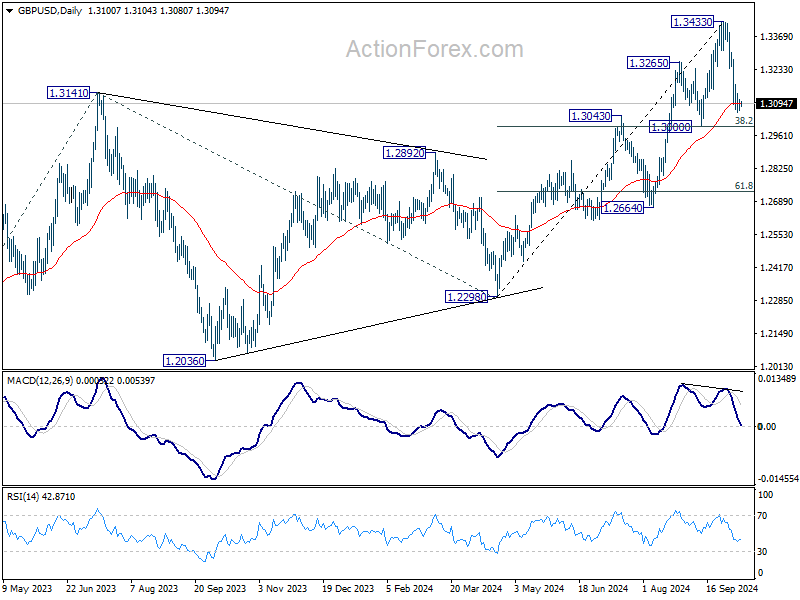
In the bigger picture, as long as 1.3000 support holds, the up trend from 1.0351 (2022 low) is still in progress. Next target is 61.8% projection of 1.0351 to 1.3141 from 1.2298 at 1.4022. However, considering mild bearish divergence condition in D MACD, decisive break of 1.3000 will argue that a medium term top is already in place, and bring deeper fall back to 1.2664 support next.
USD/CHF Daily Outlook
Daily Pivots: (S1) 0.8541; (P) 0.8562; (R1) 0.8595; More…
Intraday bias in USD/CHF remains neutral for consolidations below 0.8606 temporary top. Further rise is in favor as long as 0.8499 minor support holds. Above 0.8606 will target 38.2% retracement of 0.9223 to 0.8374 at 0.8698. Sustained break there will argue that fall from 0.9223 has completed after defending 0.8332 low. Next target will be 61.8% retracement at 0.8899. On the downside, break of 0.8499 will turn bias back to the downside for retesting 0.8374 low instead.

In the bigger picture, price actions from 0.8332 (2023 low) are currently seen as a medium term corrective pattern, with fall from 0.9223 as the second leg. Strong support could be seen from 0.8332 to bring rebound. Yet, overall outlook will continue to stay bearish as long as 0.9243 resistance holds. Firm break of 0.8332, however, will resume larger down trend from 1.0146 (2022 high).
