Sample Category Title
Fed’s Goolsbee: Declaring inflation victory now is premature, akin to counting the chickens
Appearing in CBS's Face the Nation on Sunday, Chicago Fed President Austan Goolsbee acknowledged the significant progress made in 2023 but tempered expectations with a note of caution, emphasizing that the fight against inflation is far from over. His stated, "I still caution everyone, it's not done". As he also noted, "data is going to drive what's going to happen to rates,"
Discussing the scenario of "soft landing" for the economy, Goolsbee expressed caution, deeming it premature to claim victory in this regard. He projected that 2023 would likely witness a significant reduction in inflation, coupled with a stable unemployment rate. Referring to this balance as "the golden path".
In his words, Goolsbee conveyed a message of continued vigilance. He cautioned against premature celebration, using the metaphor of "counting the chickens" to emphasize the need for consistent evidence of economic recovery.
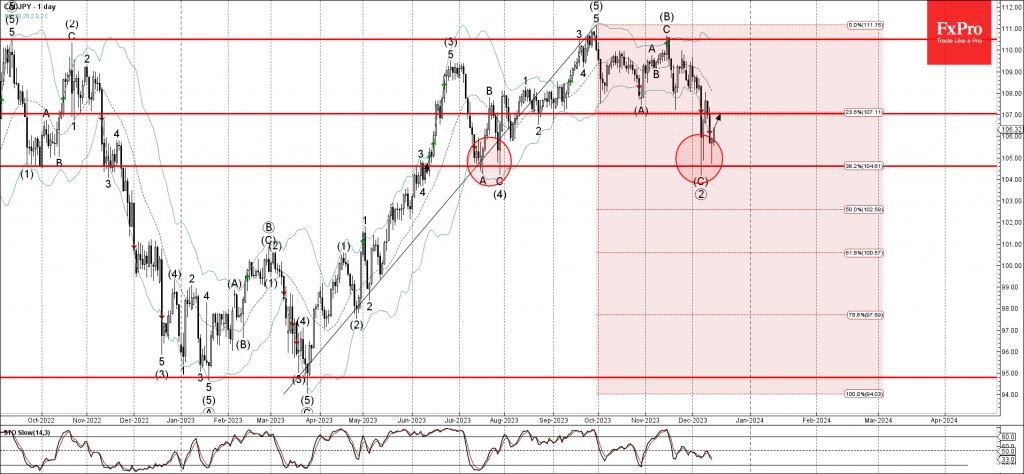
CADJPY Wave Analysis
- CADJPY reversed from support level 104.60
- Likely to rise to resistance level 107.00
CADJPY today reversed up from the key support 104.60 (which has been repeatedly reversing the price from July) standing below the lower daily Bollinger Band.
The key support 104.60 was strengthened by the 38.2% Fibonacci correction of the upward impulse from March.
Given predominant uptrend, CADJPY currency pair can be expected to rise to the next resistance level 107.00 (former support from August).
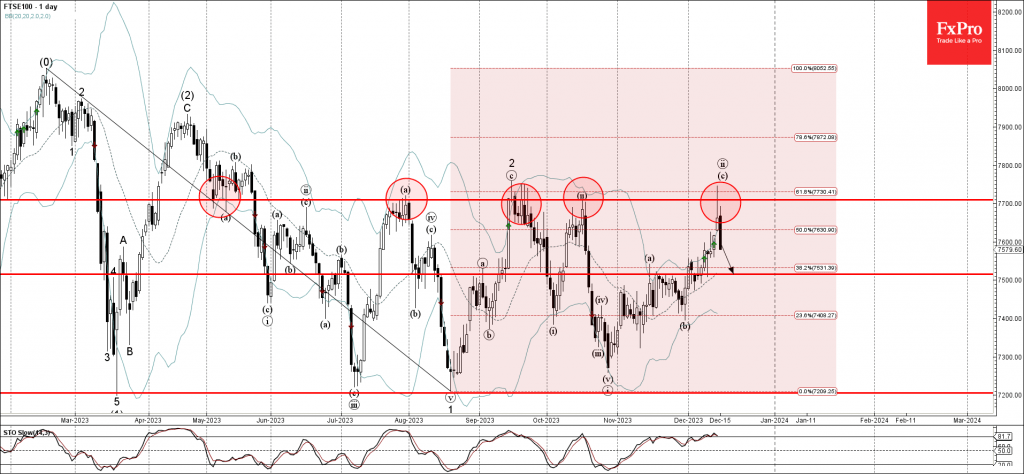
FTSE 100 Wave Analysis
- FTSE 100 reversed from resistance level 7700.00
- Likely to fall to support level 7500.00
FTSE 100 index under the bearish pressure after the index reversed down from the resistance level 7700.00 (which has been reversing the index from June) standing above the upper daily Bollinger Band.
The resistance level 7700.00 was strengthened by the coinciding 61.8% Fibonacci correction of the downward impulse from April.
Given strength of the resistance level 7700.00 and the overbought daily Stochastic, FTSE 100 can be expected to fall further to the next support level 7500.00.
Forex and Cryptocurrencies Forecast
EUR/USD: Dovish Fed Reversal
The fate of EUR/USD was determined by two events last week: the FOMC (Federal Open Market Committee) meeting of the US Federal Reserve and the meeting of the Governing Council of the European Central Bank (ECB), which took place a day later. As a result, the euro emerged victorious: for the first time since November 29, the pair rose above 1.1000.
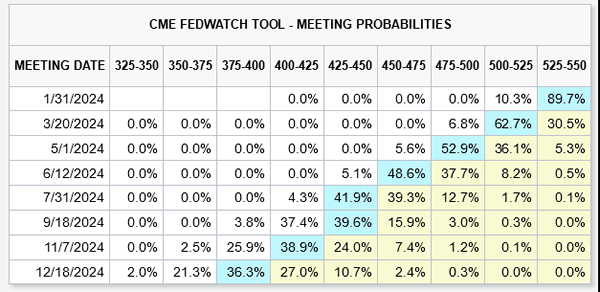
The Federal Reserve left its key interest rate unchanged at 5.5%. Meanwhile, the regulator's leadership acknowledged that it is discussing easing its monetary policy. The FOMC's forecast for the foreseeable future turned out to be significantly lower than market expectations. It is planned that by the end of 2024, the rate will be reduced at least three times: to 4.6% (instead of the expected 5.1%), and by the end of 2025, there are plans for four more stages of reduction, ultimately bringing the cost of borrowing down to 3.6% (expectations were 3.9%). In a three-year perspective, the rate will drop to 2.9%, after which in 2027 it will be 2.0-2.25%, while inflation will stabilize at the target level of 2.0%. Following the meeting, the market expects the Fed to take its first step towards easing as early as March. According to the FedWatch Tool, the likelihood of this scenario is currently estimated at 70%.
In addition to forecasts of a sharper rate cut, additional pressure on the dollar continues to be exerted by the declining yields of Treasuries, which also indicates an imminent change in the direction of monetary policy in the USA. Another confirmation of the dovish pivot was the reaction of the stock markets. Lower rates are good news for stocks. They lead to cheaper financing, and easier economic conditions stimulate domestic demand. As a result, last week the stock market indices S&P 500, Dow Jones, and Nasdaq soared again.
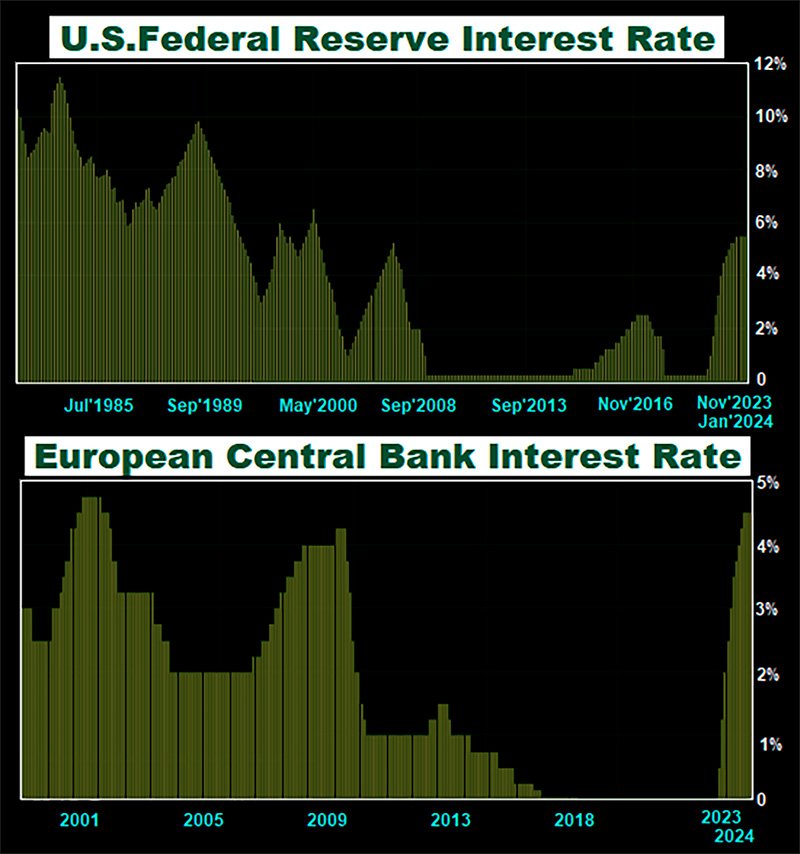
It is known that ECB President Christine Lagarde was previously involved in synchronized swimming. This time, she acted in sync with the Fed: the pan-European regulator also left the interest rate unchanged, at the previous level of 4.50%. However, the ECB expects the Eurozone's GDP to grow by only 0.6% in 2023, compared to the previously forecasted 0.7%, and by 0.8% in 2024 instead of 1.0%. Inflation in 2024 is forecasted at 5.4%, in 2024 at 2.7%, and in 2025 it is expected to almost reach the target mark of 2.1% (two years earlier than in the US).
The desynchronization with the Fed occurred following the Governing Council's meeting. In their comments, the ECB leadership did not mention the timing of the start of rate cuts. Moreover, it was stated that the European Central Bank's goal is to suppress inflation, not to avoid a recession, so borrowing costs will be kept at peak values as long as necessary. This stance benefited the pan-European currency and strengthened the euro relative to the dollar.
Given the Fed's dovish rhetoric and the ECB's moderately hawkish stance, EUR/USD may retain potential for further growth. It's worth noting that this pivot by the Fed surprised not only the markets. According to an insider report from Financial Times, Jerome Powell's comments following the FOMC meeting also caught the ECB Governing Council off guard. As a result, during her speech, Madame Lagarde threw several stones into the garden of her American colleague.
Currently, it appears that the Fed will lead in easing monetary policy. If the market does not receive a contrary signal, the dollar will remain under pressure. However, it's important to consider that the reality of 2024 may not necessarily align with statements made in December 2023. Objectively, the ECB has significantly more reasons for loosening its financial grip. The European economy is poorly adapted to high rates, it appears weaker than the American economy, its GDP volume has already been revised downward, and the reduction in inflation in the Eurozone is occurring much more rapidly than in the USA. Based on this, economists from Fidelity International, JPMorgan, and HSBC do not rule out that everything may change, and other regulators such as the ECB and the Bank of England may be the first to embark on a path of easing. However, we will not receive signals about this today or tomorrow, but only in the next year.
Regarding the past week, after the release of disappointing business activity data (PMI) in Europe on December 15th and mixed results in the US, EUR/USD ended the week at 1.0894.
According to economists from MUFG Bank, a sharp further rise in EUR/USD is on shaky ground. "The situation in the Eurozone and globally does not seem favourable for a further sustainable rally in EUR/USD," they write. "Fundamental factors as a driving force over the next few weeks during the Christmas and New Year period are never reliable, but if this rally continues during this period, we expect a reversal as we move towards the first quarter of next year."
At present, expert opinions regarding the near future of the pair are divided as follows: 40% voted for a strengthening dollar, 30% sided with the euro, and 30% remained neutral. Among trend indicators on D1, 100% are voting for the euro and the pair's rise. With oscillators, 60% are in favour, 30% are looking south, and 10% are pointing east. The nearest support for the pair is located around 1.0800-1.0830, followed by 1.0770, 1.0725-1.0740, 1.0620-1.0640, 1.0500-1.0520, 1.0450, 1.0375, 1.0200-1.0255, 1.0130, and 1.0000. Bulls will encounter resistance around 1.0925, 1.0965-1.0985, 1.1020, 1.1070-1.1110, 1.1150, 1.1230-1.1275, 1.1350, and 1.1475.
Next week, both Europe and the United States will be summarizing the year and preparing for Christmas. Notable economic events include the release of inflation data (CPI) in the Eurozone on Tuesday, December 19. On Wednesday, December 20, the U.S. Consumer Confidence Index will be published. The following day, the U.S. GDP volume for the third quarter and the number of initial jobless claims will be announced. The work week concludes on Friday, December 22, with a comprehensive package of data on the U.S. consumer market.
GBP/USD: BoE Refrains from Feeding Doves
Just as with the Fed and the ECB, the situation with the Fed and the Bank of England (BoE) is completely aligned. A simple copy-paste of the earlier discussion applies here. In its meeting, the British regulator also left the interest rate unchanged at 5.25%. And like the ECB, it did not provide any reason that could spur dovish expectations for 2024. BoE Governor Andrew Bailey noted that the Bank of England still has a path to tread, and three out of the nine members of the Monetary Policy Committee even voted for a further increase in the rate.
The economic indicators for the United Kingdom are varied. According to statistics, the real wage growth, adjusted for inflation, continues to increase annually. However, while the economy was forecasted to grow by 0.1%, it actually contracted by 0.3%, following a growth of 0.2% the previous month. Additionally, industrial production volumes in October decreased by 0.8%, and the annual figure dropped from 1.5% to 0.4%, significantly worse than the market's expectation of 1.1%. Data released on Friday, December 15th, showed a significant improvement in service sector activity in December. The PMI index reached 52.7, exceeding expectations of 51.0 and marking the best figure in the last five months. However, on the other hand, manufacturing activity in November decreased to 46.4 from 47.2, even though markets were expecting it to rise to 47.5.
Meanwhile, "the inflation genie is still out of the bottle." Based on this, the Bank of England is unlikely to abandon its strict monetary policy, which remains the only barrier to further inflation growth. Experts agree on this point. The only open question is when the regulator will finally be able to reduce the rate.
The last chord of the past week for GBP/USD sounded at the level of 1.2681. According to economists at ING, the 1.2820-1.2850 area poses strong resistance for GBP/USD. If this is breached, they believe, the pair could reach the heights of 1.3000, which would be a huge Christmas gift for the bulls. However, the team at Japan's Nomura Bank is quite sceptical about the growth prospects of the pair, believing that in both Q1 and Q2 of 2024, the pair will trade around 1.2700 and 1.2800.
At the time of writing this forecast, the median forecast of analysts offers no clear guidance: 25% voted for the pair's rise, another 25% for its fall, and 50% simply shrugged their shoulders. Among trend indicators on D1, as in the case of the previous pair, 100% point north. Among the oscillators, 65% look up, 30% down, and the remaining 15% maintain neutrality. In the event of the pair moving south, it will encounter support levels and zones at 1.2600-1.2625, 1.2545-1.2575, 1.2500-1.2515, 1.2450, 1.2370, 1.2330, 1.2210, 1.2070-1.2085, 1.2035. In case of an increase, the pair will meet resistance at levels 1.2710-1.2535, then 1.2790-1.2820, 1.2940, 1.3000, and 1.3140.
The upcoming week's calendar highlights Wednesday, December 20, as a significant day, when the United Kingdom's Consumer Price Index (CPI) will be published. On Friday, December 22, the day will be shorter in the UK due to Christmas preparations. However, that morning will see the release of significant economic macrostatistics, including data on retail sales and GDP.
USD/JPY: Yen's Triumph Scheduled for 2024
On November 13, USD/JPY reached a high of 151.90. However, within a mere five weeks, the Japanese yen succeeded in regaining over 1000 points from the dollar. Thursday, December 7, marked a significant triumph for the yen, as it strengthened across the entire market, moving the dollar down by about 225 points. At that moment, the pair's minimum was recorded at 141.62. In the past week, it followed the lead of the Fed and the Dollar Index DXY, ending the five-day stretch at a level of 142.14.
The primary reason for this yen rally has been growing expectations that the Bank of Japan (BoJ) will finally abandon its negative interest rate policy, and this is anticipated to happen sooner than expected. Rumours suggest that regional banks in the country, lobbying for a departure from yield curve control policy, are pressuring the regulator. Seemingly to confirm these rumours, the BoJ conducted a special survey in early December among market participants to discuss the consequences of moving away from ultra-loose monetary policy and the side effects of such a step.
The yen is also being favoured by the outcomes of the recent meetings of the Fed and the ECB, which have reinforced market confidence that interest rates for the dollar and euro have plateaued and are only expected to decrease going forward. This divergence allows for the prediction that investors will unwind their carry trade strategies and reduce the yield spreads between Japanese government bonds and their counterparts in the US and Eurozone. Such developments should lead to a return of capital to the yen.
The Bank of Japan's (BoJ) final meeting of the year is scheduled for Tuesday, December 19. However, it is likely that the regulator will keep its monetary policy parameters unchanged at this meeting. Economists at Japan's MUFG Bank expect the BoJ to end its YCC (Yield Curve Control) and NIRP (Negative Interest Rate Policy) at its January meeting. This is partially already factored into the quotes, but the tone of the Bank of Japan at the December meeting could further fuel expectations for a tightening of policy in 2024. MUFG believes that the yen has the greatest potential for growth among G10 currencies next year. "The global inflationary shock is reversing direction, and this has the most significant implications for the JPY," say the bank's strategists.
In the near term, 30% of experts anticipate further strengthening of the yen, 10% favour the dollar, and a substantial majority (60%) hold a neutral position. Regarding trend indicators on D1, there's again an absolute dominance of the red color, 100%. Among the oscillators, the same 100% are colored red, but 25% of them signal oversold conditions. The nearest support level is located in the 141.35-141.60 zone, followed by 140.60-140.90, 138.75-139.05, 137.25-137.50, 135.90, 134.35, and 131.25. Resistance levels and zones are situated at 143.75-144.05, followed by 145.30, 146.55-146.90, 147.65-147.85, 148.40, 149.20, 149.80-150.00, 150.80, 151.60, and 151.90-152.15.
Apart from the Bank of Japan's meeting on December 19 and the subsequent press conference by its leadership, no other significant events concerning the Japanese economy are expected in the coming week.
CRYPTOCURRENCIES: Will Bitcoin ETFs Replace Binance?
By the end of Friday, December 8, the leading cryptocurrency, bitcoin, reached a height of $44,694. It last traded above $40,000 in April 2022. Just two days later, on the morning of December 11, surprised investors found bitcoin at the $40,145 mark, leading to immense disappointment.
The rapid price decline lasted no more than 5 minutes. Several theories explain this event. One theory is that the trigger was the strong U.S. labour market data released on December 8. Another possibility is that it was either a nervous reaction or a technical error in trade volume, possibly made by a trading bot or a trader, leading to a cascade of protective stop executions in the futures market. According to Coinglass, over 24 hours, more than $400 million in long positions were liquidated, including $85.5 million in bitcoin.
Our analysis suggests that the most realistic explanation is as follows: since mid-August, bitcoin had grown by about 85% and more than 160% since the beginning of the year. It appears that some major players, in anticipation of the year's end, decided to lock in profits. Notably, two days before this incident, DecenTrader's head, known as FibFilb, had warned: "We have grown significantly this year, and a correction is expected. [...] It has been long overdue," he stated on December 9.
The negative sentiment may have been amplified by news that a $4.3 billion fine had not resolved the issues the crypto exchange Binance is facing. The U.S. Securities and Exchange Commission (SEC) continues to press charges against the exchange for illegal trading of securities and other violations.
U.S. Department of Justice officials intend to thoroughly scrutinize the trading platform's operations to determine compliance with legislative standards. The exchange will be compelled to grant continuous access to all its documents and records, including information related to the company's employees, agents, intermediaries, consultants, partners, and contractors, as well as traders, to representatives of the Department of Justice, the Financial Crimes Enforcement Network, and all other financial regulators and law enforcement agencies.
Last week, former SEC head John Reed Stark published an opinion on the potential demise of Binance, referencing the U.S. government's official demands to the platform. The list of these demands alone spanned 13 pages of typescript, including procedures that have never before been applied to companies. This led Stark to sardonically refer to the situation as a "financial colonoscopy."
It is noteworthy that attacks on Binance in 2023 led to a decline in its share of the spot market from 55% to 32%. In the derivatives market, its share is 47.7%, marking the worst performance since October 2020.
Discussing the intensification of regulatory pressure, JPMorgan CEO Jamie Dimon stated that if he were the U.S. government, he would "damn well ban all digital currencies for aiding fraudsters and terrorists." Yet, the U.S. authorities haven't taken such measures. Why?
There's a famous saying attributed to the Italian thinker, politician, and philosopher Niccolò Machiavelli: "If you can't beat the crowd, lead it." He voiced it about 500 years ago, but it remains relevant today. For instance, despite all prohibitions, the Chinese continue to be a significant and active part of the crypto industry. The U.S. seems to have considered that instead of banning digital assets, cutting off the internet, and confiscating computers and smartphones, it's easier to lead and control this process. Hence, experts believe, the idea of exchange-traded spot bitcoin ETFs was born. Such funds will allow for monitoring crypto investors, studying their transactions, and not only collecting taxes from them but also determining the legality of these transactions. Therefore, the logic of the officials here is quite clear. And in this rare case, millions of small investors also applaud this process, hoping that their investments will significantly increase thanks to BTC-ETFs and regulatory pressure.
Returning to the events of December 11, trader, analyst, and founder of the venture company Eight, Michael Van De Poppe, urged the community "not to worry." He explained that corrections happen, especially deep ones in the illiquid altcoin market. In light of what occurred, the analyst made his forecast for the change in bitcoin's price. According to his analysis, the key support zone on higher time frames is currently in the $36,500-38,000 range. "Bitcoin's momentum is gradually coming to an end, and Ethereum will easily take the lead in the next quarter," he added.
Crypto expert William Clemente is also unworried about the decrease in bitcoin's price, deeming it inevitable. In his view, such a correction serves as a solid foundation for the start of the next bullish trend, as it eliminates long positions opened by greedy traders using leverage.
Eli Taranto, Director at EQI Bank, agrees with Van De Poppe's prediction and also foresees a decline in bitcoin's value. "As traders lock in profits and await decisions on ETF applications, bitcoin's price will continue to fluctuate, subject to the butterfly effect [a phenomenon where a small change in a system can have large and unpredictable consequences, even in a completely different location]. A drop in BTC price to $39,000 is clearly possible," noted Taranto.
Indeed, the Director of EQI Bank is correct: bitcoin did continue to "fluctuate in the wind," as evident from the BTC/USD chart before and after the last week's Fed meeting in the U.S. As a result, aided by a weakening dollar, the pair moved upwards again, reaching a high of $43,440 on Wednesday, December 13.
As of writing this review, on the evening of December 15, it is trading around $42,200. The total market capitalization of the crypto market stands at $1.61 trillion, down from $1.64 trillion a week ago. The Crypto Fear & Greed Index has dropped from 72 to 70 points and remains in the Greed zone.
Regarding the near future of digital gold, investment banking giant Goldman Sachs' experts recently published a new report suggesting that bitcoin's quotations could continue to rise in the near term. CryptoQuant analysts have entertained the possibility of bitcoin breaking the $50,000 level at the start of 2024. This forecast is based on an analysis of BTC holder activity and also takes into account the dynamics of transaction volume, market capitalization, and Metcalfe's Law in the context of cryptocurrencies. "Bitcoin could be targeting the $50,000-$53,000 range," the experts noted.
However, CryptoQuant believes that the market is currently approaching an "overheated bullish phase," which historically is accompanied by pauses and corrections. The analysts emphasized that the volume of "in the money" coin supply exceeds 88%. This indicates potential selling pressure and, therefore, probable short-term corrections. According to their observations, such high levels of unrealized profit "historically coincided with local peaks."
To conclude, let's reflect on another historic event - a time when digital gold was trading at $0.20. Thirteen years ago, on December 12, 2010, the creator of the first cryptocurrency, known by the pseudonym Satoshi Nakamoto, published his last post on a forum before disappearing from the public eye. The message did not hint at the departure of this enigmatic figure. It contained a description of an update and code for Denial-of-Service (DoS) management elements. Some experts believe that the blockchain founder had planned to leave the team due to disputes and disagreements within the developer collective and criticism for excessive control over the project and unilateral decision-making.
Regardless, as one user on the BitcoinTalk forum noted while recalling the last post of the cryptocurrency's creator, "Satoshi's contribution to decentralization and his fight against financial dictatorship is more than just a technological marvel. It's a movement for economic freedom and sovereignty. [...] His disappearance is not just an act of self-preservation but also a reminder that not everything in life revolves around personal fame."
Risk-On Wave Sweeps Markets, Stocks Hit Records, Dollar Declines
The financial markets concluded last week on a robust risk-on sentiment, driven primarily by the flurry of central bank activities. The stock markets, in particular, resonated with a bullish tone, cementing their position after Fed's dovish shift. This sentiment propelled key indices like the DOW, DAX, and CAC to new record highs. Despite a mild retreat towards the end of the week, these indices maintained their elevated levels, underscoring the market's positive response.
In the currency markets, the US Dollar emerged as the weakest performer, significantly influenced by the Fed's projection of a cumulative 75 basis points rate cut for the next year. This shift in Fed's stance considerably affected Dollar's standing against its counterparts.
While European currencies also gained against the Dollar, they lagged behind other major currencies. ECB's and BoE's resistance to the speculation of imminent rate cuts did not significantly impact market sentiments, as their messages appeared to fall on deaf ears.
Japanese Yen stood out as the strongest currency and is poised for further near-term rally, heavily contingent on the upcoming BoJ policy decision. Australian Dollar led commodity currencies as the next strongest and could see a further rally if the risk-on sentiment persists.
Fed signals rate cuts, ECB and BoE take a cautious stance
Fed's "spectacular" dovish pivot last week, as marked by its new economic projections, had a significant impact on the financial markets. These projections indicate a substantial easing of monetary policy in 2024, with a forecasted total rate cut of 75 bps. This adjustment would bring federal funds rate down from its current range of 5.25-5.50% to a much lower bracket of 4.50-4.75%.
The market's response to this prospective easing has been swift and decisive. Fed fund futures, a key indicator of market sentiment and expectations, now reflect 58.5% probability of the first 25bps rate cut occurring as soon as May 2024. However, the market sentiment doesn't stop there. Traders are pricing in an even more aggressive easing trajectory, with over 75% chance that Fed will further reduce its interest rate to a range of 3.75-4.00% by the end of next year. This anticipated move would mark a dramatic 150bps decrease from the current rate.
In contrast to Fed's apparent readiness to ease monetary policy, ECB and BoE adopted a more cautious approach, resisting the immediate speculation of rate cuts in their respective regions.
Despite the differing monetary stances, it appears almost certain that both the ECB and BoE will embark on policy loosening in the coming year, albeit at an undetermined pace and magnitude. The latest round of PMI data from Eurozone and UK provides some context for this outlook. The data suggests continued contraction in Eurozone's manufacturing and services sectors, while UK's economic growth remains stagnant.
The question is just on who's first and who's faster in cutting interest rates.
DOW, DAX and CAC hit new record highs
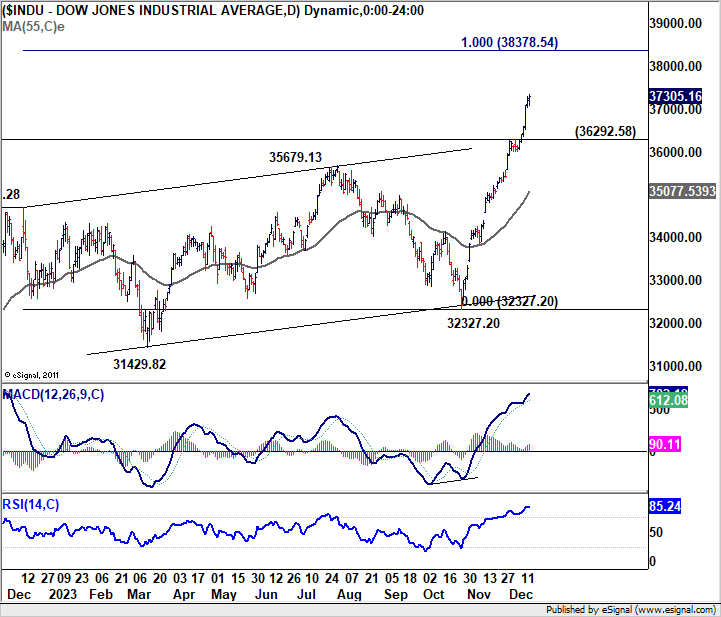
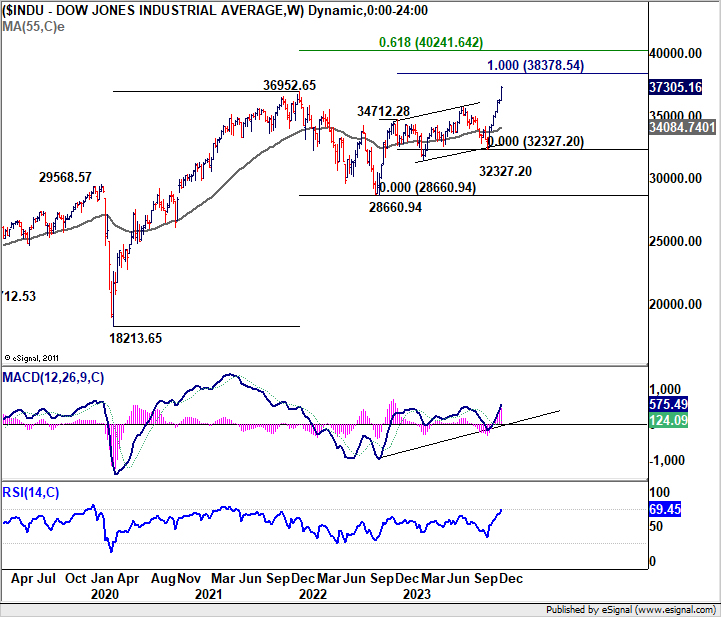
The anticipation of monetary easing has led to strong rally in global equity markets. DOW, DAX, and CAC all reached new record highs last week. From a technical standpoint, the near-term outlook for DOW remains bullish as long as the 26292.58 support holds. Next target is 100% projection of of 28660.94 to 34712.28 from 32327.20 at 38378.54.
The key question for DOW is whether it can maintain enough momentum to quickly reach 40k level, which is close to medium term target of 61.8% projection of 18213.65 (2020 low) to 3695.65 (2022 high), from 28660.94 (2022 low) at 42041.65.
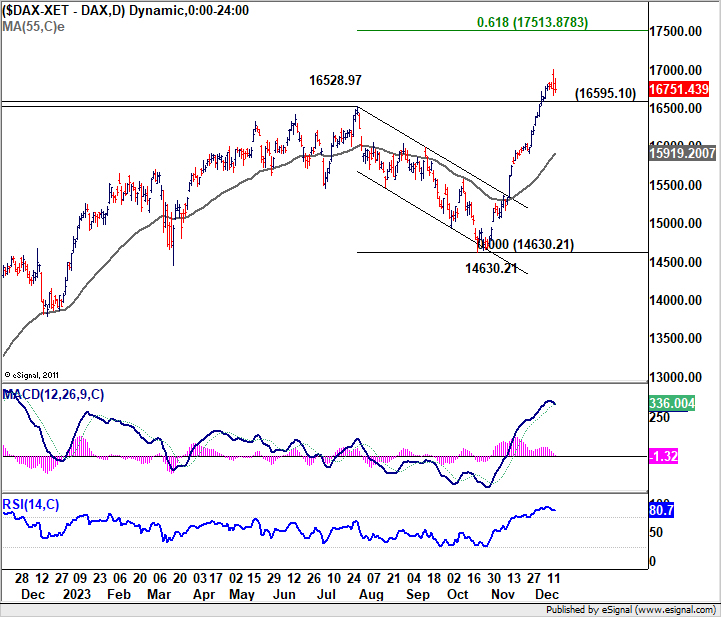
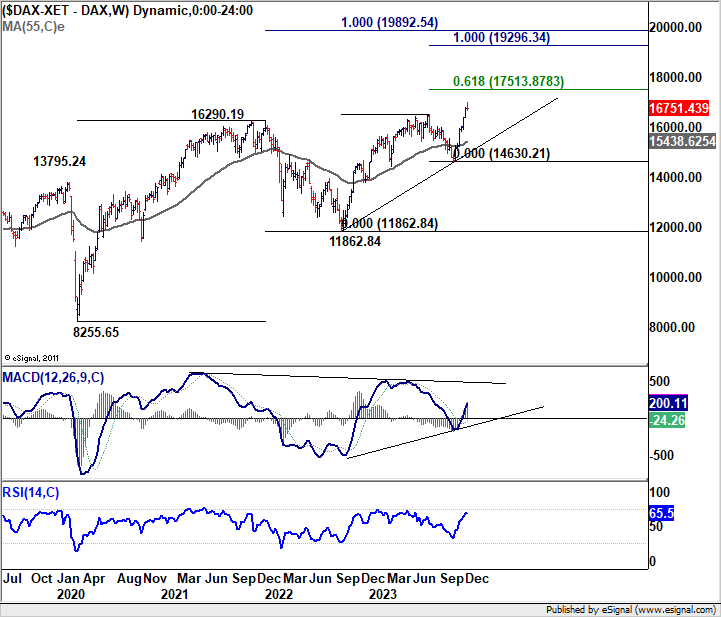
DAX spiked higher to 17003.27 but retreated to close down at 16751.43, as reaction to poor PMI data. For now further rise is in favor as long as 16595.10 support holds. Next target is 61.8% projection of 11862.84 to 16528.97 from 14630.21 at 17513.87. Break of 1695.10 support will bring consolidations first. But pullback should be contained above 55 D EMA (now at 15919.20) to bring another rally.
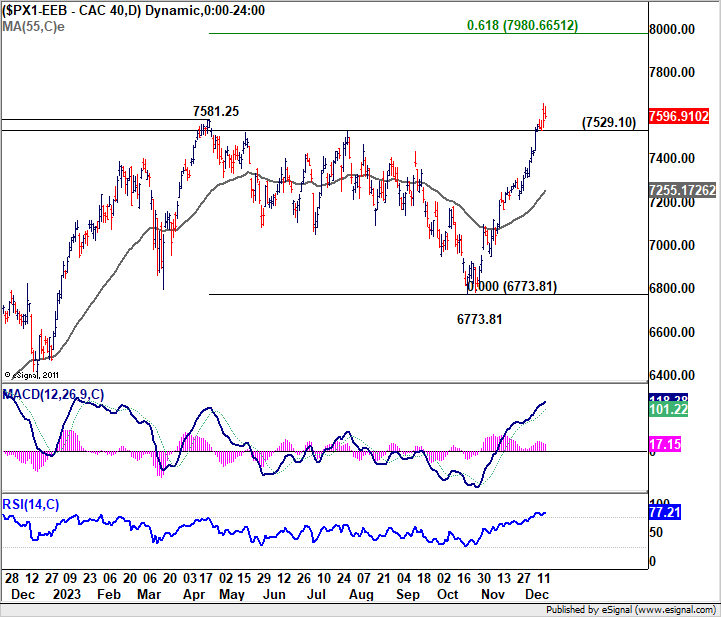
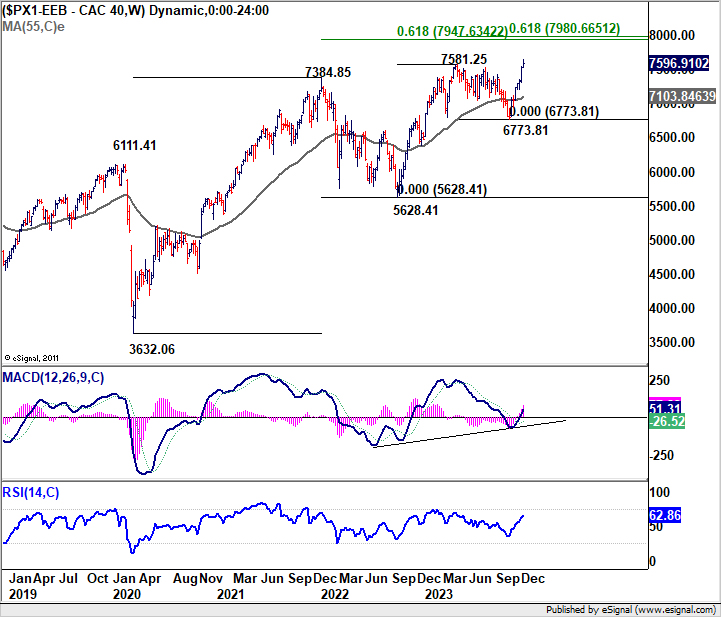
Further rally is expected in CAC as long as 7529.10 support holds. Next target is 61.8% projection of 5628.41 to 7581.25 from 6773.81 at 7980.66, which is close to 8000 psychological level. Break of 7529.10 will bring consolidations first. But downside of retreat should be contained above 55 D EMA (now at 7255.17) to bring up trend resumption.
US 10-year yield breaks 4%, Dollar Index resumes near term fall
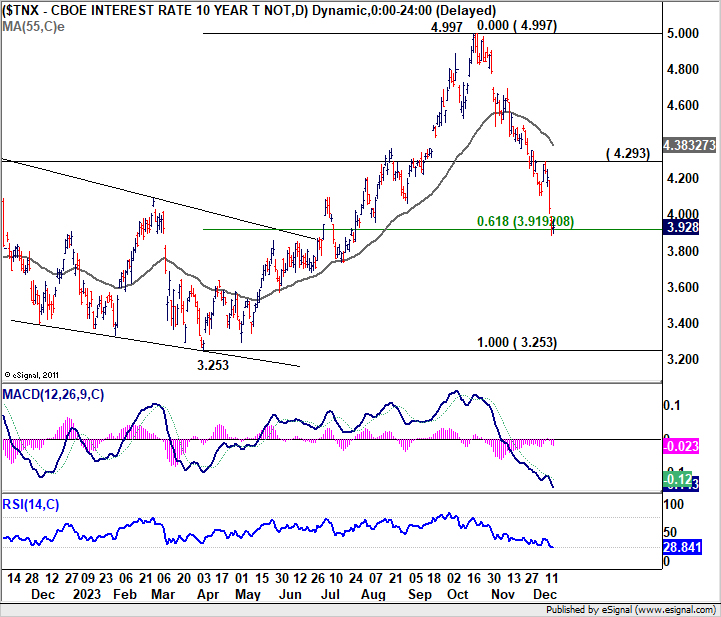
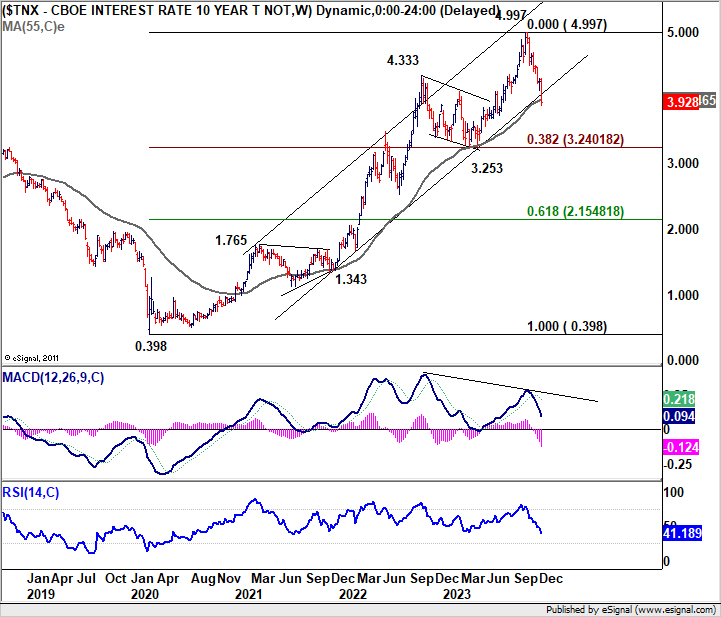
US 10-year yield's decline from 4.997 accelerate through 4% last week to close at 3.928. Technically speaking current level is an ideal area to stage a recovery. Oversold condition is seen in D RSI. There are 61.8% retracement of 3.253 to 4.997 at 3.919, 55 W EMA (now at 3.952) and well as long term channel support. But still break of 4.293 resistance is needed to indicate short term bottoming. Otherwise, any interim recovery would be brief.
On the other hand, sustained trading below 3.919 will pave the way to 3.253 cluster support (38.2% retracement 0.398 to 4.997 at 3.24), as a correction to whole up trend from 0.398 (2020 low).
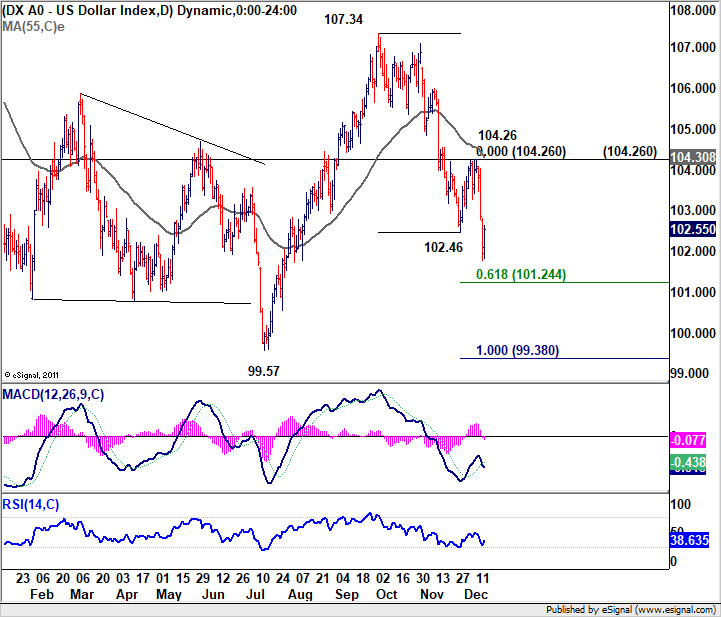
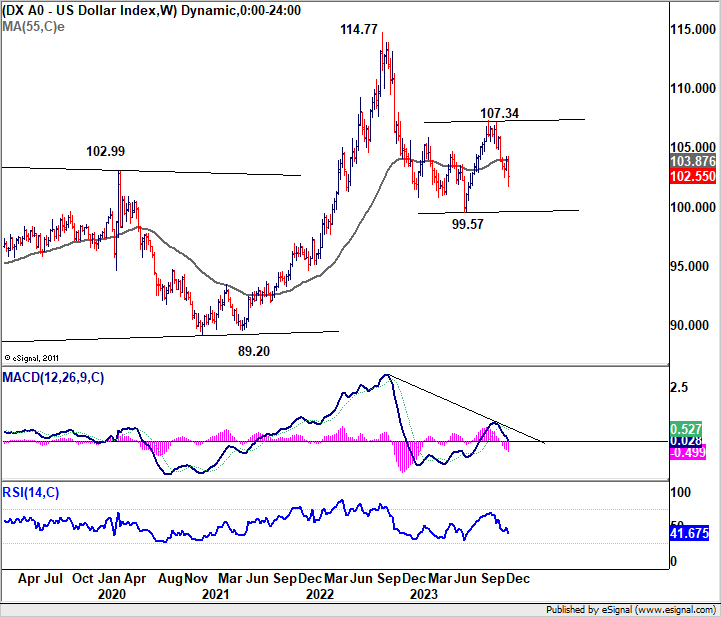
Dollar index's fall from 107.34 resumed by breaking through 102.46 last week, after failing to extend the rebound through 55 D EMA. Further decline is now expected to 61.8% projection of 107.34 to 102.46 from 104.26 at 101.24 first. Firm break there will target 100% projection at 99.38, which is close to 99.57 key support level.
The bigger question is whether DXY's fall from 107.34 is resuming the whole down trend from 114.77 (2022 high), or as the second leg of the consolidation pattern from 99.57. For now, the latter case is favored, as Euro's outperformance on Dollar shouldn't last too long for ECB is also on track to rate cuts next year.
Hence, strong support is expected from 99.38/57 to contain downside to finish the fall from 107.34, and bring rebound. Break of 104.26 will argue that the third leg of the corrective pattern could have started.
AUD/USD, USD/JPY and USD/CNH
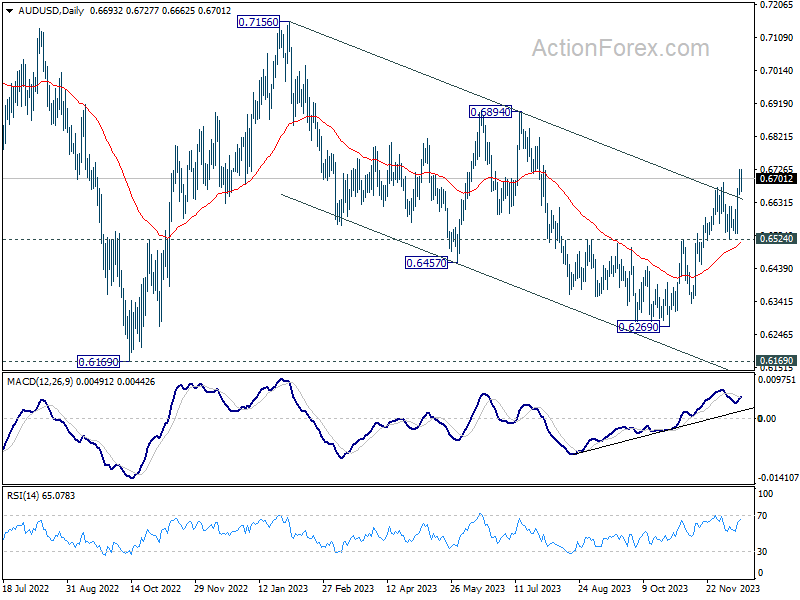
AUD/USD was the second biggest mover last week, and gained 1.84%. Technically, the break of medium term channel resistance affirm the case that whole decline from 0.7156 has completed with three waves down to 0.6269. Rise from 0.6269 is seen as the third leg of the pattern from 0.6169 (2022 low). Near term outlook will now stay bullish as long as 0.6524 support holds, for 0.6894 resistance first. Decisive break there will bring further rally to 0.7156 resistance next.
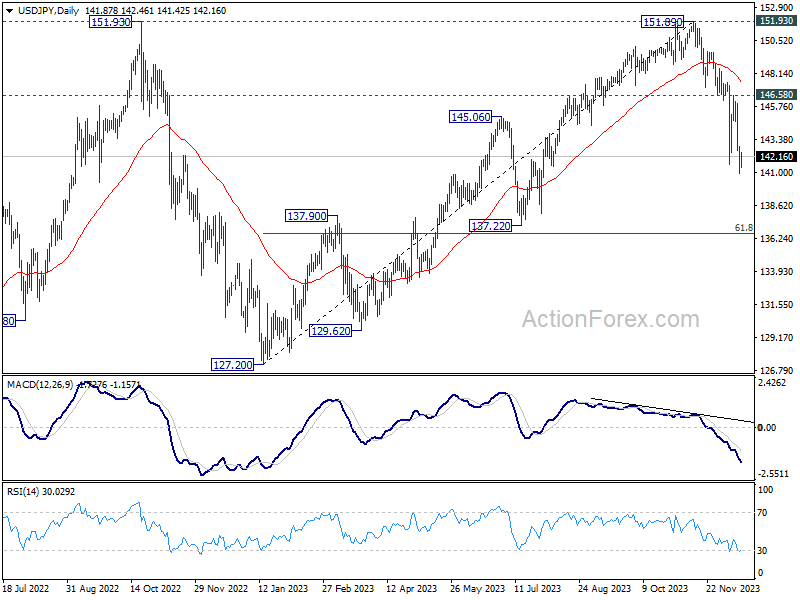
USD/JPY was the top mover last week, closed down -1.91%. The development is inline with the view that rise from 127.20 has completed at 151.89 already. Fall from 151.89 is seen as the third leg of the pattern from 151.93. Outlook will stay bearish as long as 146.58 resistance holds. Next target is 61.8% retracement of 127.20 to 151.89 at 136.63. Sustained break there will pave the way to 127.20 support (2022 low).
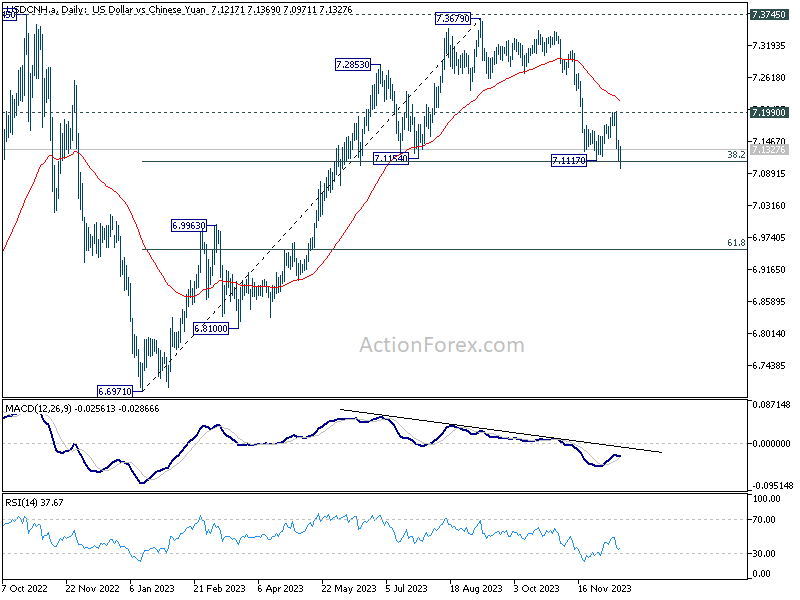
USD/CNH attempt to break through 38.2% retracement of 6.6971 to 7.3679 at 7.1117 last week, but failed again. Nevertheless, near term outlook will stay bearish as long as 0.7119 support holds. Fall from 0.73679 is tentatively seen as the third leg of the pattern from 7.3745. Sustained break of 7.7117 will affirm this view and pave the way to 61.8% retracement at 6.9533 below. If realized, extended decline in USD/CNH would give extra support to the rally in AUD/USD and pressure to the decline in USD/JPY.
EUR/USD Weekly Outlook
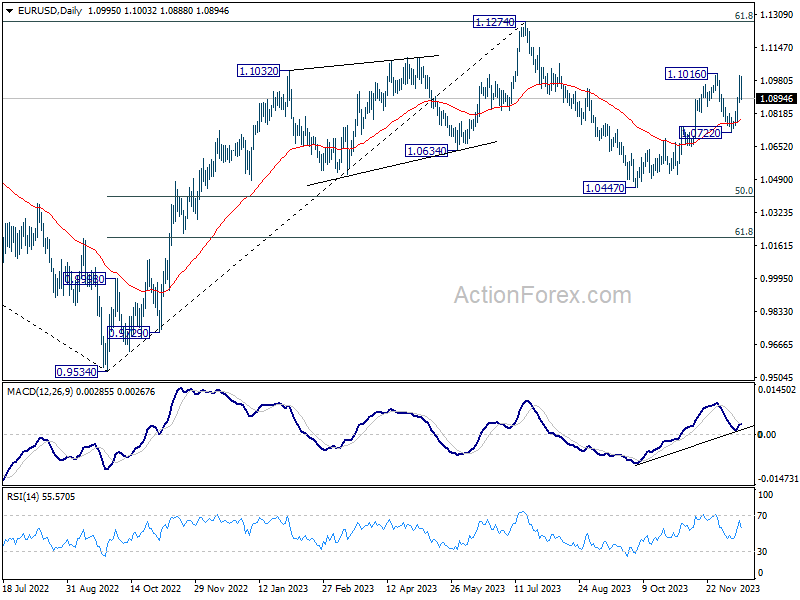
EUR/USD rose to 1.1008 last week but failed to break through 1.1016 resistance and retreated. Initial bias remains neutral this week first. Further rally is expected as long as 1.0722 support holds. Break of 1.1016 will resume the whole rise from 1.0447 to retest 1.1274 high.
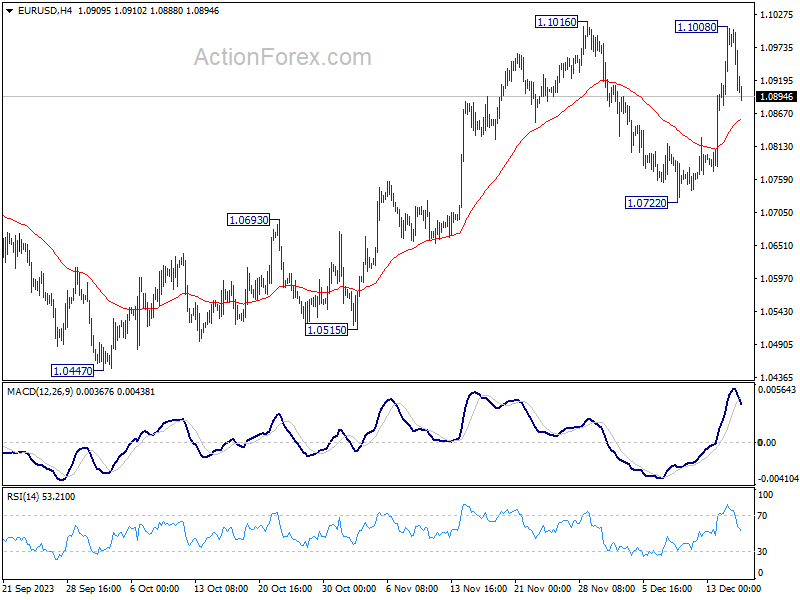
In the bigger picture, price actions from 1.1274 are viewed as a corrective pattern to rise from 0.9534 (2022 low). Rise from 1.0447 is seen as the second leg. While further rally could cannot be ruled out, upside should be limited by 1.1274 to bring the third leg of the pattern. Meanwhile, sustained break of 1.0722 support will argue that the third leg has already started for 1.0447 and below.
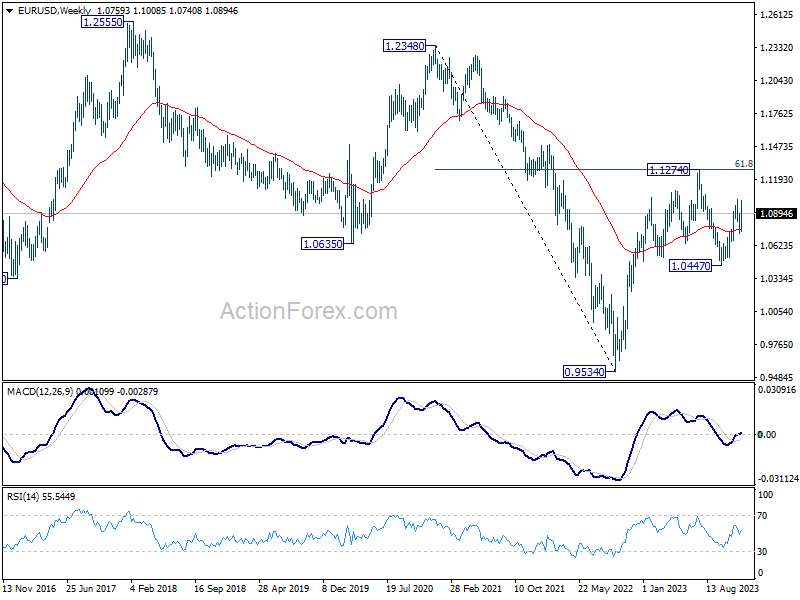
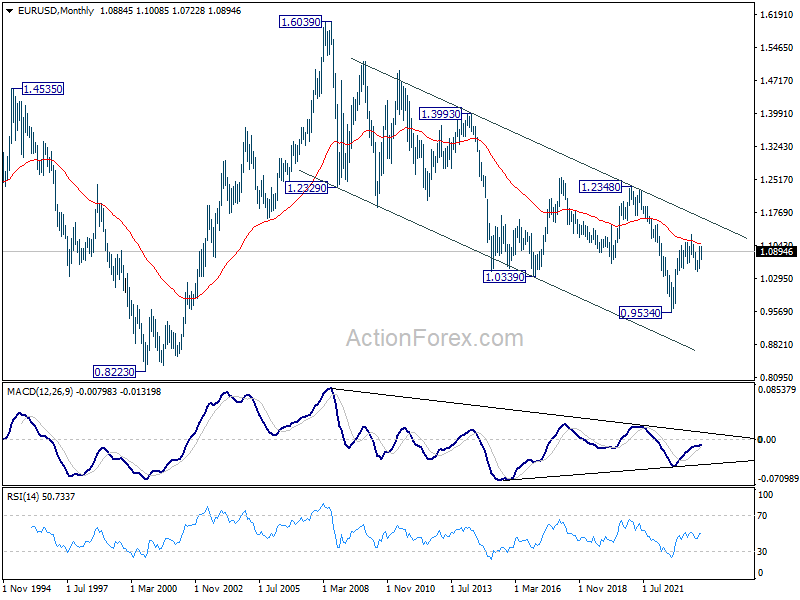
In the long term picture, a long term bottom is in place at 0.9534 on bullish convergence condition in M MACD. It's still early to call for bullish trend reversal with the pair staying inside falling channel. Nevertheless, sustained trading above 55 M EMA (now at 1.1073) and break of 1.1274 resistance will raise the chance of reversal and target 1.2348 resistance for confirmation.
EUR/USD Weekly Outlook
EUR/USD rose to 1.1008 last week but failed to break through 1.1016 resistance and retreated. Initial bias remains neutral this week first. Further rally is expected as long as 1.0722 support holds. Break of 1.1016 will resume the whole rise from 1.0447 to retest 1.1274 high.
In the bigger picture, price actions from 1.1274 are viewed as a corrective pattern to rise from 0.9534 (2022 low). Rise from 1.0447 is seen as the second leg. While further rally could cannot be ruled out, upside should be limited by 1.1274 to bring the third leg of the pattern. Meanwhile, sustained break of 1.0722 support will argue that the third leg has already started for 1.0447 and below.
In the long term picture, a long term bottom is in place at 0.9534 on bullish convergence condition in M MACD. It's still early to call for bullish trend reversal with the pair staying inside falling channel. Nevertheless, sustained trading above 55 M EMA (now at 1.1073) and break of 1.1274 resistance will raise the chance of reversal and target 1.2348 resistance for confirmation.
USD/JPY Weekly Outlook
Despite much volatility last week, USD/JPY's fall from 151.89 is still in progress. But as a temporary low was formed at 140.94, initial bias is neutral this week first for consolidations. Upside should be limited well below 146.58 resistance to bring another decline. Break of 140.94 will target next fibonacci level at 136.63.
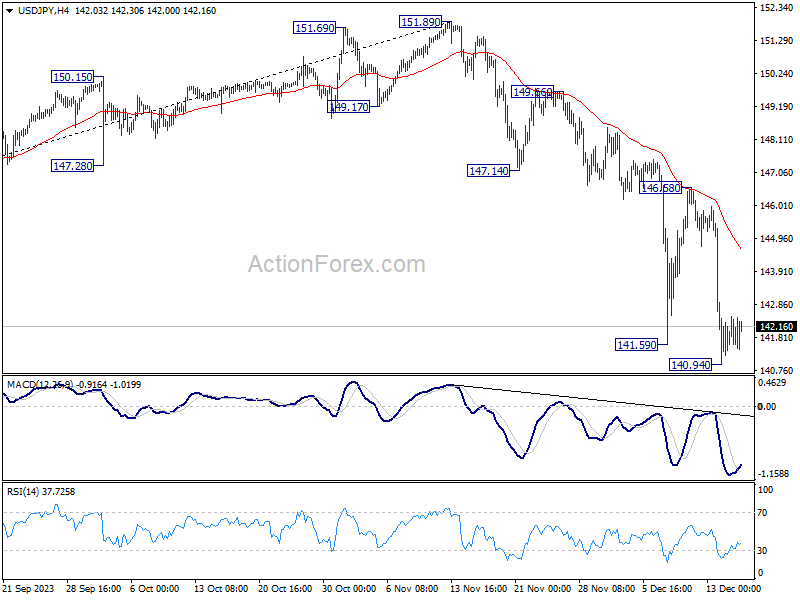
In the bigger picture, fall from 151.89 is seen as the third leg of the corrective pattern from 151.93 (2022 high). Deeper decline would be seen to 61.8% retracement of 127.20 to 151.89 at 136.63, sustained break there will pave the way to 127.20 support (2022 low). This will now remain the favored as long as 146.58 resistance holds.

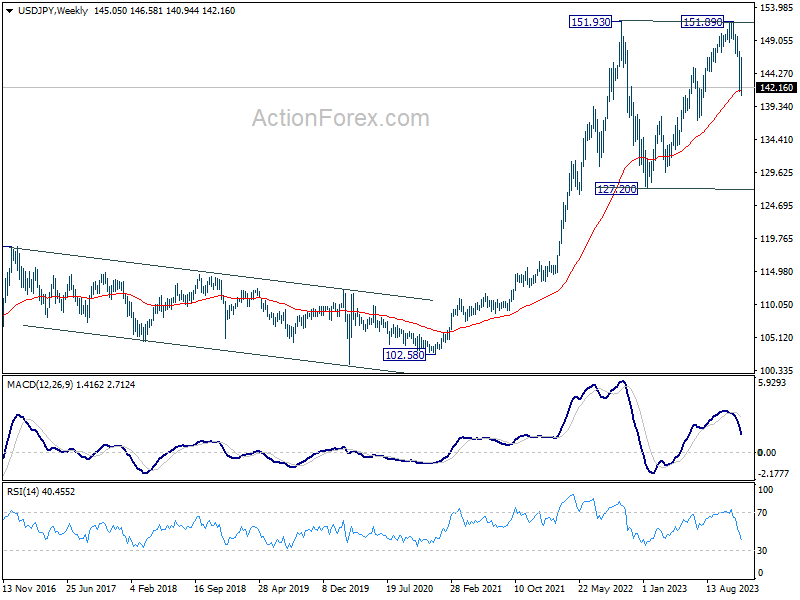
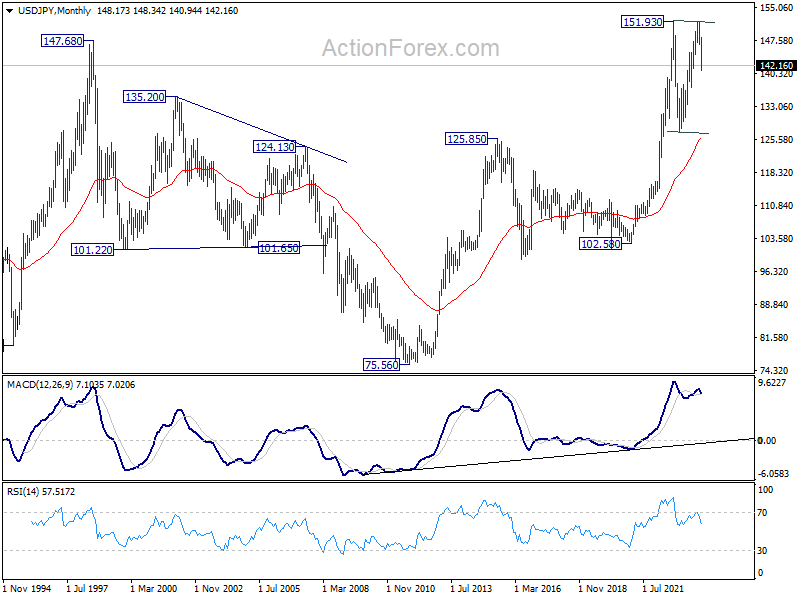
In the long term picture, as long as 125.85 resistance turned support holds (2015 high), up trend from 75.56 (2011 low) is still in favor to continue through 151.93 (2022 high) at a later stage.
GBP/USD Weekly Outlook
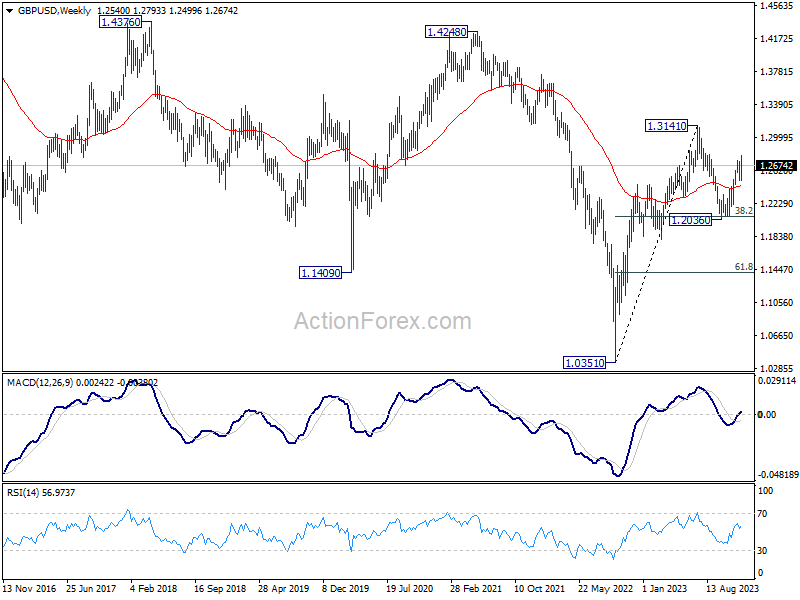
GBP/USD's rise from 1.2036 resumed last week and edged higher to 1.2793. But with subsequent retreat, initial bias stays neutral this week for consolidations first. Outlook will stay bullish as long as 1.2499 support holds. On the upside, break of 1.2793 will resume the rally to 61.8% projection of 1.2068 to 1.2731 from 1.2499 at 1.2909.
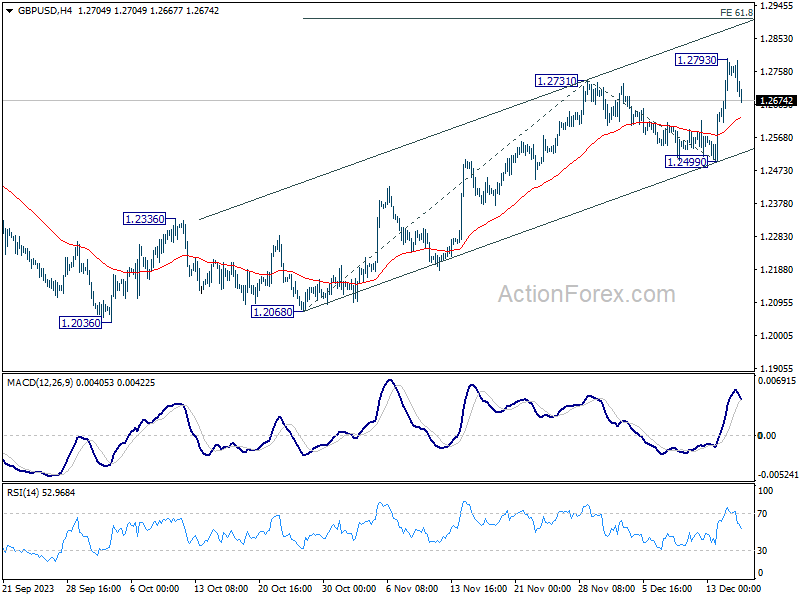
In the bigger picture, price actions from 1.3141 medium term top are seen as a corrective pattern to rise from 1.0351 (2022 low). Rise from 1.2036 is seen as the second leg that's in progress. Upside should be limited by 1.3141 to bring the third leg of the pattern. Meanwhile, break of 1.2499 support will argue that the third leg has already started for 38.2% retracement of 1.0351 (2022 low) to 1.3141 at 1.2075 again.
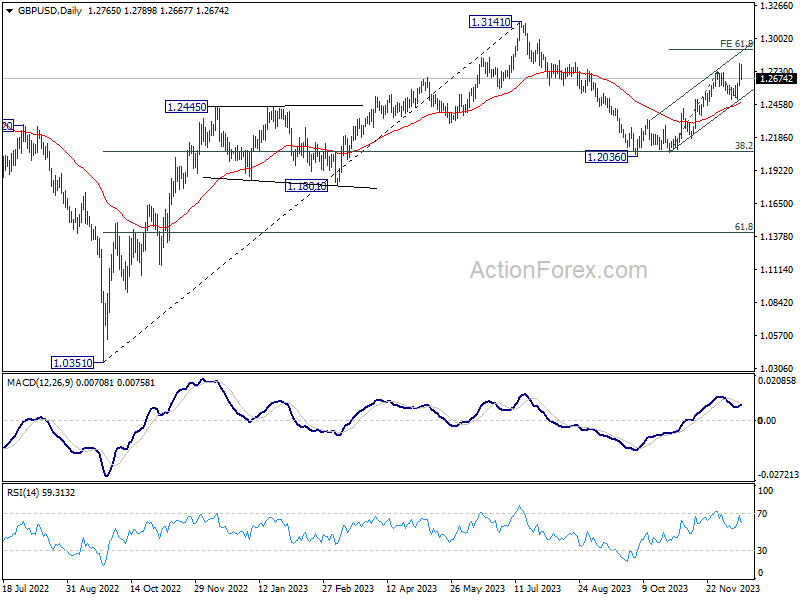
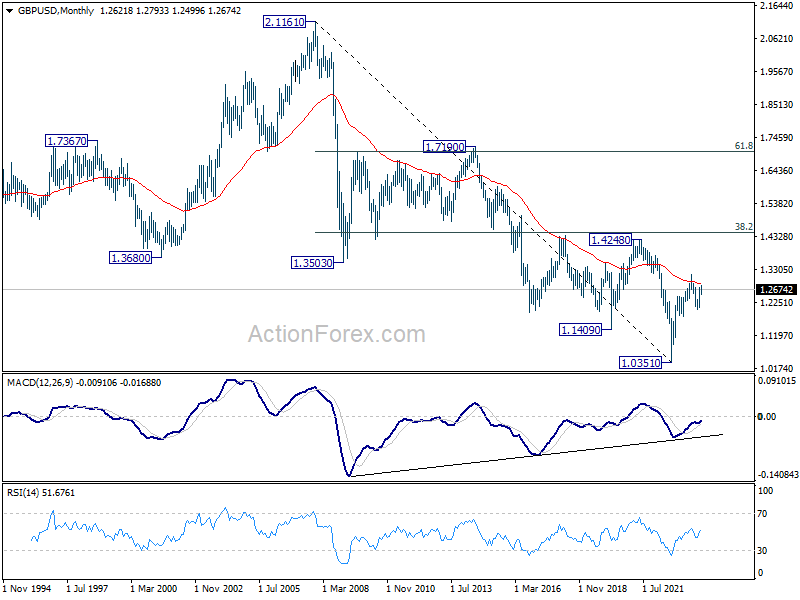
In the long term picture, a long term bottom should be in place at 1.0351 on bullish convergence condition in M MACD. But momentum of the rebound from 1.3051 argues GBP/USD is merely in consolidation, rather than trend reversal. Range trading is likely between 1.0351/4248 for some more time.
USD/CHF Weekly Outlook
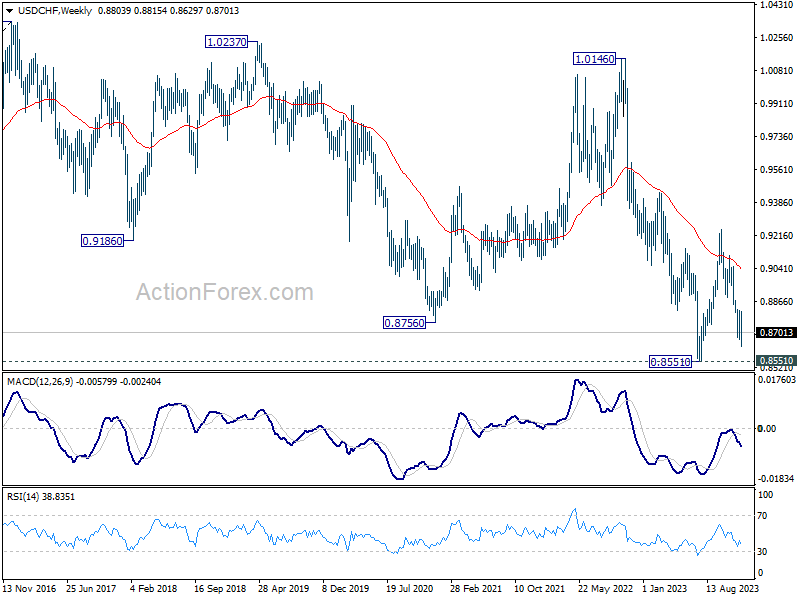
USD/CHF's fall from 0.9111 continued last week and edged lower to 0.8629 last week. Nevertheless, with subsequent recovery, initial bias is neutral this week for consolidations first. Break of 0.8629 will resume the decline to retest 0.8551 key support level. However, break of 0.8819 will turn bias back to the upside for stronger rebound.
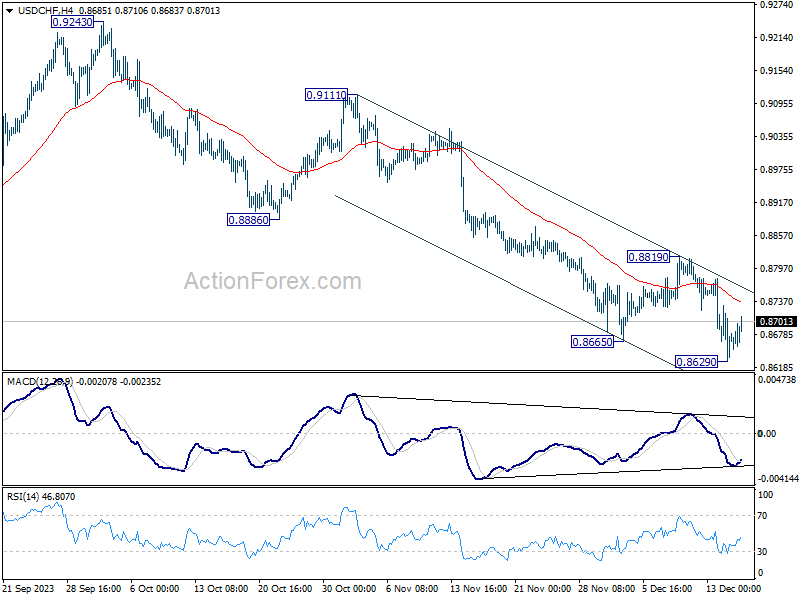
In the bigger picture, price actions from 0.8551 are currently seen as a corrective pattern to the decline from 1.0146 (2022 high). Fall from 0.9243 is seen as the second leg for now. Strong support should be seen 0.8551 to bring rebound. Meanwhile, break of 0.9111 resistance will argue that the third leg has started already, and target 0.9243.
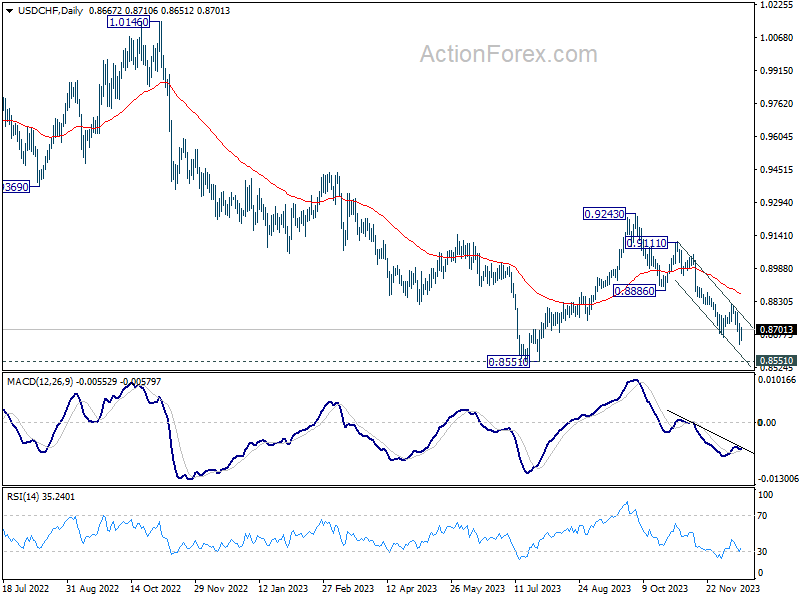
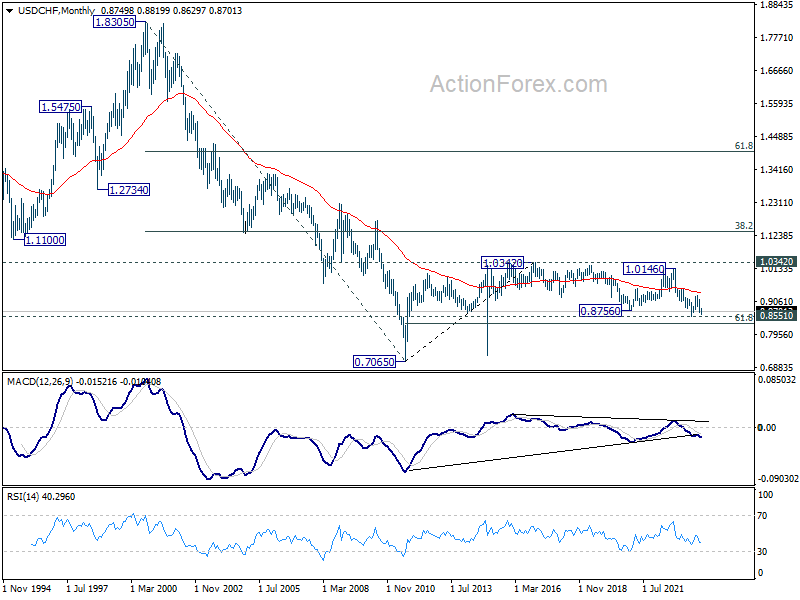
In the long term picture, there is no clear sign that down trend from 1.8305 (2000 high) has completed. With 38.2% retracement of 1.8305 to 0.7065 at 1.1359 intact, outlook is neutral at best.