Sample Category Title
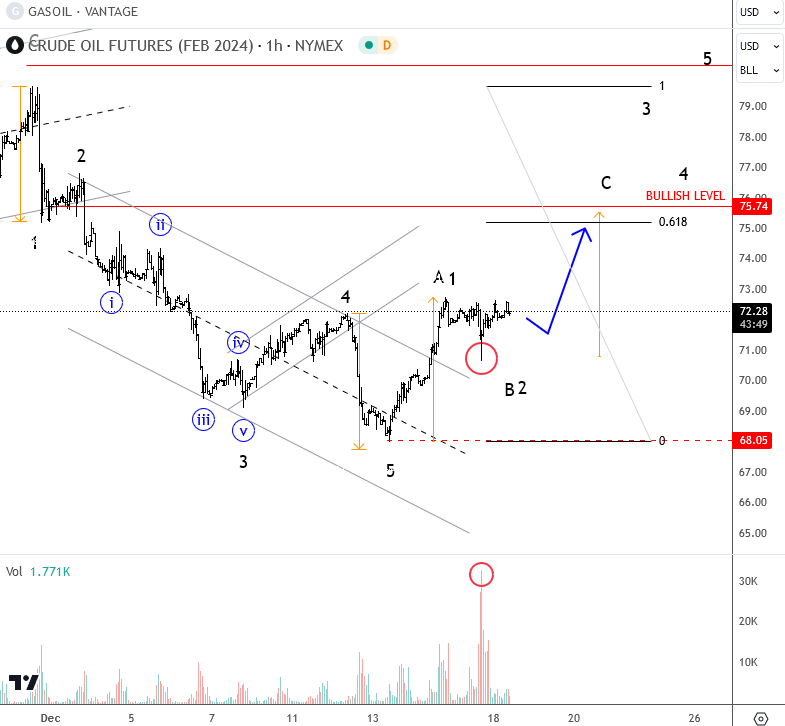
Crude: Temporary Recovery Has Room for $75
Crude spiked lower on Friday, but then stabilized on volume late in US session when price moved slightly higher. Energy also stays up after the news that N.Korea fired an unspecified ballistic missile toward East Sea. From an Elliott wave perspective, price is also eyeing higher, we are seeing room for wave C/3 to around $75. In that area we see some consolidation back from start of December and the 61.8% Fib of the previous decline that can be finished because of five waves down, and break out of a downward channel.
Long Japanese Yen
The Federal Reserve’s (Fed) rate cut talk becomes chaotic and frankly, hard to follow. After the Fed signaled a possible end to its monetary policy tightening campaign and the European policymakers refused to adhere, some Fed members including John Williams and Raphael Bostic pushed back the Fed cut expectations.
Alas, activity on Fed funds futures price in the first Fed cut by March next year with more than 75% chance, and the first cut in May with almost a 100% chance. The market pricing matches the expectation of around 150bp cut throughout next year, versus only 75bp cut foreseen by Fed officials – which is already ambitious given the resilience of the US economic growth. Therefore, either the US economy will do fine, and the Fed won’t start cutting rates in March. Or we will see a sharp slowdown in the US growth and a potentially deteriorating growth outlook will force the Fed to start cutting the rates in Q1 and cut thoroughly. But a scenario where the Fed starts cutting rates in March while economy remains resilient and inflation low makes little sense as the fiscal spending will remain robust into next year’s presidential election and maintain the risk of a U-turn in inflation alive.
But anyway, investors could give the Fed doves the benefit of the doubt until Friday’s PCE data. The PCE, the Fed’s favourite gauge of inflation, is expected to show a further decline in both headline and core inflation. More importantly, if the data matches expectations, it would mean that 6-month annualized inflation will be a touch above the Fed’s 2% target. The latter could keep the Fed doves in charge. Nonetheless, the successful alleviation of inflation can be attributed to the decline in oil prices. Even though the base case scenario is a limited upside potential in oil prices, any reversal in oil price dynamics could tame the Fed cut expectations. In the short run, the barrel of American oil is around the $72pb on Monday on the back of lower Russian exports and suspended transit in the Red Sea due to attacks by the Houthis on ships in the region. Solid offers are seen into $74/75pb range.
What’s cooking in Japan?
The Bank of Japan (BoJ) will announce this year’s final policy verdict on Tuesday. The BoJ Governor Ueda’s comments that the BoJ’s policy would be hard to maintain from the year end, had triggered expectations that the BoJ will finally say goodbye to negative rates. There is nothing more than a slim probability for the BoJ to exit negative rates this week, but investors are eager to hear further details about how and when the BoJ will leave the negative rate territory. Concrete details regarding the BoJ’s policy plans and/or changes in BoJ’s inflation outlook could cause swift moves in yen markets, which became very volatile since Ueda hinted that something is cooking in its kitchen. The USDJPY fell from above 150 to nearly 140 in just two weeks. As such, the pair slipped - a bit too fast – into the bearish consolidation zone, below the major 38.2% Fibonacci retracement on this year’s rally.
The market’s position regarding the yen couldn’t be clearer. Presently, long Japanese yen is the most obvious trade in the currency markets. It is almost too easy. A hawkish signal from the BoJ has the potential to push the USDJPY below the 140 level, even with prevailing oversold conditions. Conversely, should the BoJ disappoint the market once more, any price rallies could draw the attention of top sellers.
Last Lap to Christmas
In focus today
Christmas week is rather light in terms of data releases. Today, we get the latest signals from the German economy in the form of the Ifo index. Consensus is looking for a slight improvement in business climate in December but risks remain to the downside particularly as the flash PMIs confirmed on Friday that the economy continues to slow down.
We also have Bank of Japan meeting on Tuesday. There has been some speculation whether the BoJ would tighten policies next week, but we continue to believe we need more firm conclusions on 2024 wage negotiations before they will feel confident to abandon yield curve control and raise the rate to zero.
Later in the week, we will have Central Bank of Turkey meeting on Thursday.
One of the week's data highlights will be US November PCE print on Friday.
The 60 second overview
Market focus: Risk sentiment was somewhat mixed on Friday as growth signals from Europe pointed towards continuing headwinds in December. Hawkish comments from NY Fed chief Williams, stating that a March cut seems 'premature', countered further declines in UST yields, though markets are still pricing quite aggressive rate cuts of 140bp next year. In Europe, long-end bond yields fell throughout the day following the weak PMIs. Risk sentiment has turned sour in Asia this morning with equity indices declining across the board.
Europe: Eurozone PMIs were weaker than expected in December. Manufacturing was unchanged at the deep red level of 44.2, while services continued drifting lower from 48.7 to 48.1. Output price indices rose, while input prices in the services sector fell further. This underlines, why the ECB is very interested in the development of corporate profit margins in relation to the inflation outlook. Overall, activity in Europe is still weak in the manufacturing sector and the malaise continues to spread to the service sector.
US: In the US, the PMIs pointed towards continuing economic resilience in December. The composite measure ticked up from 50.8 to 51 driven by an increase in the services PMI from 50.8 to 51.3. Manufacturing still looks weak in December (declining from 49.4 to 48.2), which was also the case in the New York Fed Empire Manufacturing Index out on Friday declining from 9.1 to -14.5. But overall, nothing really points towards a US economy about to fall off the cliff.
Equities: Global equities ended higher on Friday and thereby rose every day last week. Several indices reached new all-time highs last week while others were just inches away. The overarching reason for the continuation of the equity rally last was the dovish FOMC outcome and a 30bp drop in yields. Hence, no surprise to see small caps doing strong, Russell 2000 up more than 5% last week. For some maybe more surprising to see banks among the best performing in a week with massively lower yields. We do not find this surprising but rather see it a sa very telling outcome of how investors are readjusting expectations. Fear of central bank hawkishness and massive real estate defaults leading to bank losses and recession is being taken off the table. To replace this is sharply increased probability of a soft-landing where both equities, long durations assets and indebted sectors are outperforming. Once again, an example of how quickly things are turning around when the dominating investment narrative is shifting. In the US on Friday, Dow +0.2%, S&P 500 -0.01%, Nasdaq +0.4% and Russell 2000 -0.8%. Mixed markets this morning both in Asian, European and US futures.
FI: Global yields ended the Friday session significantly lower as December PMIs confirmed the headwinds to European growth. 10Y Bunds were 9bp lower throughout the session, while the 2Y tenor was less changed (-4bp). Peripheral spreads (e.g. 10Y BTP/Bunds) reversed the gains following ECB's PEPP announcement, widening some 3-4bp throughout the session. German ASW spreads narrowed as implied volatility fell further. 10Y UST yields were close to unchanged at 3.9% by the bell.
FX: EUR/USD erased around 50% of its post Fed-gains going into the weekend. The SEK has had a good run over the last couple of weeks amid strong equities and lower global rates, which have helped pull EUR/SEK below 11.20. NOK was last week's outperformer on the back of the soft Fed but specifically on the back of the hawkish surprise by Norges Bank, which pulled down EUR/NOK ca. 50 figures to currently just below 11.40 and pushed NOK/SEK above 0.98.
Credit: Following a couple of days of rapid tightening, credit spreads gave a little back on Friday where iTraxx Xover widened 3bp and Main 1.5bp.
Gold: A Further Deterioration in US 10-year Treasury Yield May Support a Bullish Tone
- An increase in dovish expectations on a rapid pace of Fed funds rate cuts projected for 2024 indicates a potential impending recession.
- An uptick in recession risk may see a further deterioration in the US 10-year Treasury real yield which reduces the opportunity costs for holding Spot Gold (XAU/USD).
- Spot Gold (XAU/USD) has managed to trade back above its 20-day moving average.
The price actions of Spot Gold (XAU/USD) have shaped the extended corrective decline to print an intraday low of US$1,973 on 13 December during the European session ahead of the FOMC meeting announcement on the same day which was just a whisker away from the US$1,955 support highlighted in our previous analysis.
All in all, it has shed -8.2% from its current all-time high of US$2,149 printed on 4 December 2023 which represents a retracement of close to 50% of its ongoing medium-term uptrend phase in place since the 6 October 2023 low of US$1,810.
The US Federal Reserve unleashed its dovish pivot last Wednesday, 13 December where its latest “dot plot” projection for the trajectory of the Fed funds rate has indicated a total of three rate cuts (75 basis points) pencilled in for 2024, upped from two projected rate cuts in the prior September’s dot plot which in turn led to an increased in dovish expectations of market participants to price in six rate cuts, a total of 150 bps in 2024 via the 30-day Fed funds rate futures calculated by the CME FedWatch tool.
This kind of dovish expectation that has skewed towards a rapid pace of the Fed funds rate cuts projection in the upcoming monetary easing cycle seems to indicate an impending recessionary scenario in 2024 that may put further downside pressure on the US 10-year Treasury real yield.
US 10-year Treasury real yield broke below the 200-day moving average
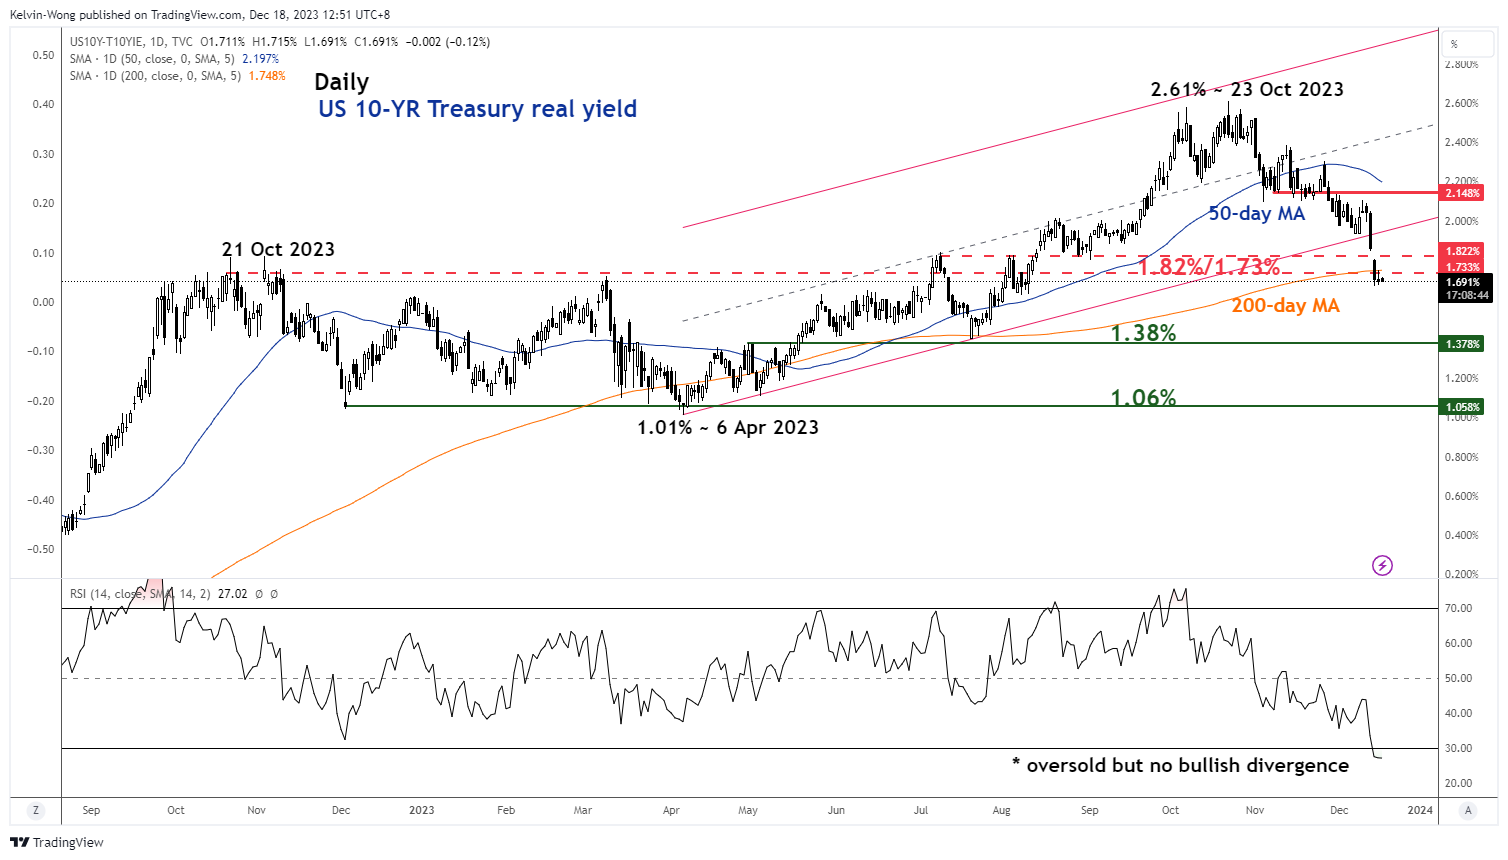
Fig 1: US 10-year Treasury real yield medium-term trend as of 18 Dec 2023 (Source: TradingView, click to enlarge chart)
The price movement of the US 10-year Treasury real yield has broken down below a major support zone of 1.82%/1.73% (also the 200-day moving average) which room for further downside potential with the next intermediate support coming in at 1.38%.
Based on intermarket analysis, a further deterioration in the US 10-year Treasury real yield may support another round of potential impulsive upmove sequence in gold prices due to lower opportunity costs as gold does not produce “fixed coupons income streams” like bonds.
Watch the US$1,997 key short-term support
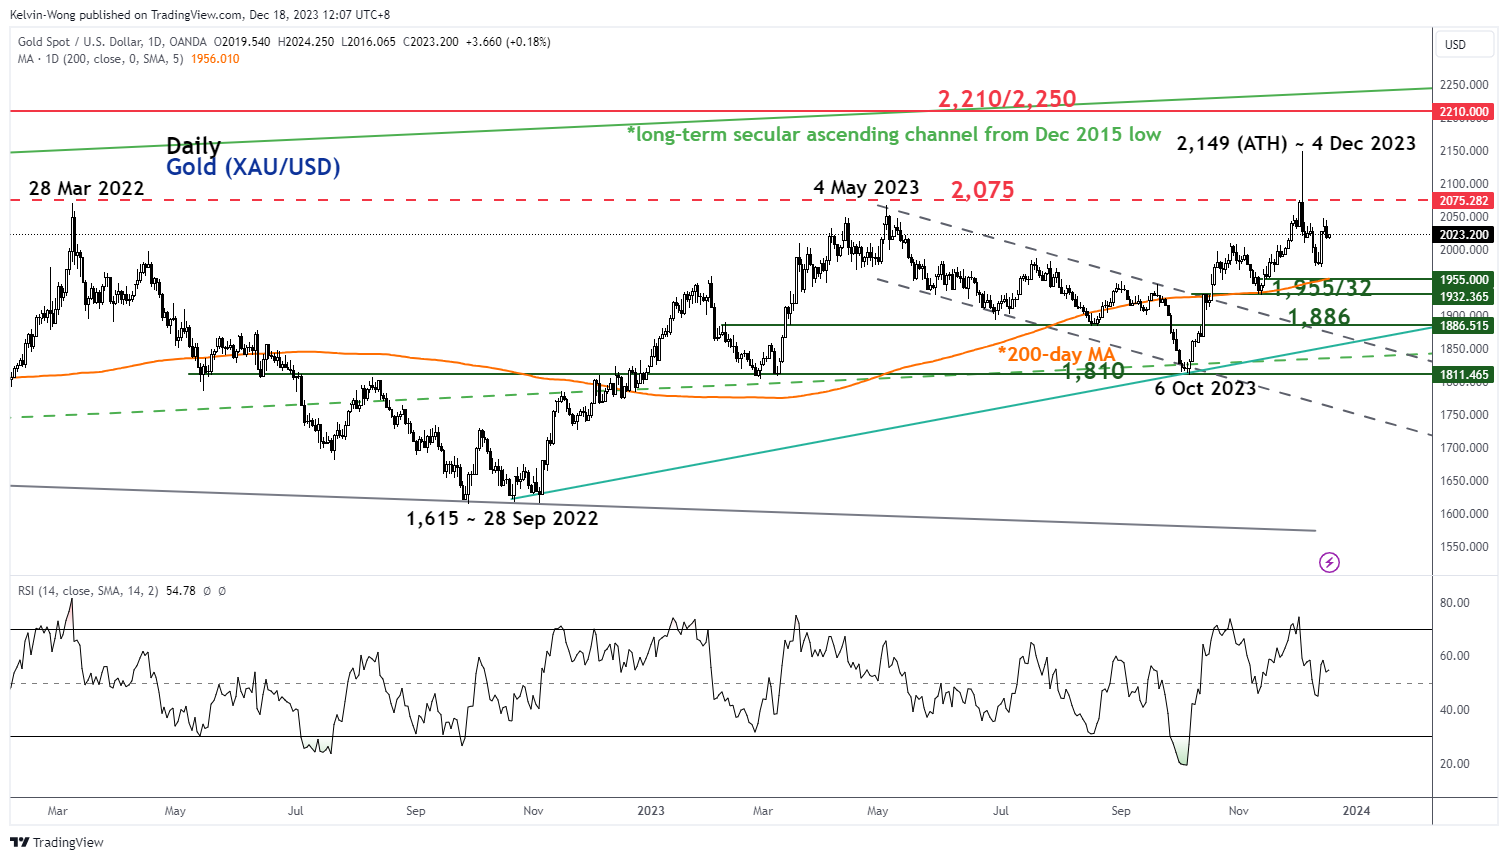
Fig 2: Spot Gold (XAU/USD) medium-term trend as of 18 Dec 2023 (Source: TradingView, click to enlarge chart)
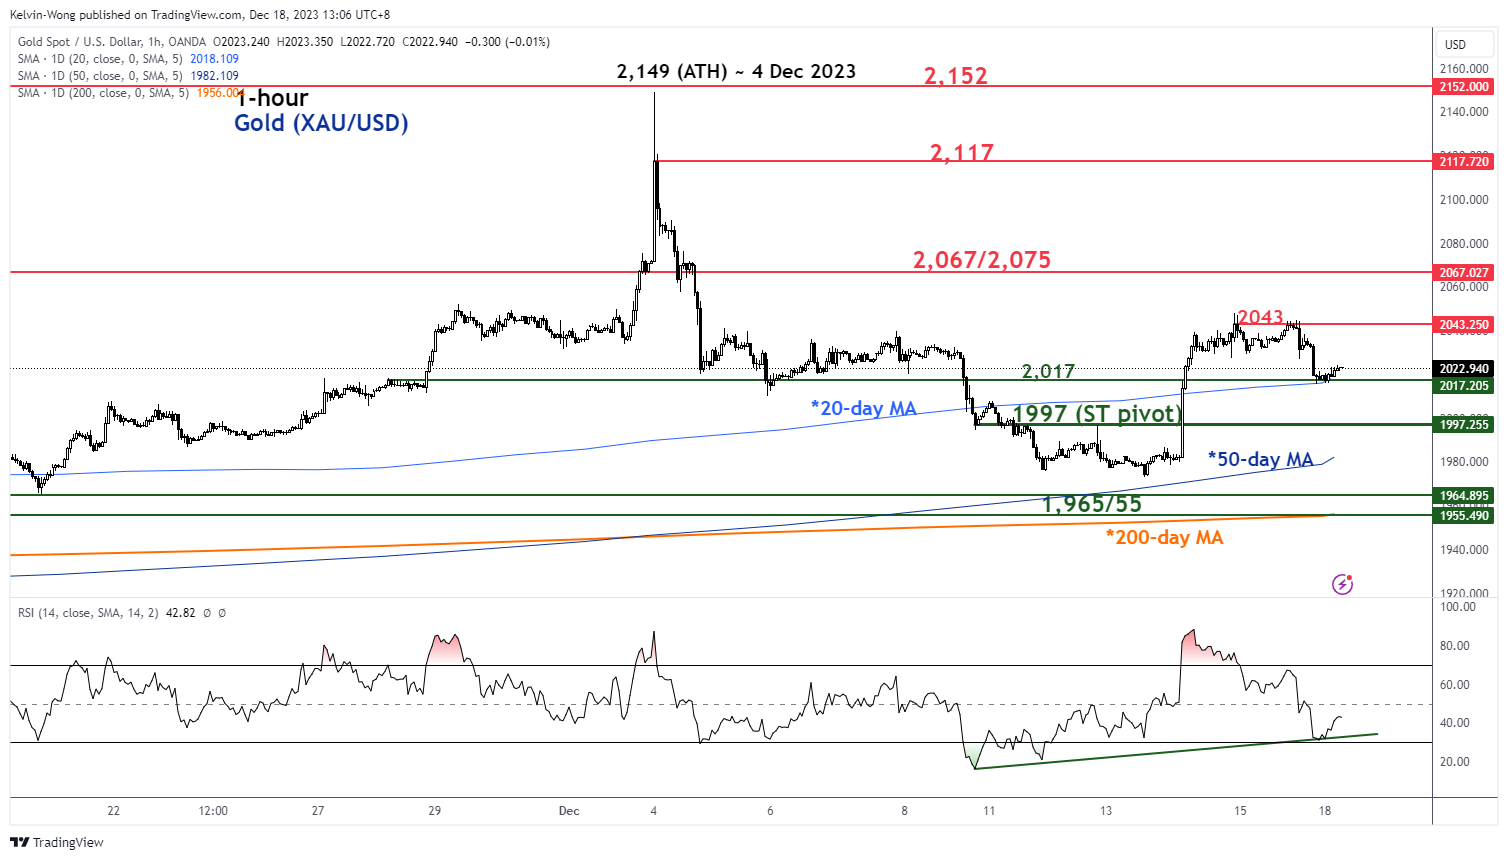
Fig 3: Spot Gold (XAU/USD) minor short-term trend as of 18 Dec 2023 (Source: TradingView, click to enlarge chart)
The minor slide of -1.5% seen Spot Gold (XAU/USD) from Thursday, 14 December ex-post FOMC high of US$2,048 has been accompanied by a hawkish remark made by Fed official Williams last Friday, 15 December that indicated a lack of preference for FOMC to discuss its first rate cut in March 2024 which was in contrast with a high chance of 75% of a 25 bps rate cut in March 2024 FOMC as priced in by the 30-day Fed funds futures calculated by the CME FedWatch tool as of 15 December 2023.
Interestingly, the slide has managed to stall right at the upward-sloping 20-day moving average, acting as near-term support at US$2,017, slightly above the US$1,997 short-term pivotal support with a bullish momentum reading seen in the hourly RSI momentum indicator at its oversold region.
A clearance above US$2,043 may see the next intermediate resistances coming at US$2,067/US$2,075 and US$2,117 in the first step.
However, failure to hold at US$1,997 invalidates the recovery scenario to revive the corrective decline towards the medium-term support zone at US$1,965/US$1,955 (also the 200-day moving average).
Technical Outlook and Review
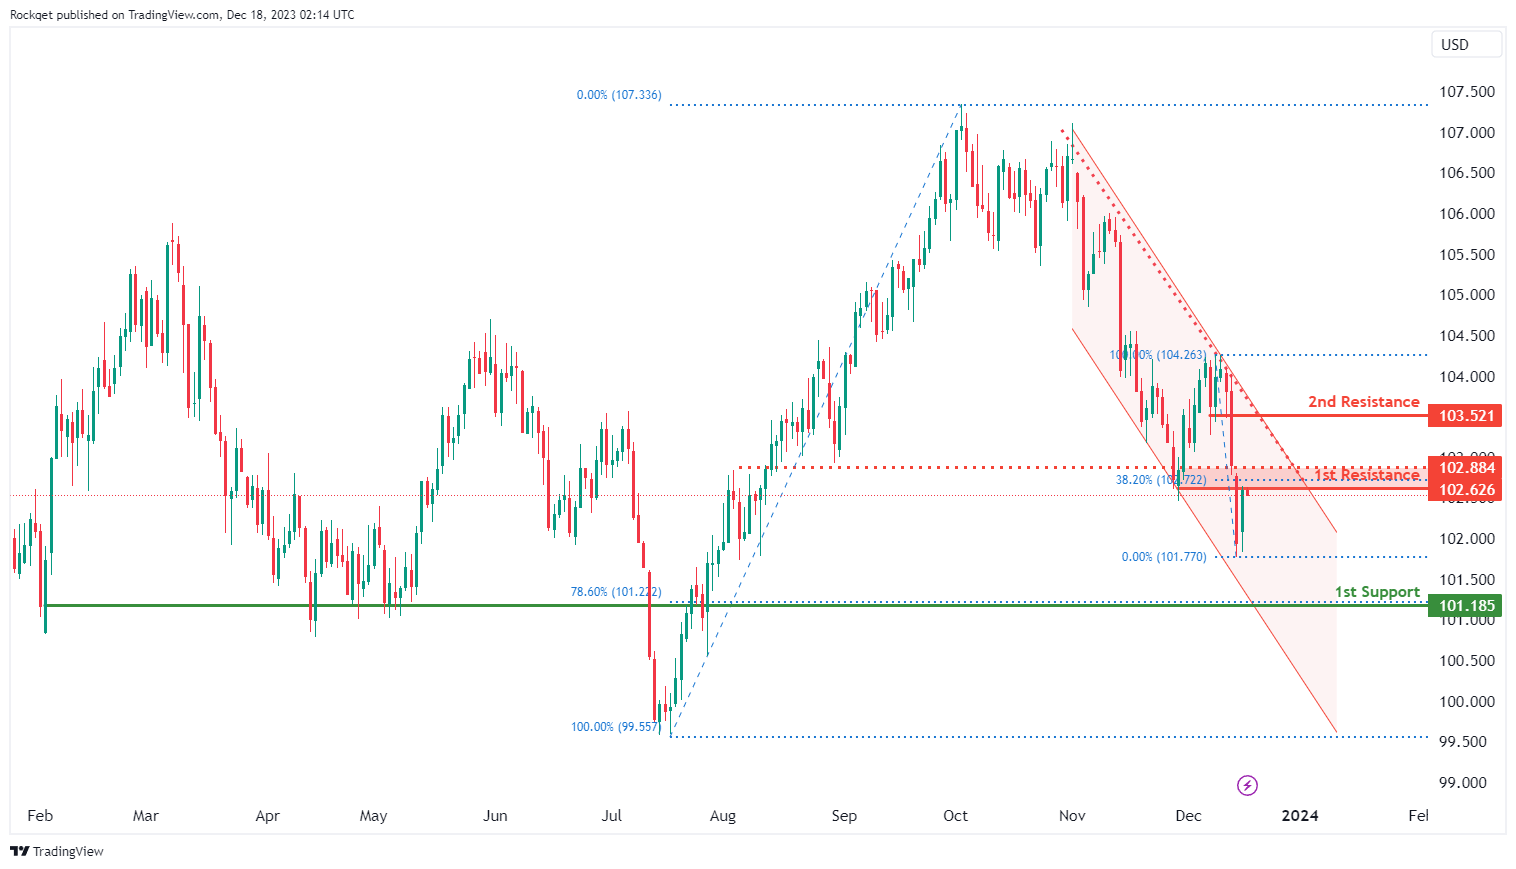
DXY:
The DXY (US Dollar Index) chart currently shows an overall bearish momentum, indicating a potential for price to make a bearish reaction off the 1st resistance and fall towards the 1st support.
The 1st resistance level at 102.62 is identified as an overlap resistance that aligns close to the 38.20% Fibonacci retracement level. Higher up, the 2nd resistance level at 103.52 is marked as a pullback resistance, suggesting a potential barrier for further upside movement.
To the downside, the 1st support level at 101.18 is identified as a pullback support that aligns with the 78.60% Fibonacci retracement level, further reinforcing its importance as a potential key support level.
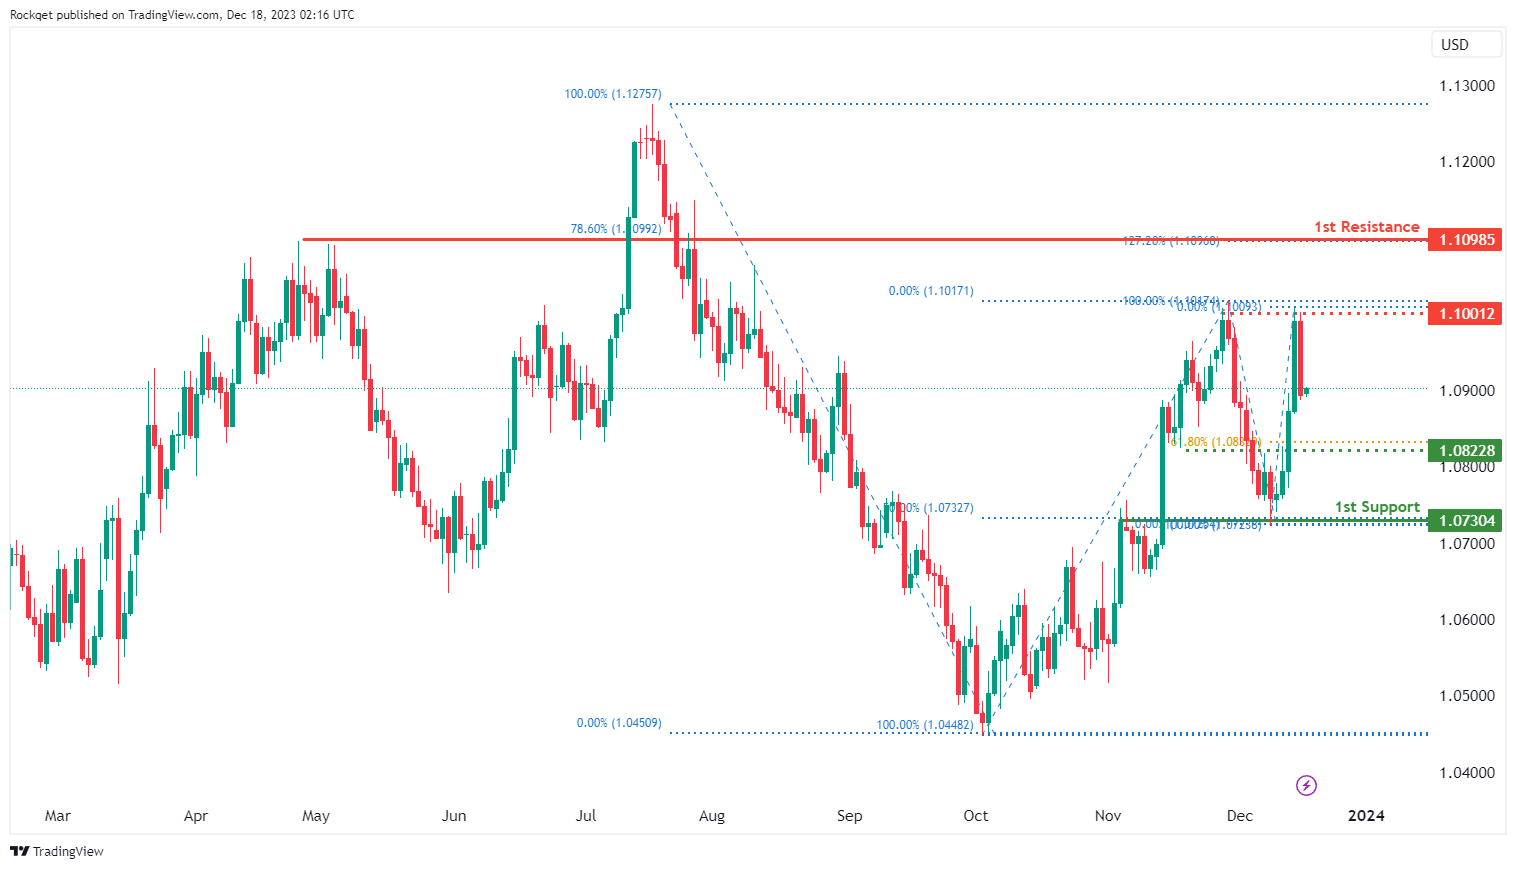
EUR/USD:
The EUR/USD chart currently exhibits an overall bullish momentum. However, there is a potential scenario for price to fluctuate between the intermediate resistance and intermediate support levels.
The intermediate resistance level at 1.1001 is identified as a pullback resistance. Higher up, the 1st resistance level at 1.1098 is also noted as a pullback resistance that aligns with a confluence of Fibonacci levels i.e. the 127.20% extension and the 78.60% retracement levels, suggesting a potential barrier for further upside movement.
To the downside, the intermediate support level at 1.0822 is identified as an overlap support that aligns close to the 61.80% Fibonacci retracement level. Further below. the 1st support level at 1.0730 is also marked as an overlap support that aligns with the 50.00% Fibonacci retracement level, further reinforcing its importance as a potential key support level.
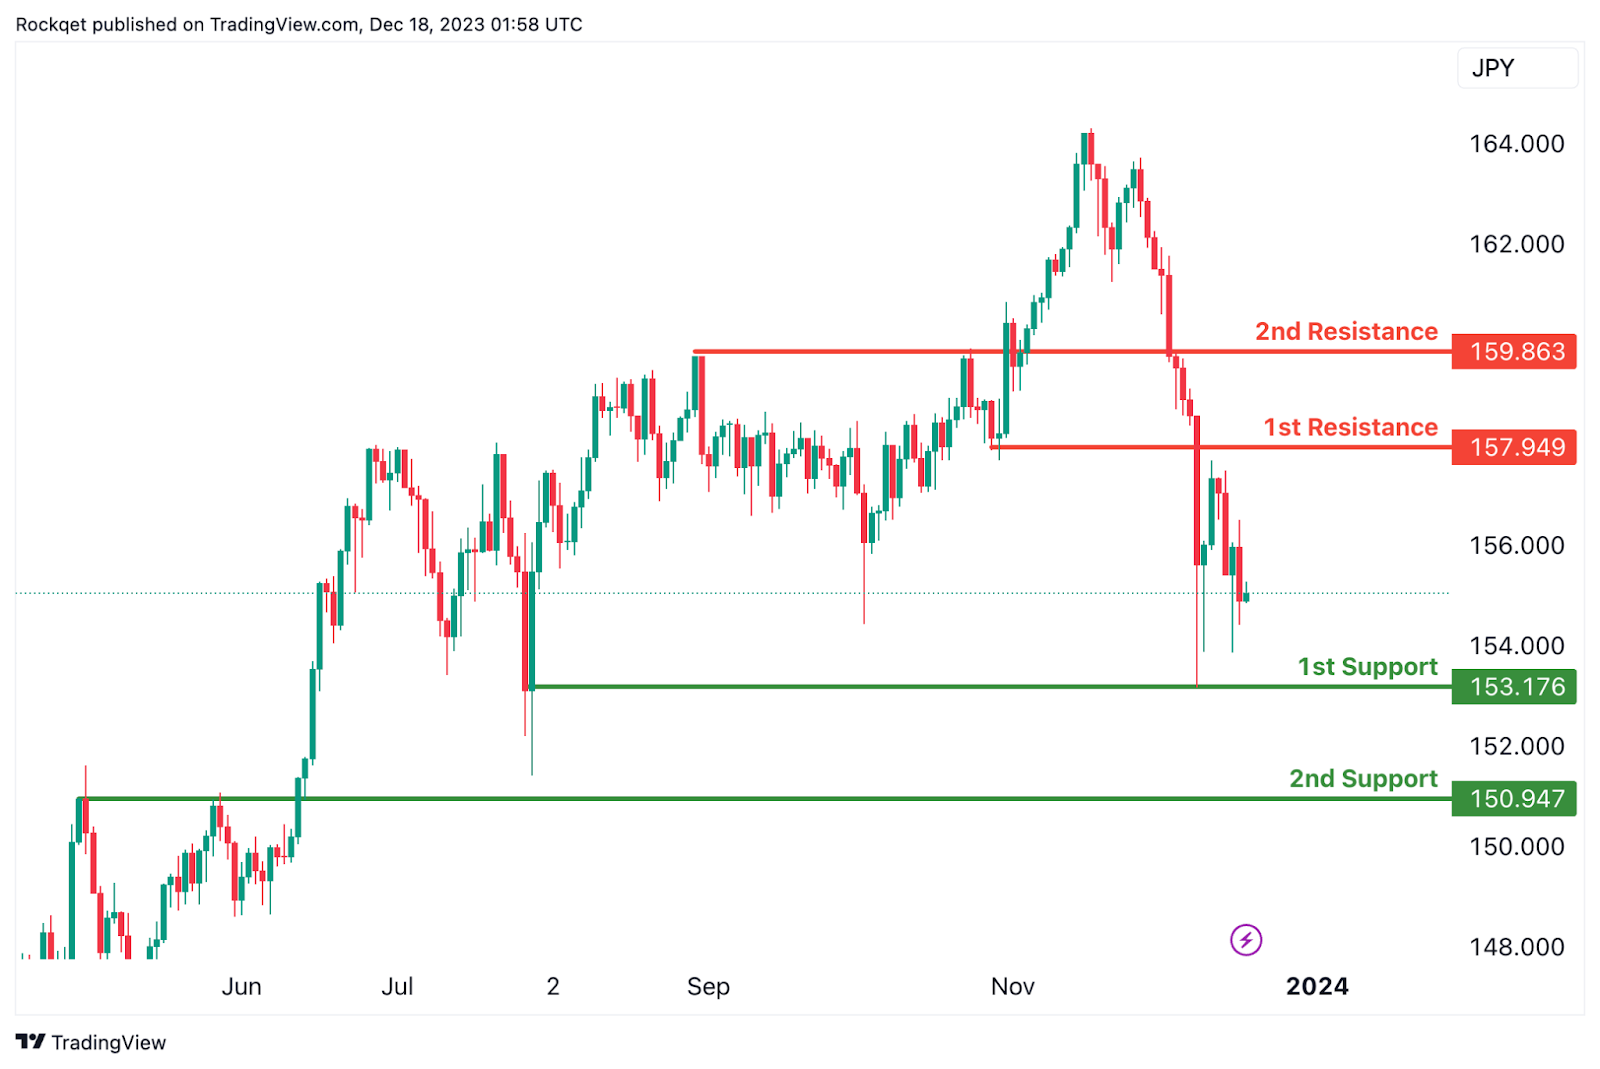
EUR/JPY:
The EUR/JPY chart currently has a bearish overall momentum, and there is a potential scenario where the price could make a short-term rise towards the 1st resistance before reversing off it and dropping towards the 1st support.
The 1st support at 154.92 is considered significant as it represents a pullback support. This level indicates a potential area where buying interest may emerge after a pullback, providing support for the currency pair.
Similarly, the 2nd support at 153.98 is identified as a swing low support. This adds to the support structure, indicating another potential zone where buying interest may be present, further reinforcing the potential for a short-term rise.
On the resistance side, the 1st resistance at 156.57 is associated with a pullback resistance. This level may act as a barrier where selling interest could intensify, potentially causing a temporary pause or reversal in the bearish trend.
Furthermore, the 2nd resistance at 157.95 is characterized as a pullback resistance. This adds another layer of significance to the resistance, suggesting a potential area where selling pressure may increase, especially considering the alignment with another pullback resistance level.
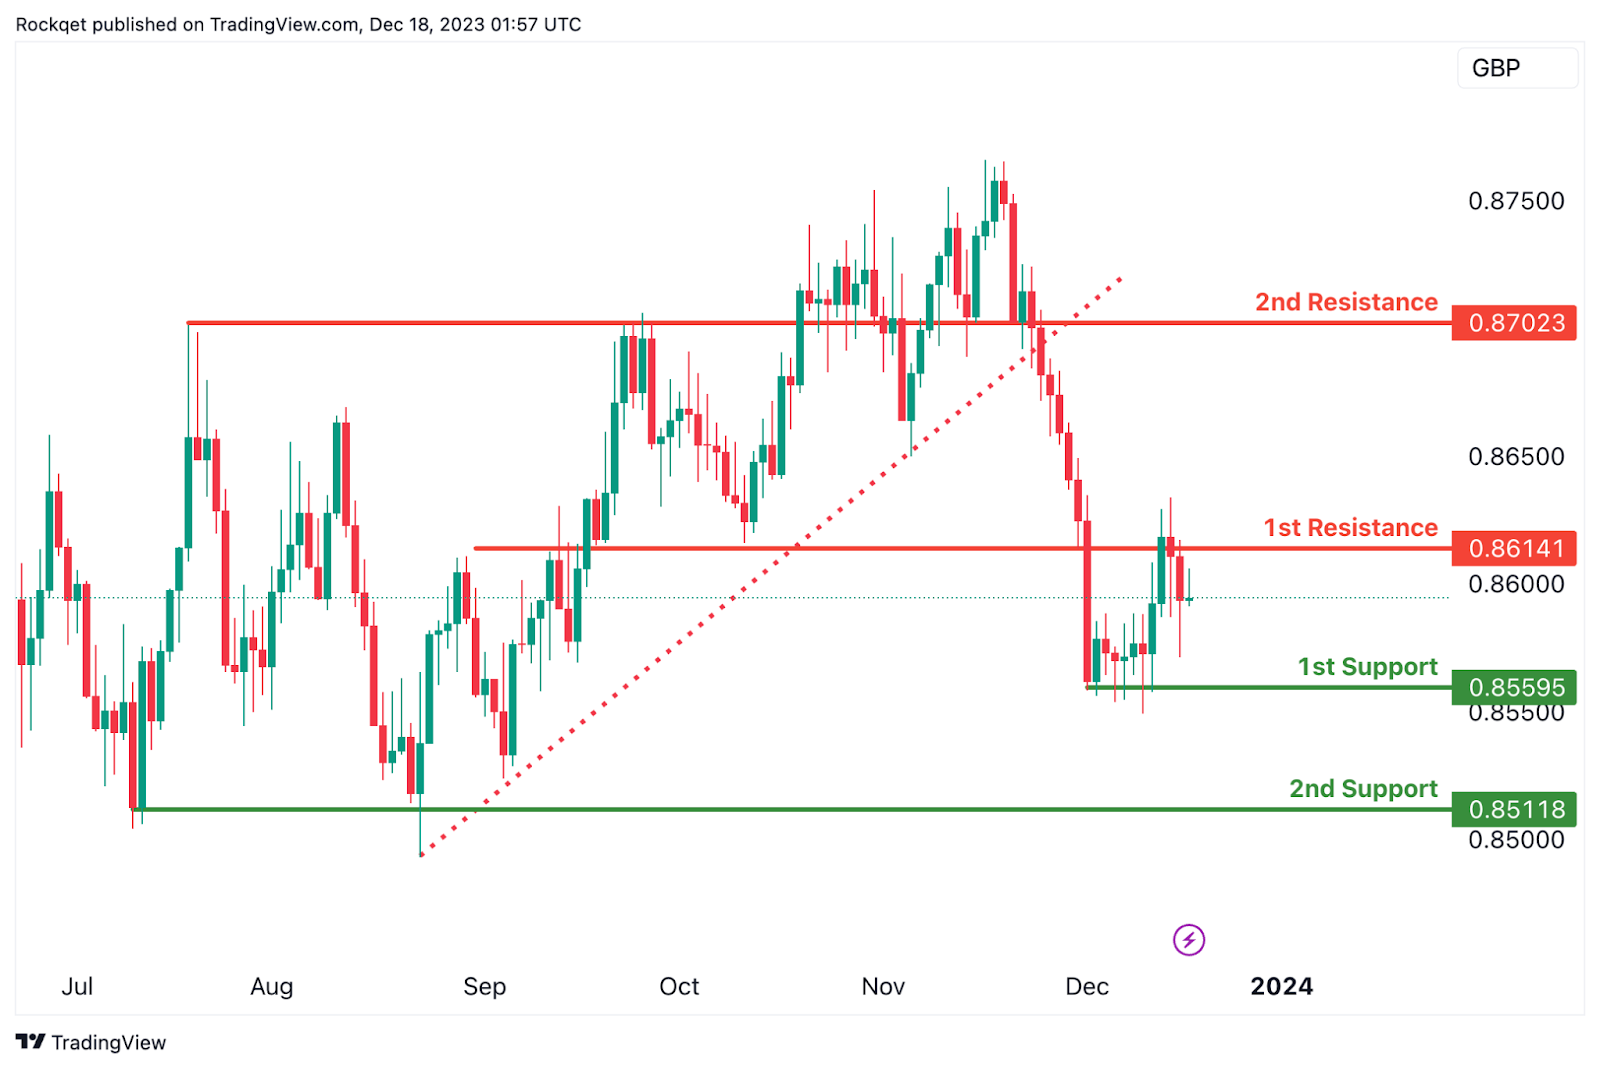
EUR/GBP:
The EUR/GBP chart currently has a bearish overall momentum, suggesting a potential for a bearish continuation towards the 1st support.
The 1st support at 0.8560 is considered significant as it represents a multi-swing low support. This level indicates a historical area where buying interest has been present, reinforcing its potential as a crucial support zone.
Similarly, the 2nd support at 0.8512 is identified as a pullback support. This adds another layer of potential support for the currency pair, indicating a zone where buying interest may emerge after a pullback.
On the resistance side, the 1st resistance at 0.8614 is associated with an overlap resistance. This level may act as a barrier where selling interest could intensify, potentially causing a temporary pause or reversal in the bearish trend.
Furthermore, the 2nd resistance at 0.8702 is characterized as another overlap resistance. This adds another layer of significance to the resistance, suggesting a potential area where selling pressure may increase, especially considering its alignment with another overlap resistance level.
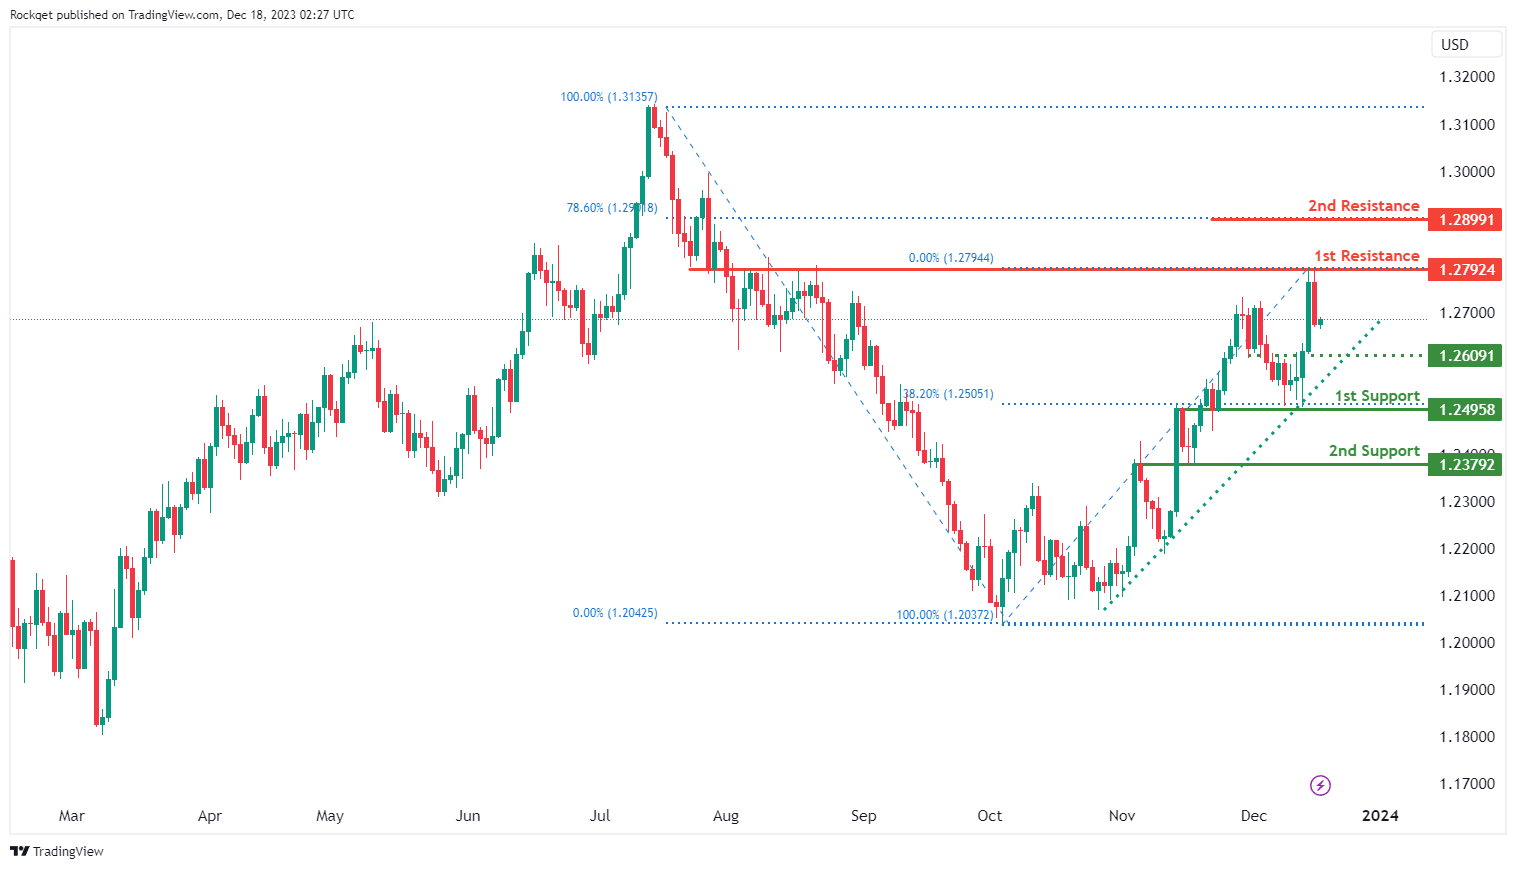
GBP/USD:
The GBP/USD chart currently exhibits an overall bullish momentum. In this context, there is a potential scenario for price to make a bullish continuation towards the 1st resistance.
The 1st resistance level at 1.2792 is identified as an overlap resistance. Higher up, the 2nd resistance level at 1.2899 is marked as a pullback resistance that aligns with the 78.60% Fibonacci retracement level, suggesting a potential barrier for further upside movement.
To the downside, the intermediate support level at 1.2609 is identified as an overlap support while the 1st support level at 1.2495 is also noted as an overlap support that aligns with the 38.20% Fibonacci retracement level. Further below, the 2nd support level at 1.2379 is marked as an overlap support, further reinforcing its importance as a potential key support level.
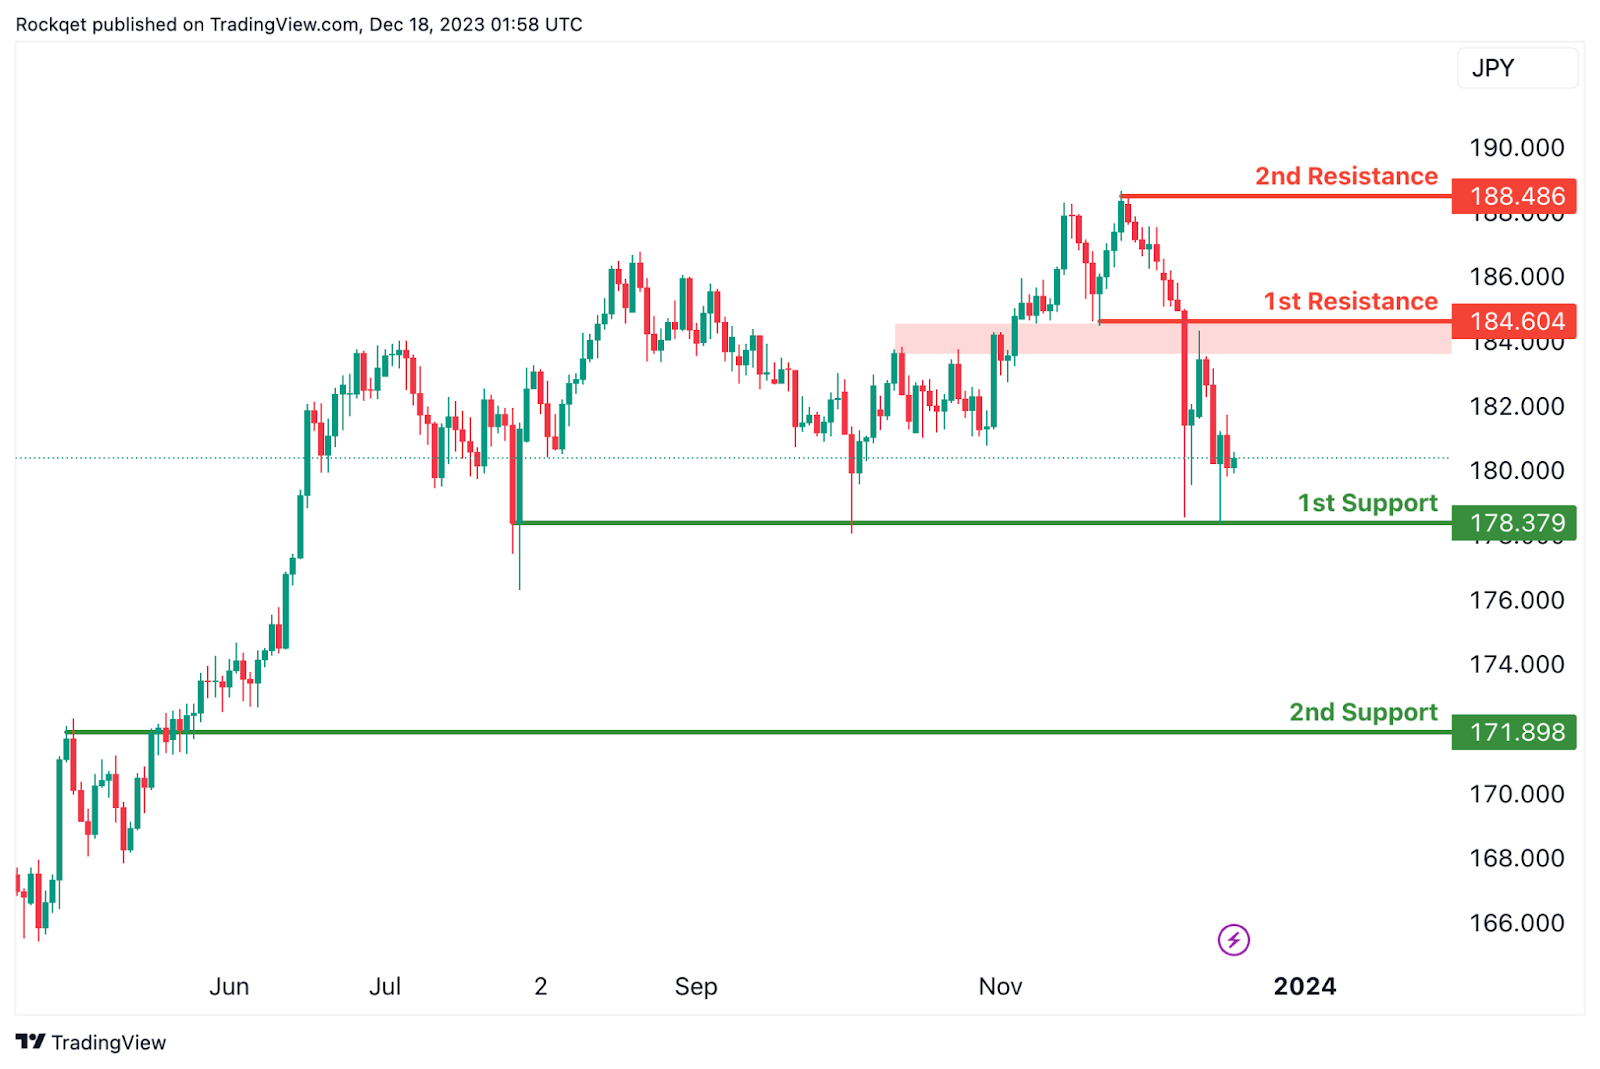
GBP/JPY:
The GBP/JPY chart currently has a bearish overall momentum, suggesting a potential for a bearish continuation towards the 1st support.
The 1st support at 178.38 is considered significant as it represents a swing low support. This level indicates a historical area where buying interest has been present, reinforcing its potential as a crucial support zone.
Similarly, the 2nd support at 171.90 is identified as an overlap support. This adds another layer of potential support for the currency pair, indicating a zone where buying interest may emerge, particularly considering its alignment with an overlap level.
On the resistance side, the intermediate resistance at 188.60 is associated with a pullback resistance. This level may act as a barrier where selling interest could intensify, potentially causing a temporary pause or reversal in the bearish trend.
Furthermore, the 1st resistance at 188.49 is characterized as a swing high resistance. This adds further significance to the resistance, suggesting a potential area where selling pressure may increase, especially considering its alignment with a previous swing high.
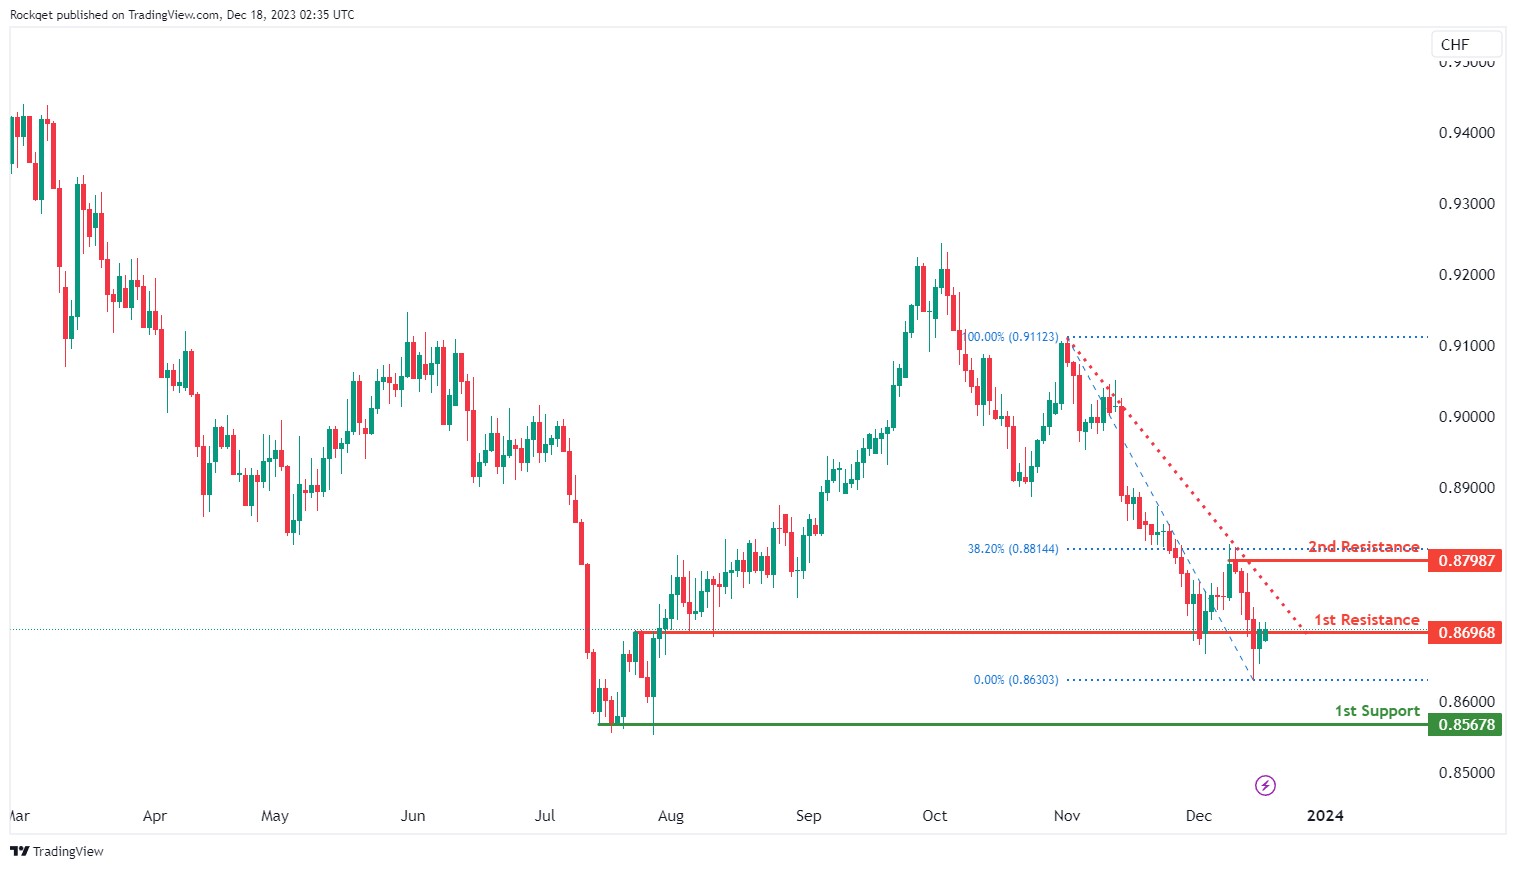
USD/CHF:
The USD/CHF chart currently exhibits an overall bearish momentum. In this context, there is a potential scenario for price to make a bearish reaction off the 1st resistance and drop towards the 1st support.
The 1st resistance level at 0.8696 is identified as an overlap resistance. Higher up, the 2nd resistance level at 0.8798 is marked as a pullback resistance that aligns close to the 38.20% Fibonacci retracement level, suggesting a potential barrier for further upside movement.
To the downside, the 1st support level at 0.8567 is identified as a swing-low support, further reinforcing its importance as a key support level.
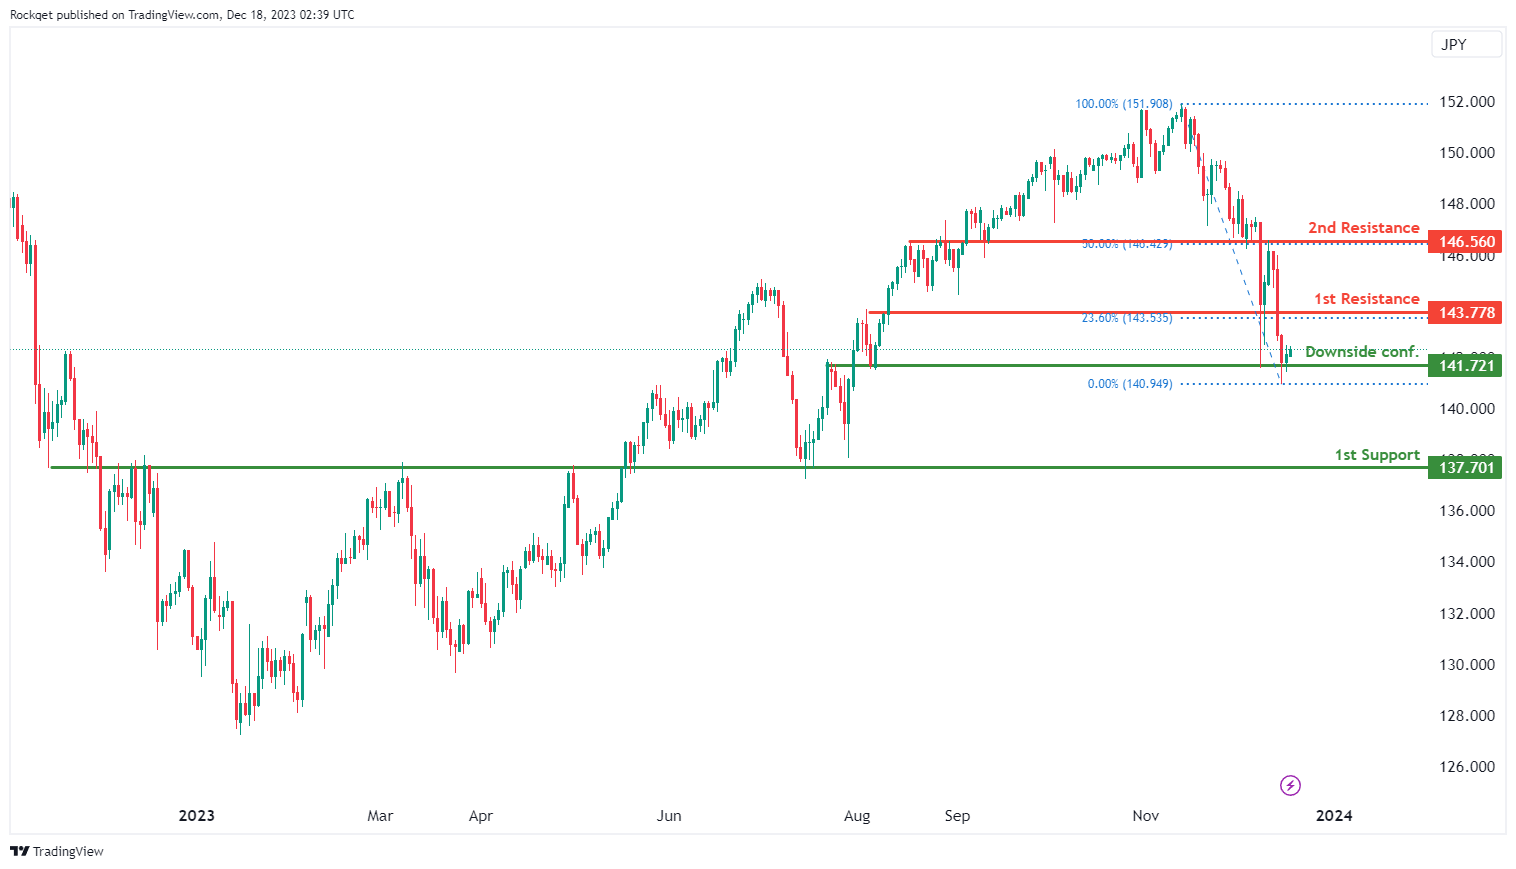
USD/JPY:
The USD/JPY chart currently exhibits an overall bearish momentum, indicating a potential for a drop towards the 1st support should price break below the downside confirmation level.
The downside confirmation level at 141.72 is identified as an overlap support. Further below, the 1st support level at 137.70 is also noted as an overlap support, further reinforcing its importance as a key support level.
To the upside, the 1st resistance level at 143.77 is identified as an overlap resistance that aligns with the 23.60% Fibonacci retracement level. Higher up, the 2nd resistance level at 146.56 is also marked as an overlap resistance that aligns with the 50.00% Fibonacci retracement level, suggesting a potential barrier for further upside movement.
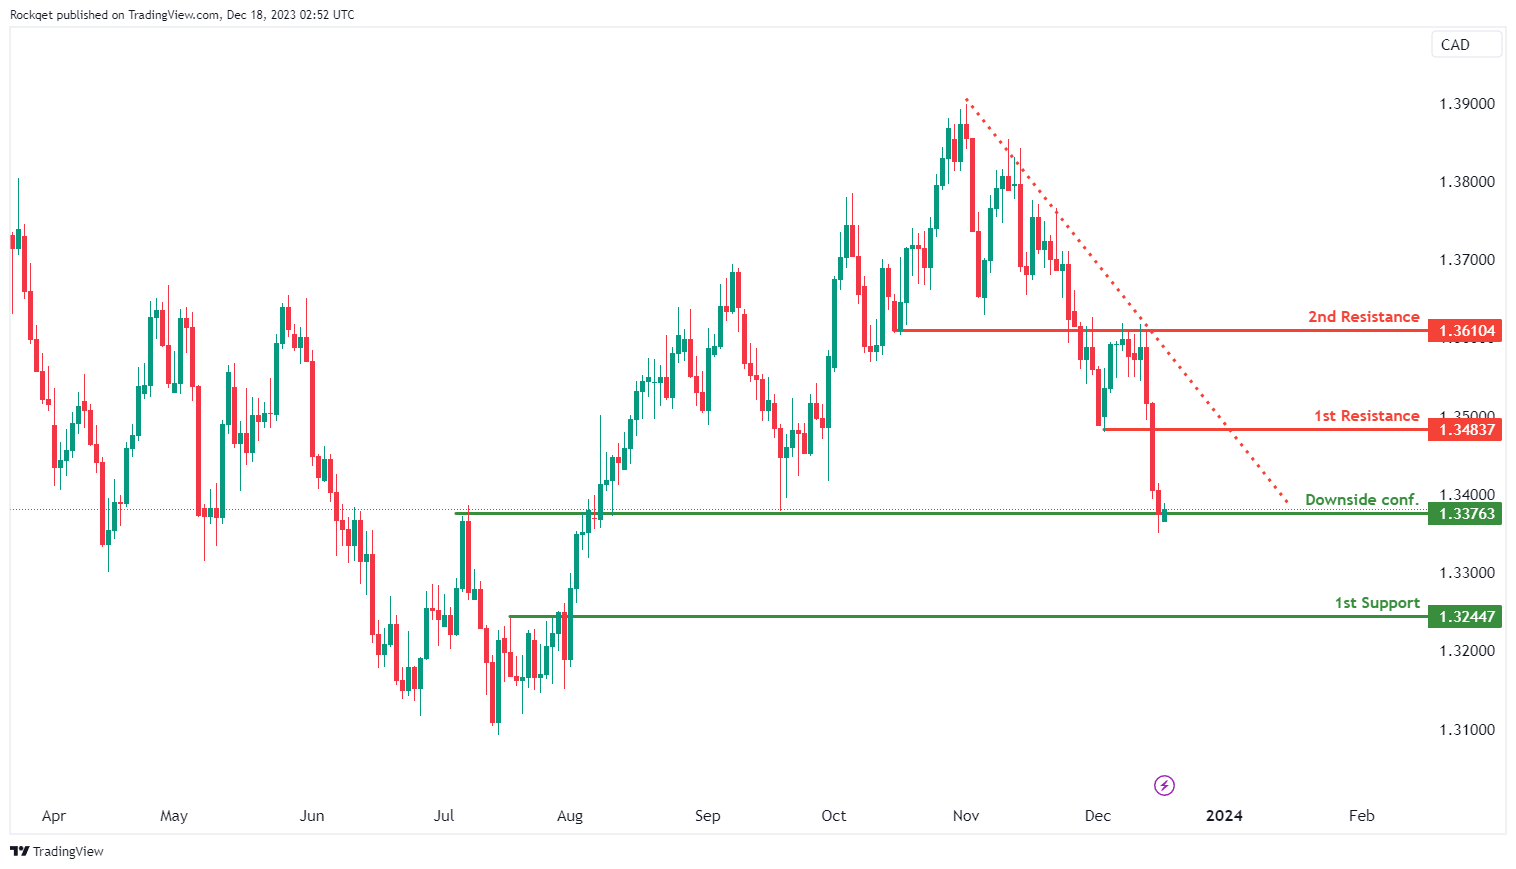
USD/CAD:
The USD/CAD chart currently exhibits an overall bearish momentum, indicating a potential for a drop towards the 1st support should price break below the downside confirmation level.
The downside confirmation level at 1.3376 is identified as an overlap support. Further below, the 1st support level at 1.3244 is noted as a pullback support, further reinforcing its importance as a key support level.
To the upside, the 1st resistance level at 1.3483 is identified as a pullback resistance while the 2nd resistance level at 1.3610 is noted as an overlap resistance, suggesting a potential barrier for further upside movement.
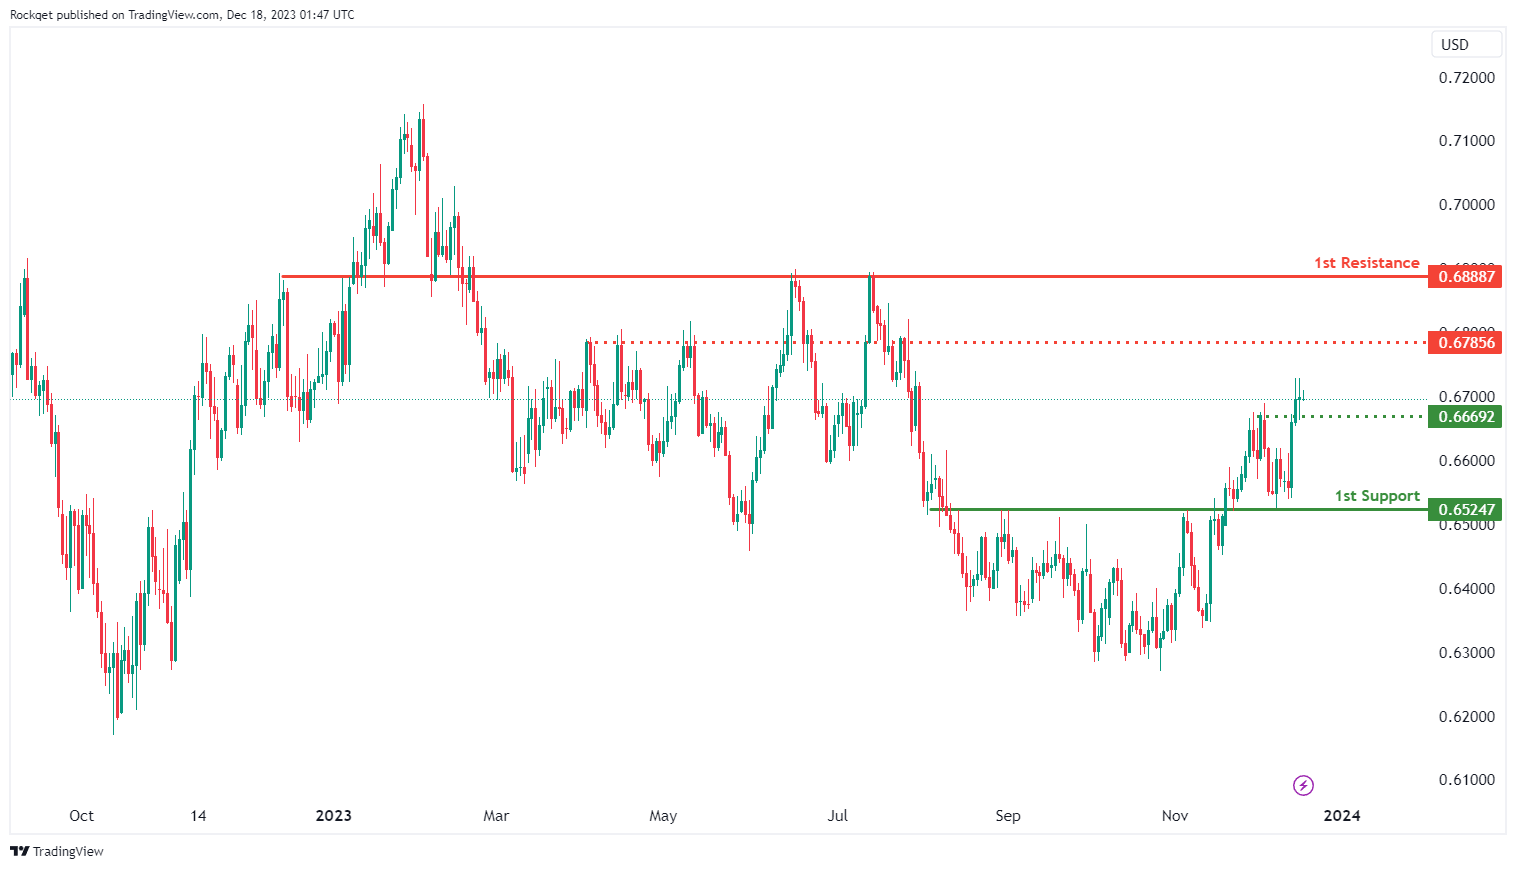
AUD/USD:
The AUD/USD chart currently exhibits an overall bullish momentum. In this context, there is a potential scenario for price to make a bullish continuation towards the intermediate resistance.
The intermediate resistance level at 0.6785 is identified as an overlap resistance. Higher up, the 1st resistance level at 0.6888 is also noted as an overlap resistance, indicating its potential significance as a barrier for further upward movement.
To the downside, the intermediate support level at 0.6669 is identified as an overlap support. Further below, the 1st support level at 0.6524 is also marked as an overlap support, further reinforcing its importance as a key support level.
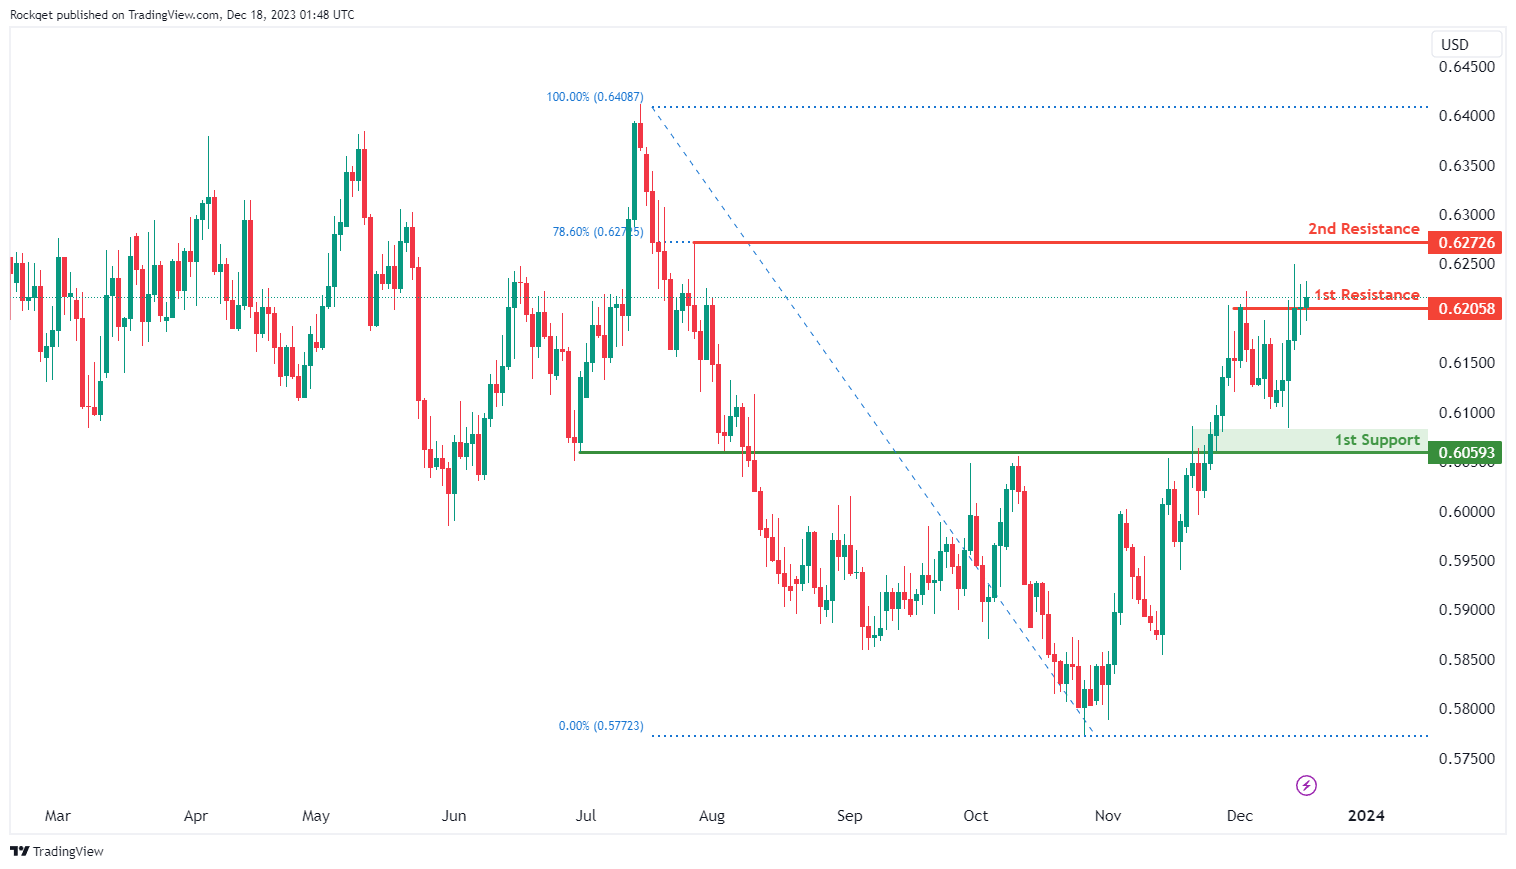
NZD/USD
The NZD/USD chart currently exhibits an overall bullish momentum. In this context, there is a potential scenario for price to break above the 1st resistance and make a bullish continuation towards the 2nd resistance.
The 1st resistance level at 0.6205 is identified as a pullback resistance. Higher up, the 2nd resistance level at 0.6272 is also marked as a pullback resistance that aligns with the 78.60% Fibonacci retracement level, indicating its potential significance as a barrier for further upward movement.
To the downside, the 1st support level at 0.6059 is identified as an overlap support, further reinforcing its importance as a key support level.
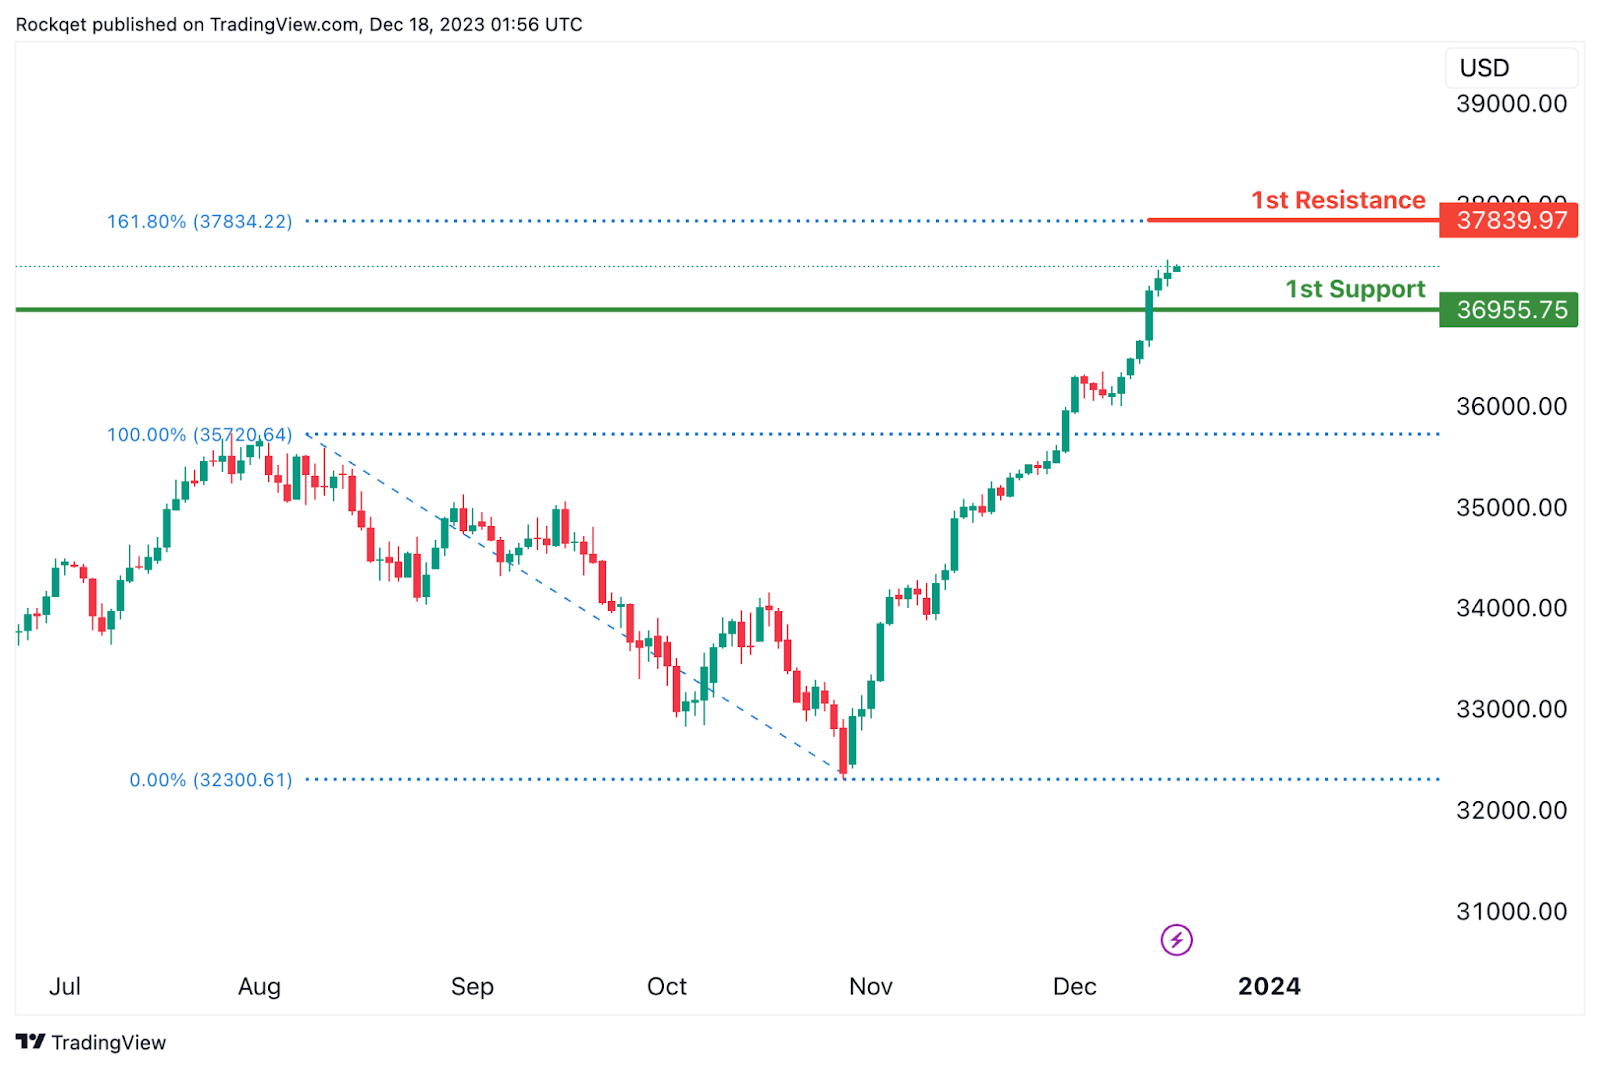
DJ30:
The DJ30 chart currently displays a bullish overall momentum, suggesting a potential for a bullish continuation towards the 1st resistance.
The 1st support at 36955.75 is considered significant as it represents a pullback support. This level indicates a potential area where buying interest may emerge after a pullback, providing support for the index.
On the resistance side, the 1st resistance at 37839.97 is associated with the 161.80% Fibonacci Extension. This Fibonacci extension level adds further significance to the resistance, suggesting a potential area where selling pressure may increase, especially considering the alignment with this extension level.
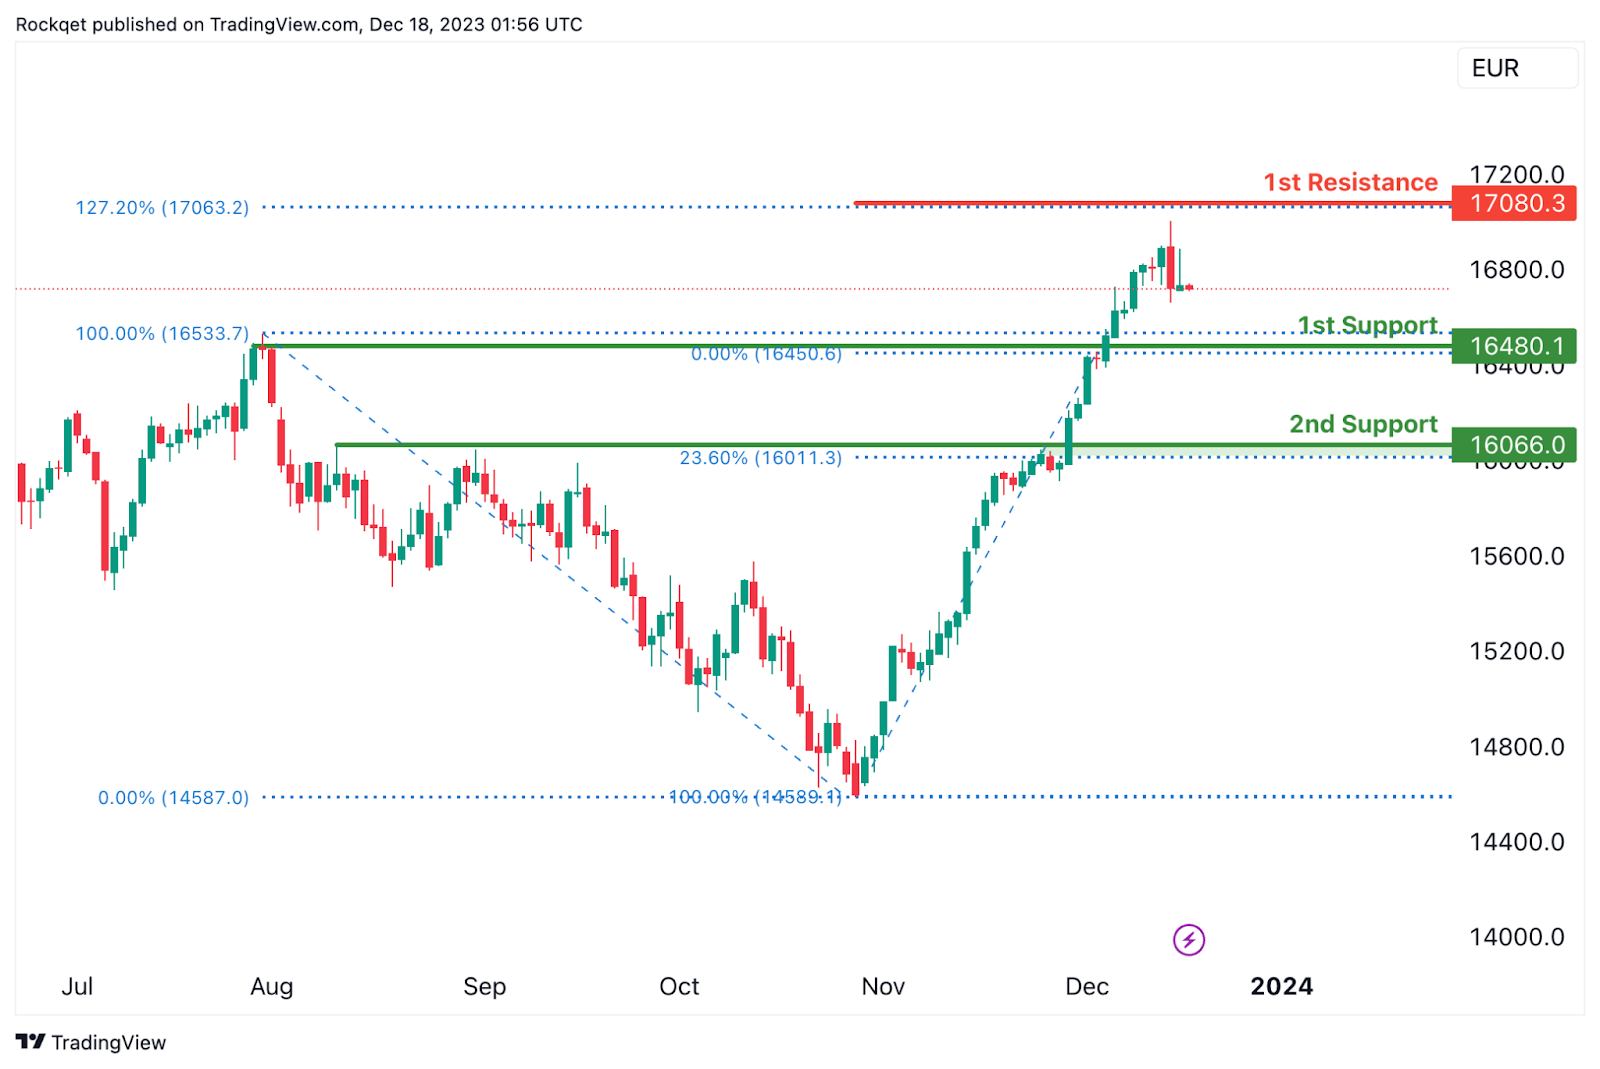
GER40:
The GER40 chart currently has a bearish overall momentum, and there is a potential scenario for a bearish continuation towards the 1st support.
The 1st support at 16480.10 is considered significant as it represents a pullback support and coincides with the 100% Fibonacci Retracement level. This level indicates a potential area where buying interest may emerge after a pullback, providing support for the index.
Similarly, the 2nd support at 16066.00 is identified as another pullback support and aligns with the 23.60% Fibonacci Retracement level. This adds another layer of potential support, indicating a zone where buying interest may be present, further reinforcing the potential for a bearish continuation.
On the resistance side, the 1st resistance at 17080.30 is associated with the 127.20% Fibonacci Extension. This Fibonacci extension level adds further significance to the resistance, suggesting a potential area where selling pressure may increase, especially considering the alignment with this extension level.
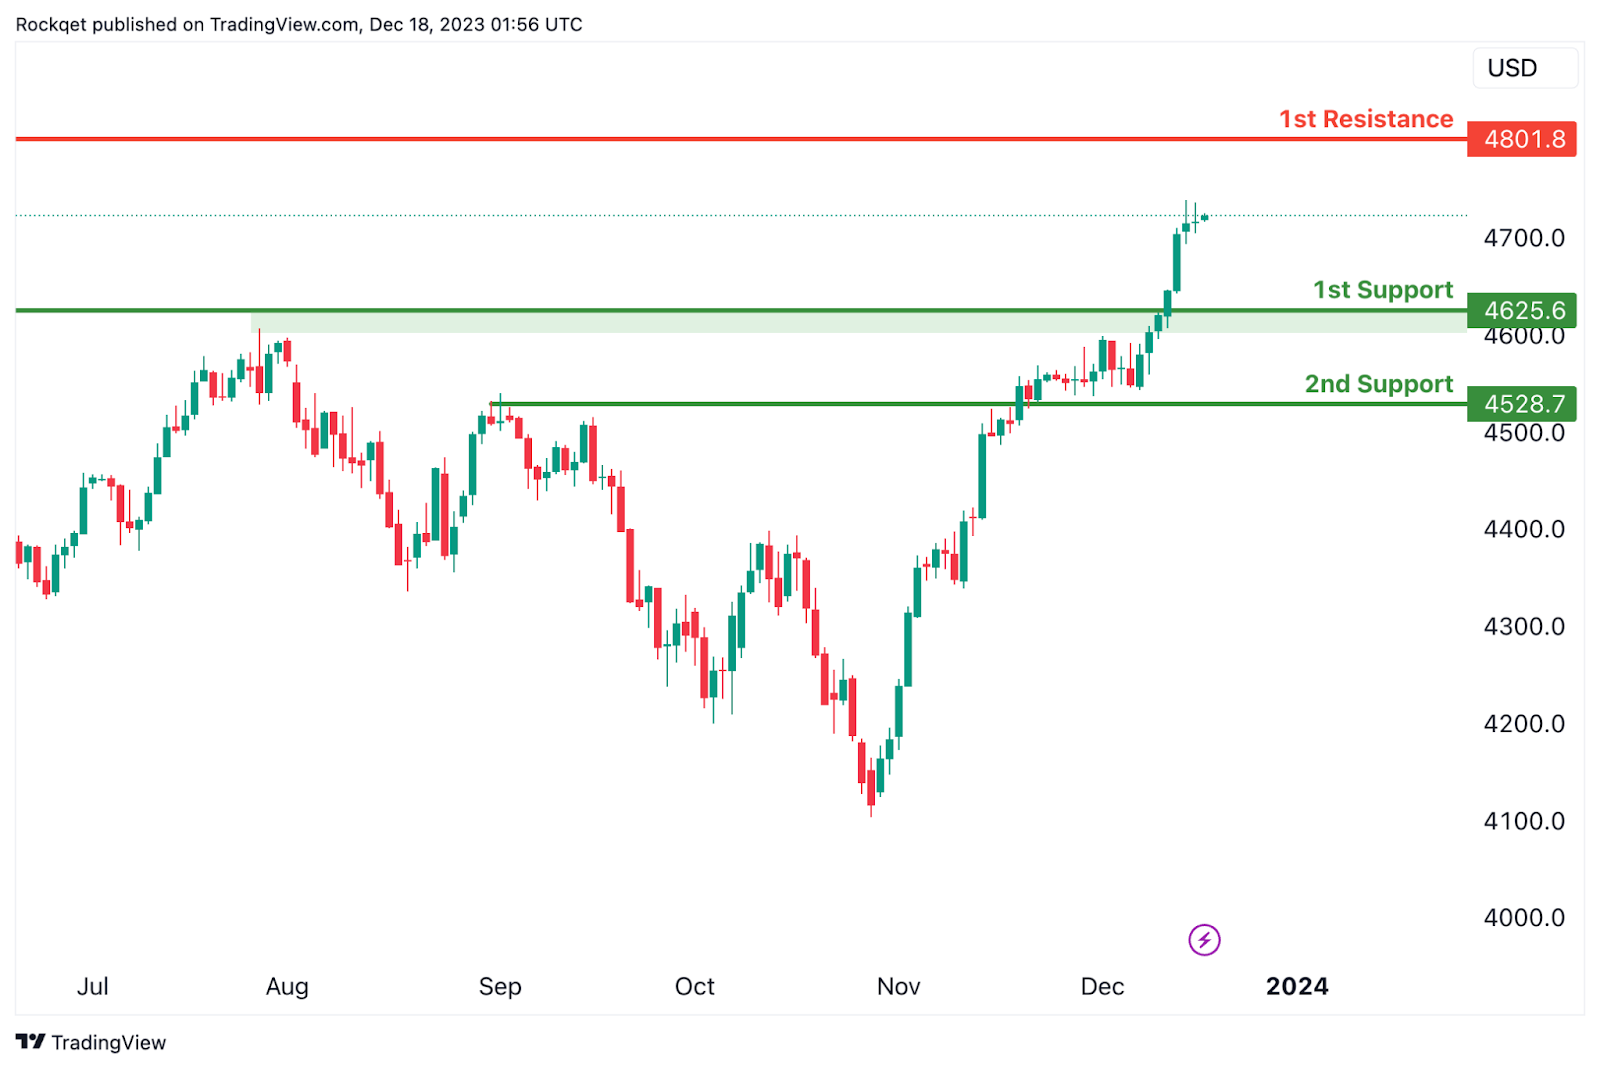
US500:
The US500 chart currently has a bullish overall momentum, and there is a potential scenario for a short-term drop to the 1st support before bouncing from there and rising to the 1st resistance.
The 1st support at 4625.6 is considered significant as it represents a pullback support. This level indicates a potential area where buying interest may emerge after a pullback, providing support for the index.
Similarly, the 2nd support at 4528.7 is identified as an overlap support. This adds another layer of potential support, indicating a zone where buying interest may be present, further reinforcing the potential for a bounce.
On the resistance side, the 1st resistance at 4801.8 is associated with a swing high resistance. This level may act as a barrier where selling interest could intensify, potentially causing a temporary pause or reversal in the bullish trend.
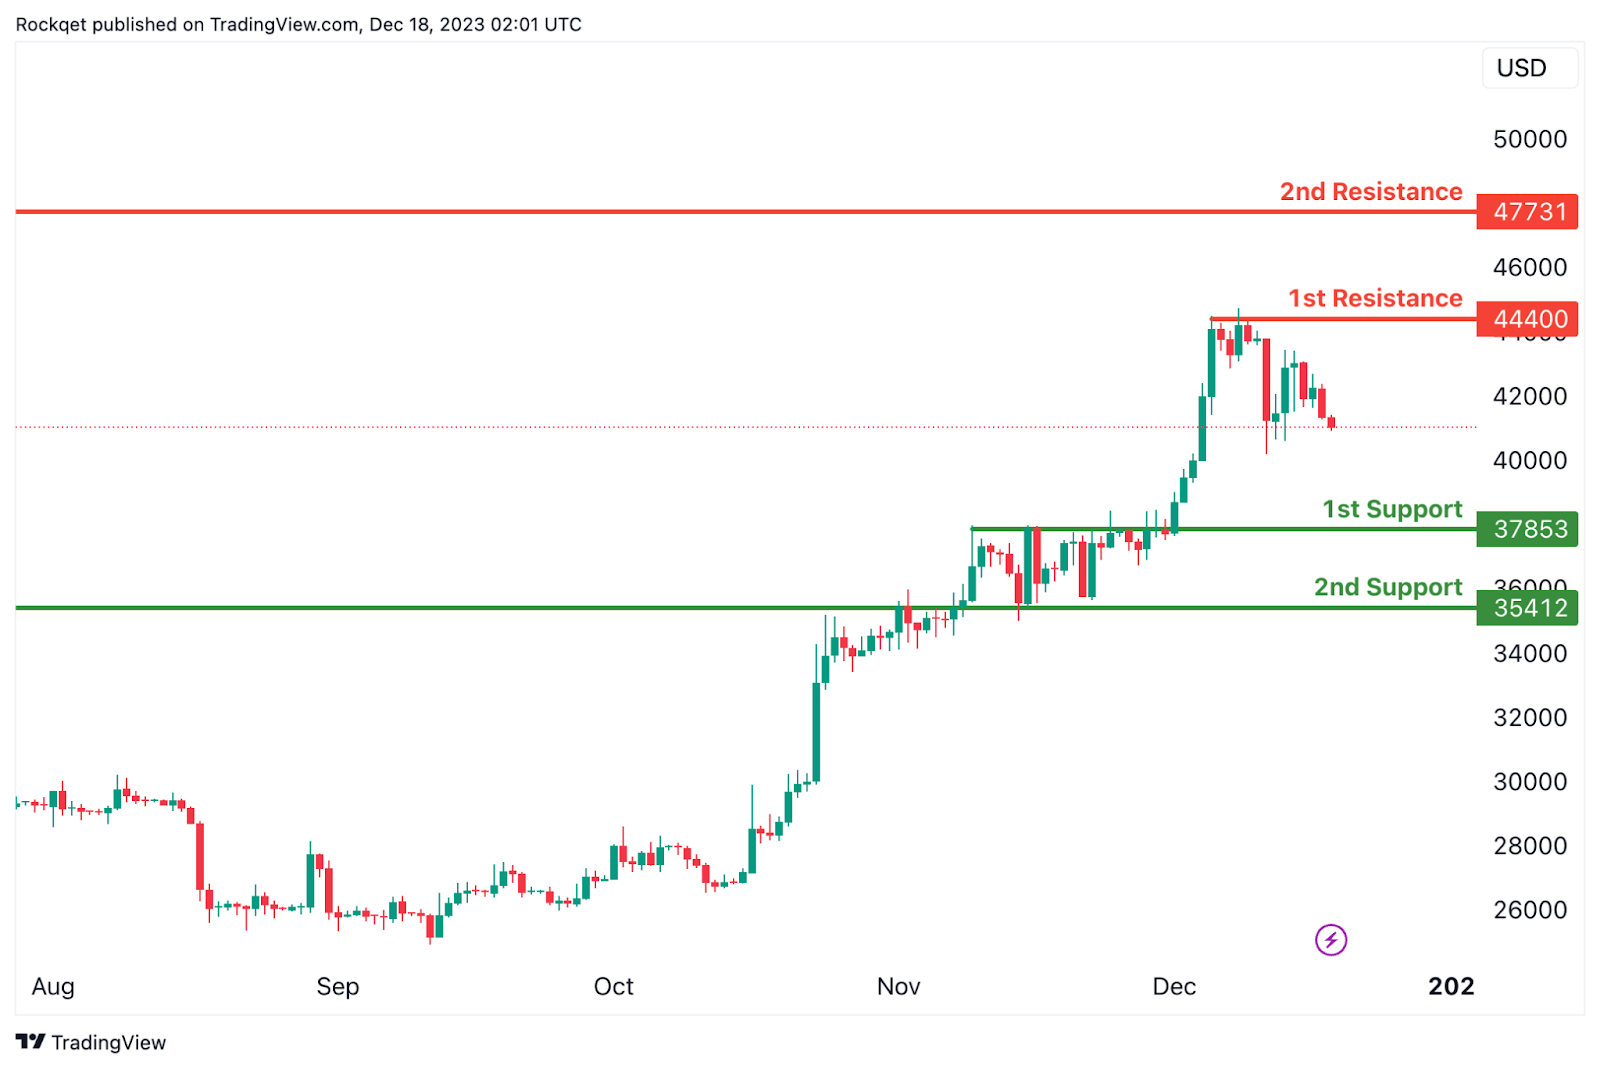
BTC/USD:
The BTC/USD chart currently exhibits a weak bearish momentum with low confidence, suggesting a potential for a bearish continuation towards the 1st support.
The 1st support at 37853 is considered significant as it represents an overlap support. This level indicates a historical area where buying interest has been present, reinforcing its potential as a crucial support zone.
Similarly, the 2nd support at 35412 is identified as another overlap support. This adds another layer of potential support for the cryptocurrency, indicating a zone where buying interest may emerge, particularly considering its alignment with an overlap level.
On the resistance side, the 1st resistance at 44400 is associated with a swing high resistance. This level may act as a barrier where selling interest could intensify, potentially causing a temporary pause or reversal in the bearish trend.
Furthermore, the 2nd resistance at 47731 is characterized as another swing high resistance. This adds further significance to the resistance, suggesting a potential area where selling pressure may increase, especially considering its alignment with a previous swing high.
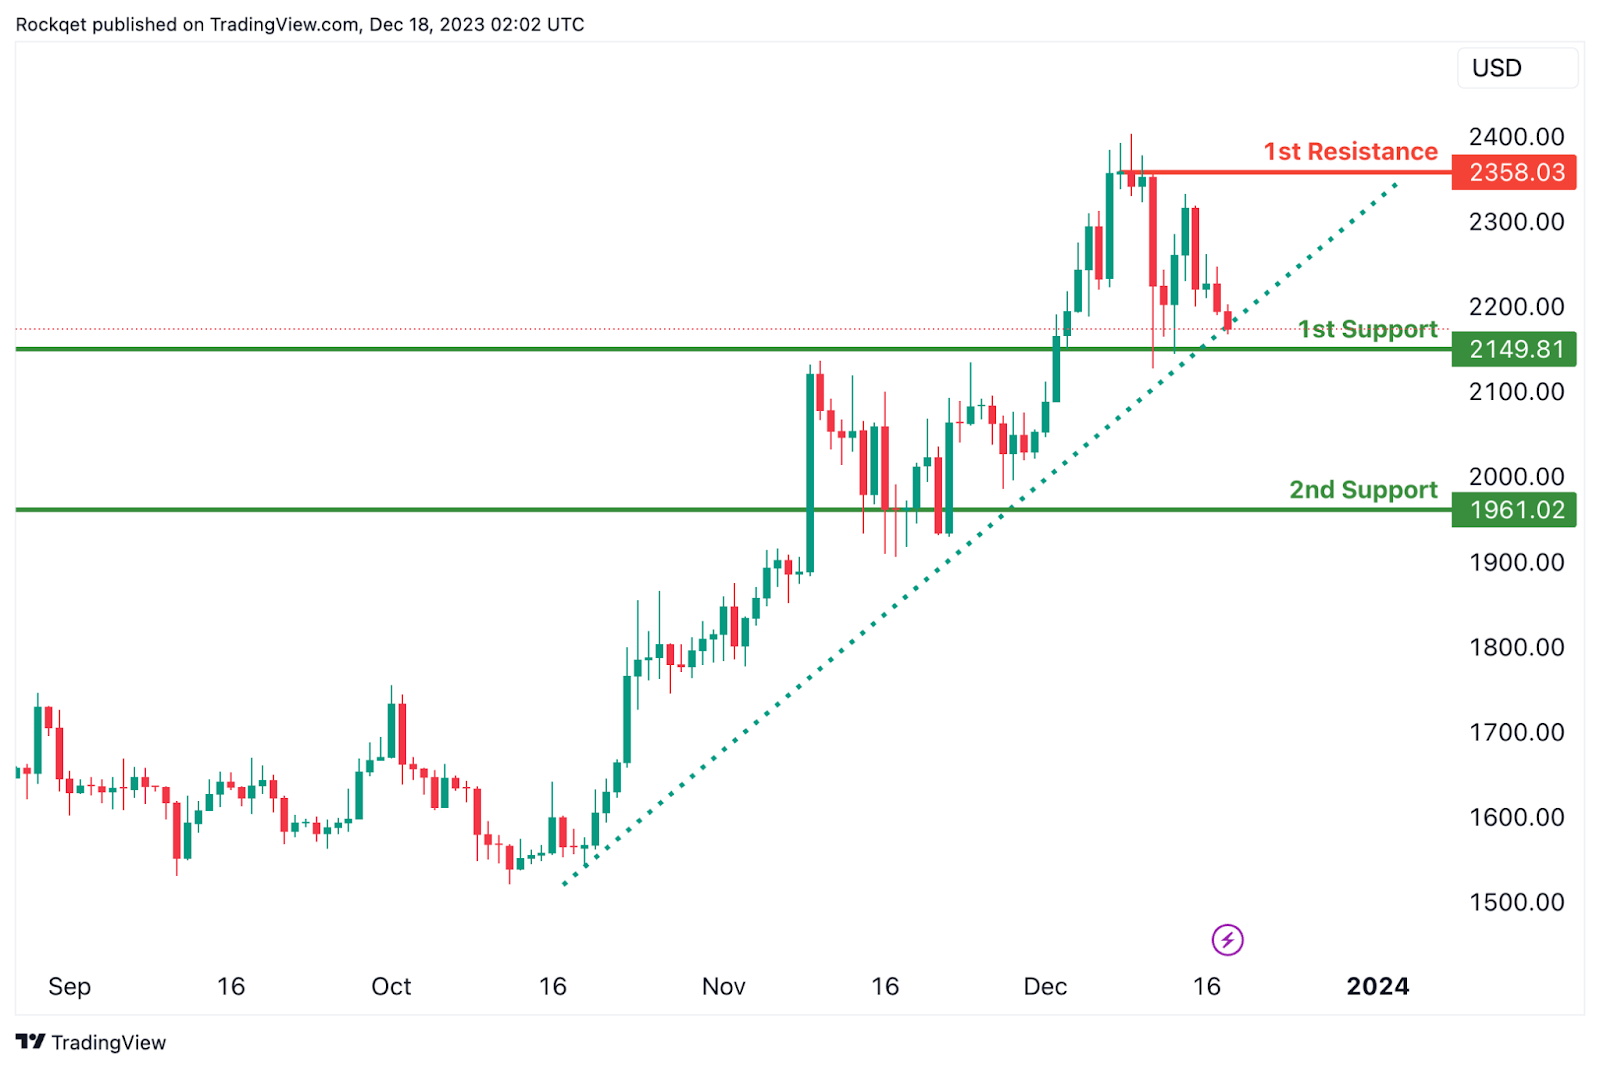
ETH/USD:
The ETH/USD chart currently has a bullish overall momentum, supported by the fact that the price is above a major ascending trend line, suggesting further bullish momentum.
There is a potential scenario for a short-term drop to the 1st support before bouncing from there and rising to the 1st resistance.
The 1st support at 2149.81 is considered significant as it represents an overlap support. This level indicates a historical area where buying interest has been present, reinforcing its potential as a crucial support zone.
Similarly, the 2nd support at 1961.02 is identified as a pullback support. This adds another layer of potential support for the cryptocurrency, indicating a zone where buying interest may emerge after a pullback.
On the resistance side, the 1st resistance at 2358.03 is associated with a swing high resistance. This level may act as a barrier where selling interest could intensify, potentially causing a temporary pause or reversal in the bullish trend.
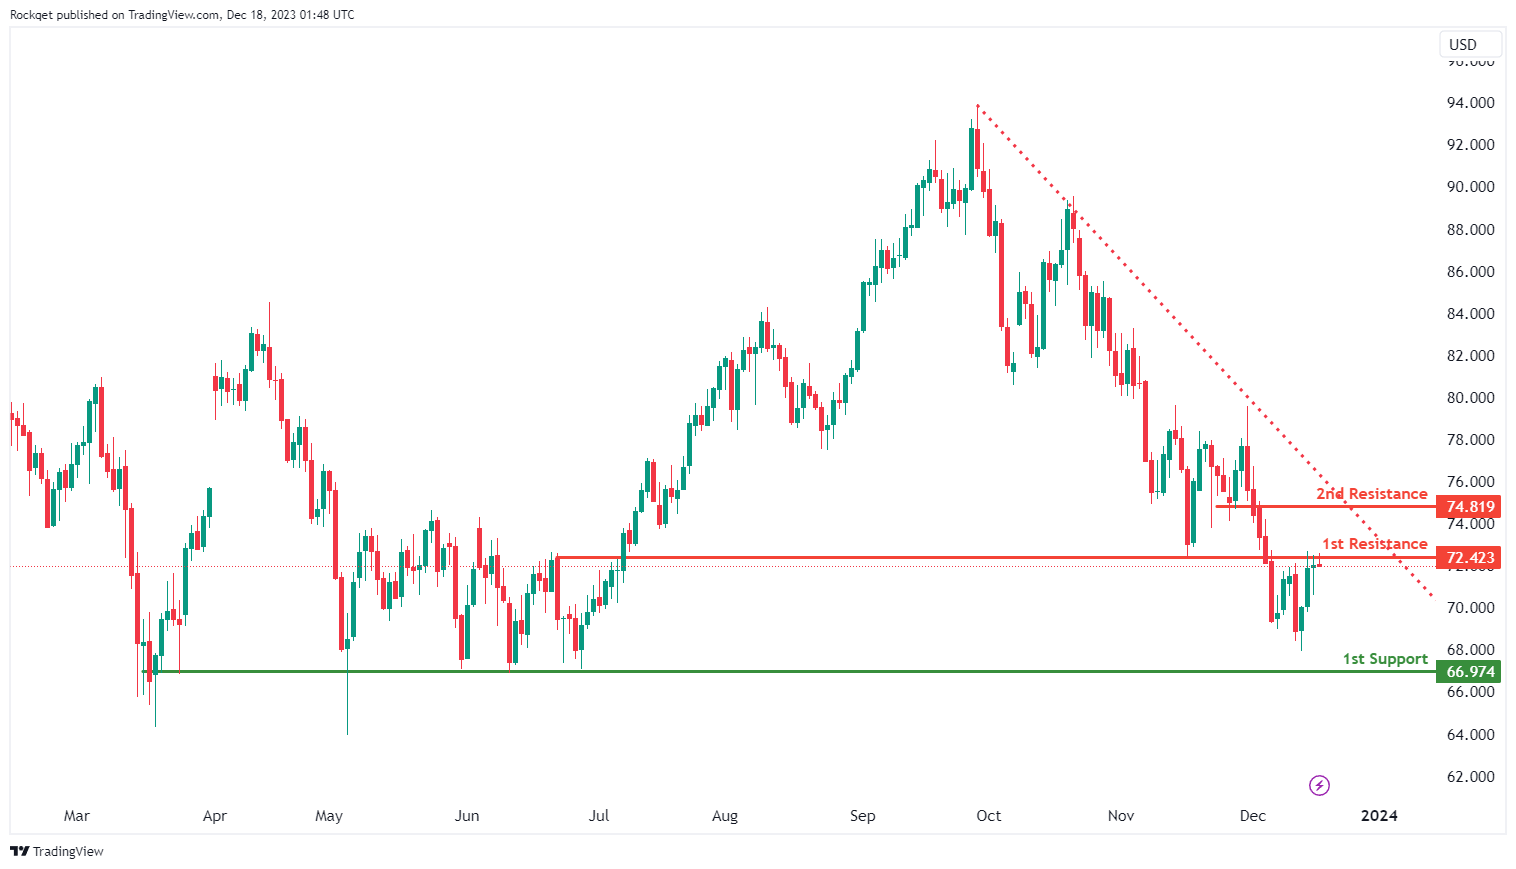
WTI/USD:
The WTI chart currently exhibits an overall bearish momentum, suggesting a prevailing downward trend. In this context, there is a potential scenario for price to make a bearish reaction off the 1st resistance before resuming the downtrend and falling towards the 1st support.
The 1st resistance level at 72.42 is identified as an overlap resistance. Higher up, the 2nd resistance level at 74.81 is marked as a pullback resistance, further indicating its potential significance as a barrier for further upward movement.
To the downside, the 1st support level at 66.97 is identified as a multi-swing-low support, reinforcing its importance as a key support level.
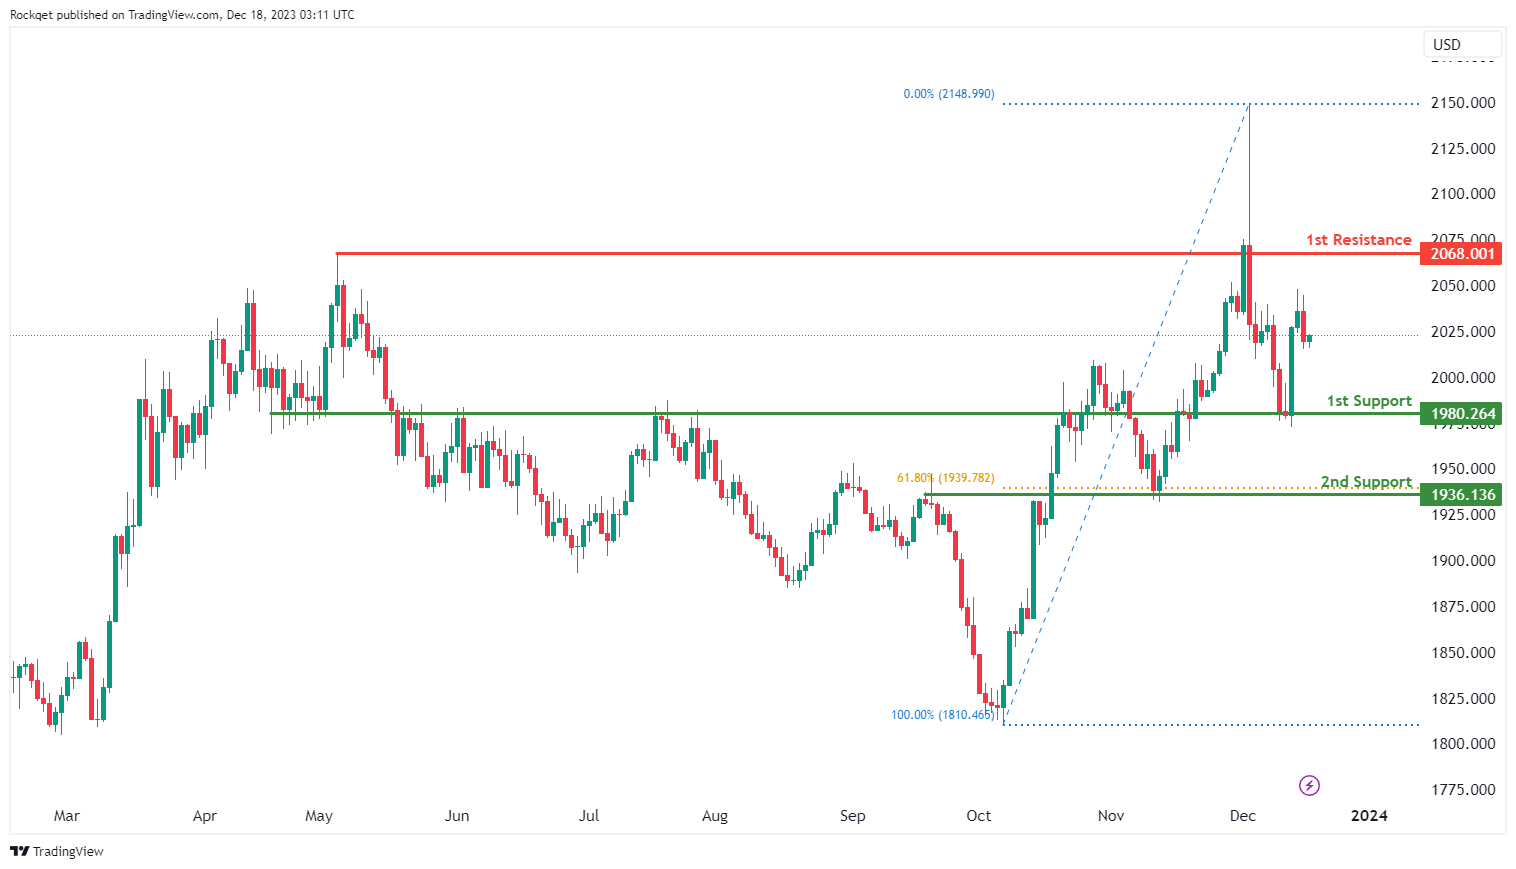
XAU/USD (GOLD):
The XAU/USD chart currently demonstrates a neutral momentum, indicating a potential for price to fluctuate between the 1st support and the 1st resistance.
The 1st support level at 1,980.26 is identified as an overlap support. Further below, the 2nd support level at 1,936.13 is also noted as an overlap support that aligns with the 61.80% Fibonacci retracement level, reinforcing its importance as a key support level.
On the resistance side, the 1st resistance level at 2,068.00 is identified as a multi-swing-high resistance, further indicating its potential significance as a barrier for further upward movement.
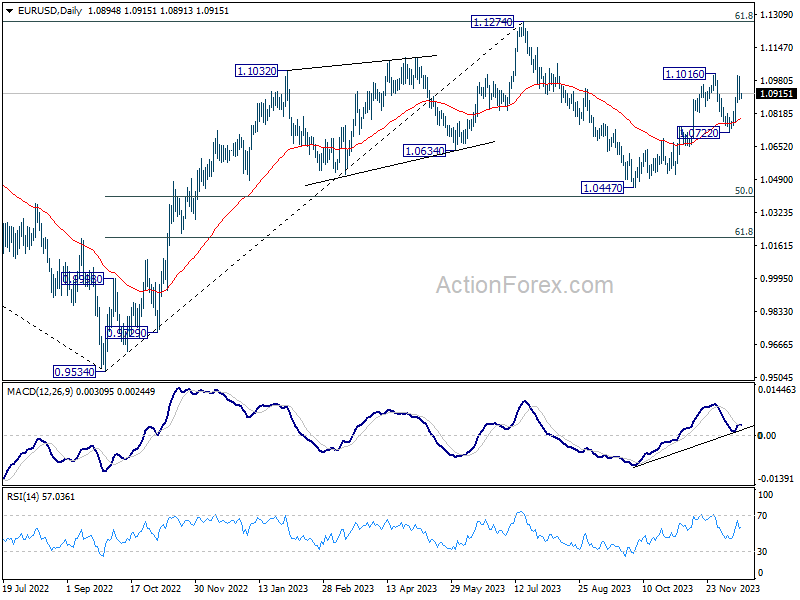
EUR/USD Daily Outlook
Daily Pivots: (S1) 1.0855; (P) 1.0929; (R1) 1.0970; More...
Intraday bias in EUR/USD stays neutral for the moment, as consolidation from 1.1016 is extending. Deeper retreat cannot be ruled out, but further rally is expected as long as 1.0722 support holds. On the upside, break of 1.1016 will resume the whole rise from 1.0447 to retest 1.1274 high.
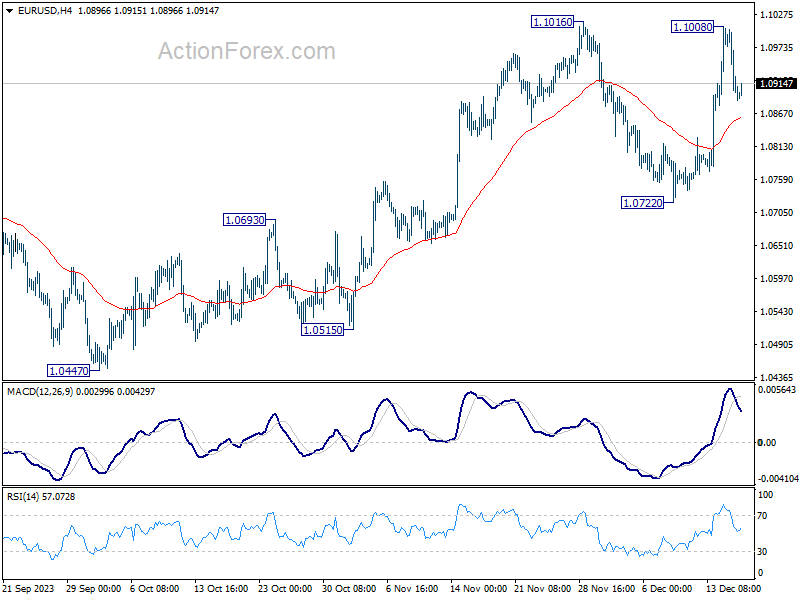
In the bigger picture, price actions from 1.1274 are viewed as a corrective pattern to rise from 0.9534 (2022 low). Rise from 1.0447 is seen as the second leg. While further rally could cannot be ruled out, upside should be limited by 1.1274 to bring the third leg of the pattern. Meanwhile, sustained break of 1.0722 support will argue that the third leg has already started for 1.0447 and below.
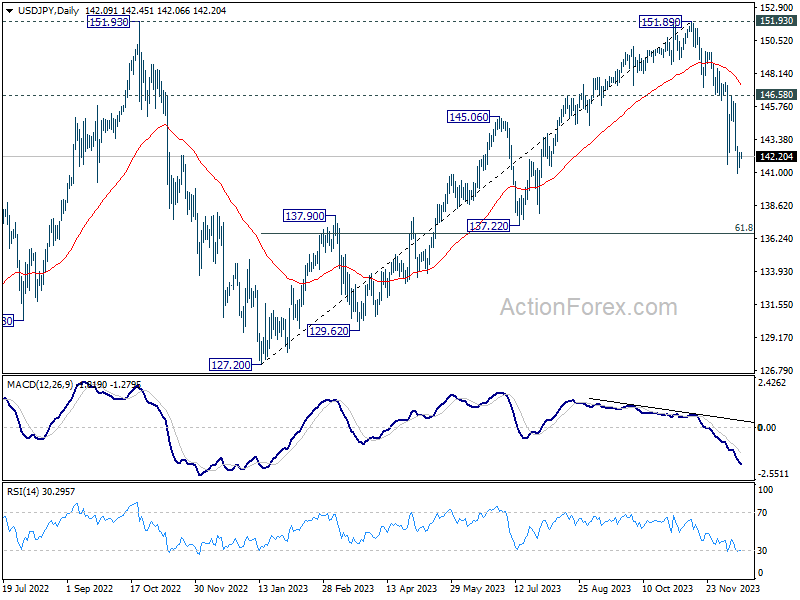
USD/JPY Daily Outlook
Daily Pivots: (S1) 141.57; (P) 142.02; (R1) 142.61; More...
Intraday bias in USD/JPY remains neutral as consolidation from 140.94 is extending. Stronger recovery cannot be ruled out. But upside should be limited well below 146.58 resistance to bring another decline. On the downside, break of 140.94 will resume the fall from 151.89 to next fibonacci level at 136.63.
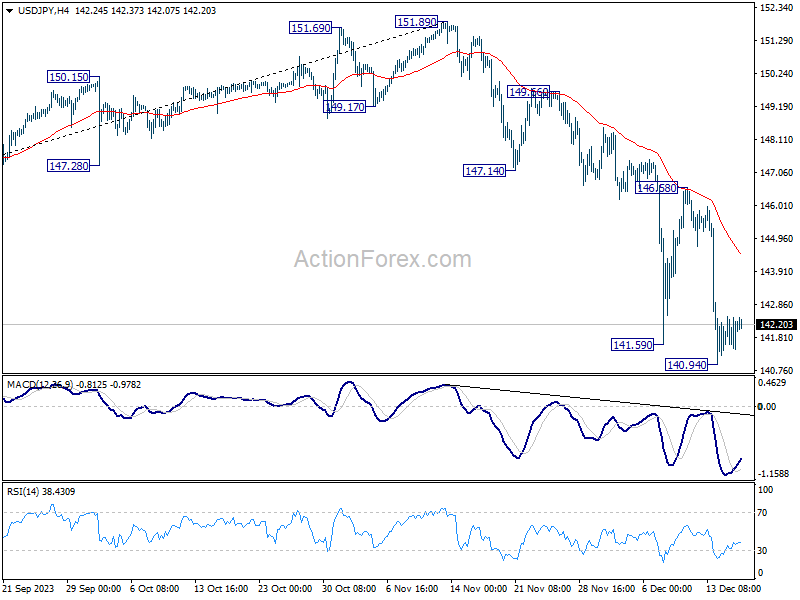
In the bigger picture, fall from 151.89 is seen as the third leg of the corrective pattern from 151.93 (2022 high). Deeper decline would be seen to 61.8% retracement of 127.20 to 151.89 at 136.63, sustained break there will pave the way to 127.20 support (2022 low). This will now remain the favored as long as 146.58 resistance holds.
GBP/USD Daily Outlook
Daily Pivots: (S1) 1.2638; (P) 1.2715; (R1) 1.2760; More...
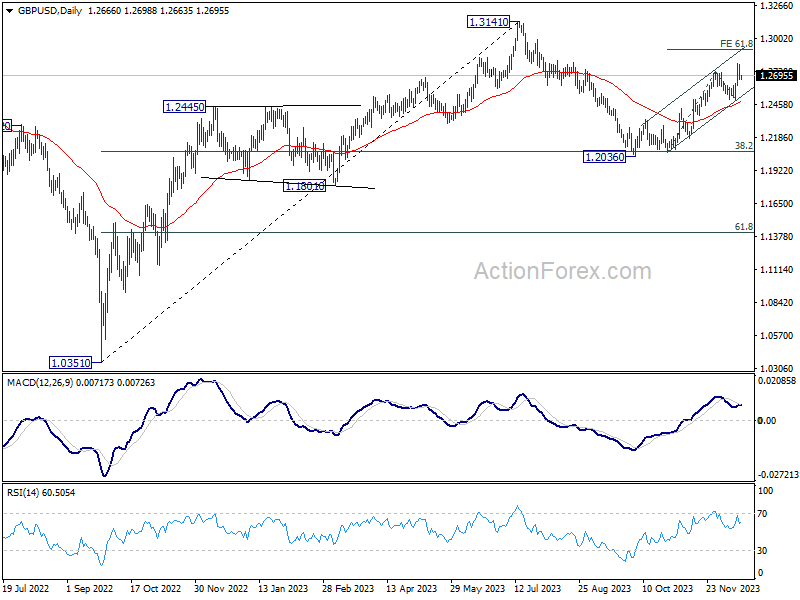
GBP/USD is staying in consolidation below 1.2793 and intraday bias remains neutral at this point. While deeper retreat cannot be ruled out, outlook will stay cautiously bullish as long as 1.2499 support holds. On the upside, firm break of 1.2793 will resume the rally from 1.2036. Next target is 61.8% projection of 1.2068 to 1.2731 from 1.2499 at 1.2909.
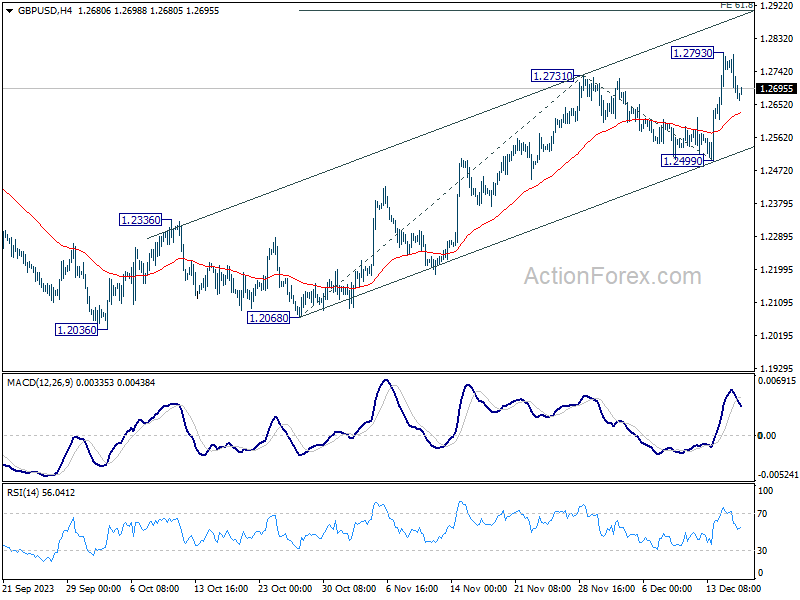
In the bigger picture, price actions from 1.3141 medium term top are seen as a corrective pattern to rise from 1.0351 (2022 low). Rise from 1.2036 is seen as the second leg that's in progress. Upside should be limited by 1.3141 to bring the third leg of the pattern. Meanwhile, break of 1.2499 support will argue that the third leg has already started for 38.2% retracement of 1.0351 (2022 low) to 1.3141 at 1.2075 again.
USD/CHF Daily Outlook
Daily Pivots: (S1) 0.8665; (P) 0.8689; (R1) 0.8726; More....
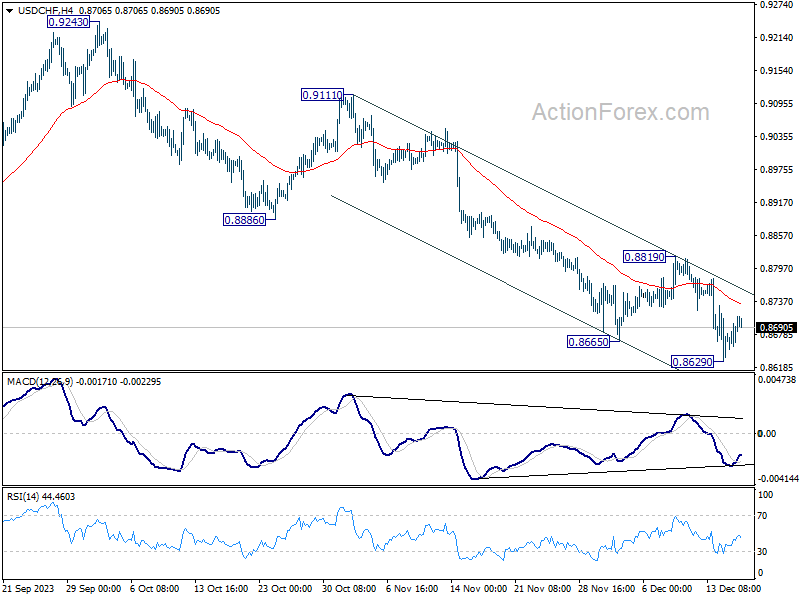
USD/CHF is extending the consolidation pattern from 0.8629 for now, and intraday bias stays neutral. Outlook remains bearish with 0.8819 resistance intact. On the downside, break of 0.8629 will resume larger fall from 0.9243 to retest 0.8551 key support next. On the upside, however, firm break of 0.8819 will turn bias back to the upside for stronger rebound.
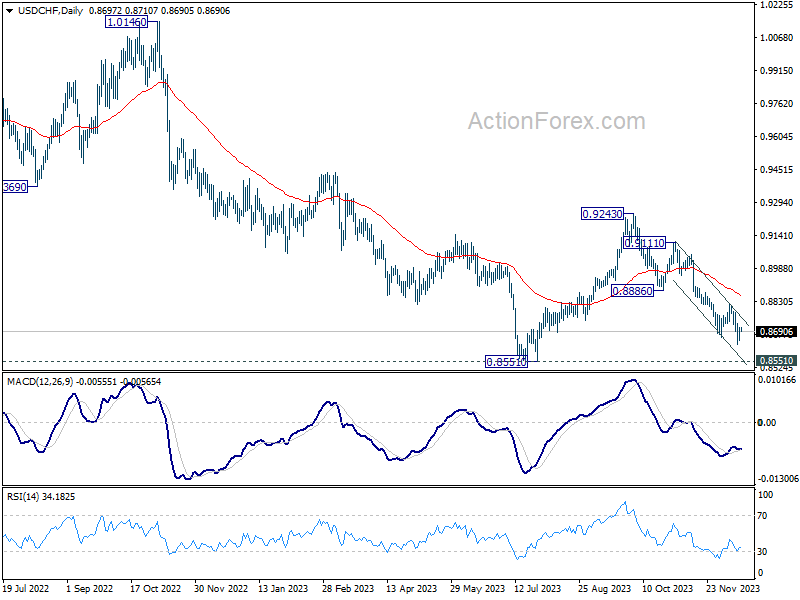
In the bigger picture, price actions from 0.8551 are currently seen as a corrective pattern to the decline from 1.0146 (2022 high). Fall from 0.9243 is seen as the second leg for now. Strong support should be seen 0.8551 to bring rebound. Meanwhile, break of 0.9111 resistance will argue that the third leg has started already, and target 0.9243.
AUD/USD Daily Report
Daily Pivots: (S1) 0.6667; (P) 0.6697; (R1) 0.6732; More...
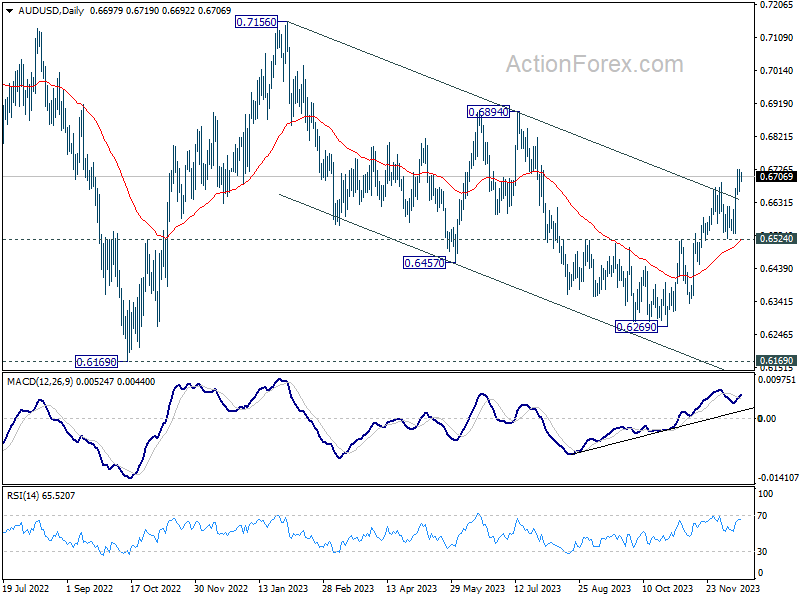
Intraday bias in AUD/USD stays on the upside first, despite some loss of momentum as seen in 4H MACD. Fall from 0.7156 could have completed with three waves down to 0.6269. Further rally should be seen to 0.6894 resistance next. Meanwhile, near term outlook will stay cautiously bullish as long as 0.6524 support holds, in case of retreat.
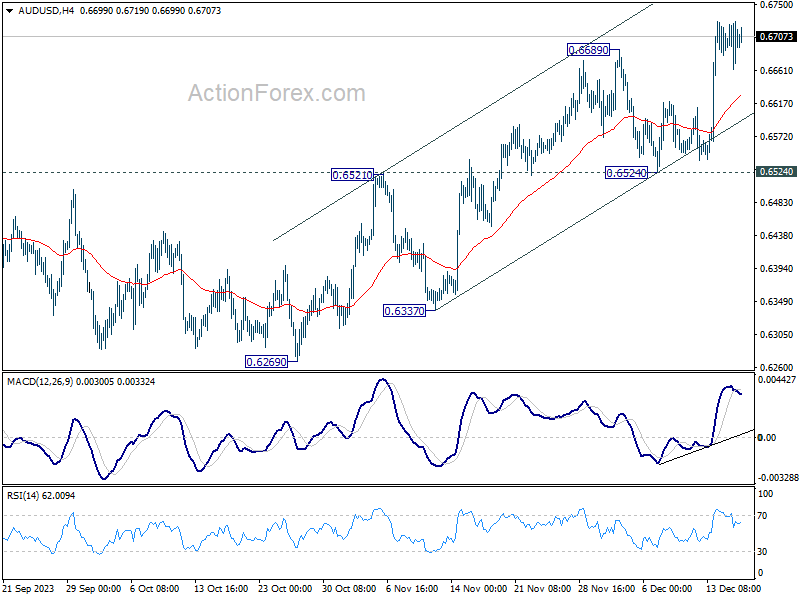
In the bigger picture, there is no confirmation that down trend from 0.8006 (2021 high) has completed. Price actions from 0.6169 (2022 low) could be just a medium term corrective pattern. Rise from 0.6269 is seen as the third leg of the pattern. For now, range trading should be seen between 0.6169 and 0.7156 (2023 high), until further developments.