Sample Category Title
CAD Might Weaken as Oil Market Plunges
Futures for Canada's main stock index rose on Monday, following positive global markets and gains in crude oil prices. First Citizens BancShares Inc's announcement of purchasing the loans and deposits of failed Silicon Valley Bank also boosted investor confidence in the global financial system. As a result, March futures on the S&P/TSX index were up 0.4% earlier, while crude oil prices gained more than 1%. We need to however evaluate the possibility of a sustained increase or a return to the bearish movement.
USDCAD
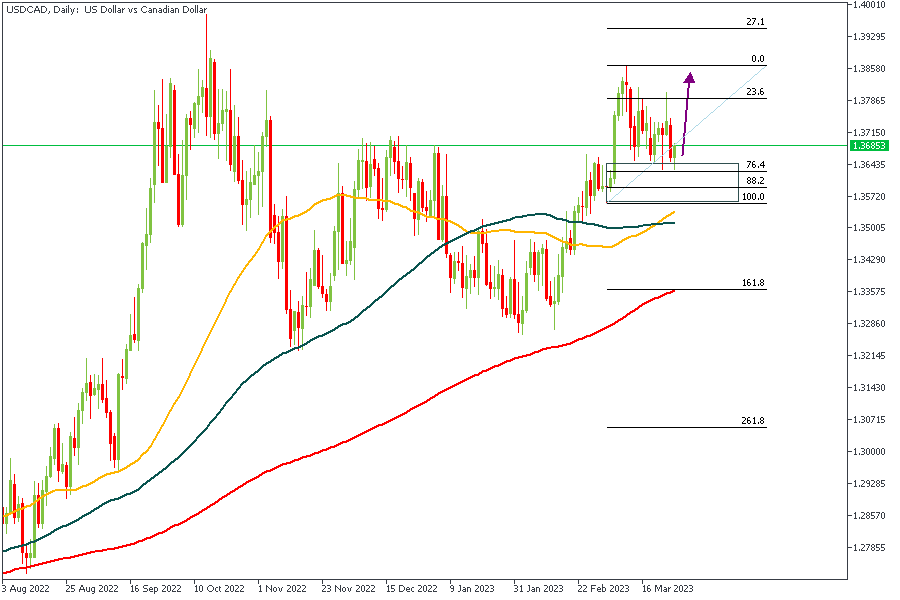
The Daily timeframe of USDCAD is currently showing signs of bullish strength. The Moving Averages are positioned in a way that indicates a bullish trend, with the 50-Day MA within reach as an area of support. To further strengthen the bullish sentiment, we also have the Fibonacci retracement levels, the drop-base-rally demand zone, and the break of the previous high at the 1.36700 area.
Analysts Expectations:
- Direction: Bullish
- Target: 1.39300
- Invalidation: 1.35600
NZDCAD
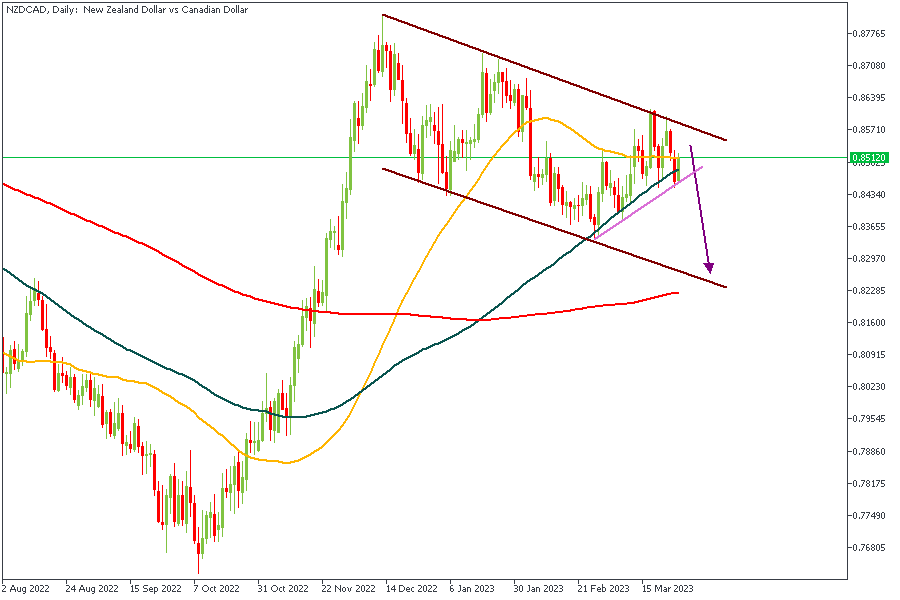
NZDCAD is currently trading inside a descending channel and has recently been rejected from the resistance trendline of the channel. The 50 and 100-day MAs are the only things that stand between where price is at the moment, and where I expect it to go in a few days. Once price breaks through the support trendline, and the 100-Day MA, it would sail very quickly toward the 200-Day MA.
Analysts Expectations:
- Direction: Bearish
- Target: 0.83000
- Invalidation: 0.85800
CADJPY
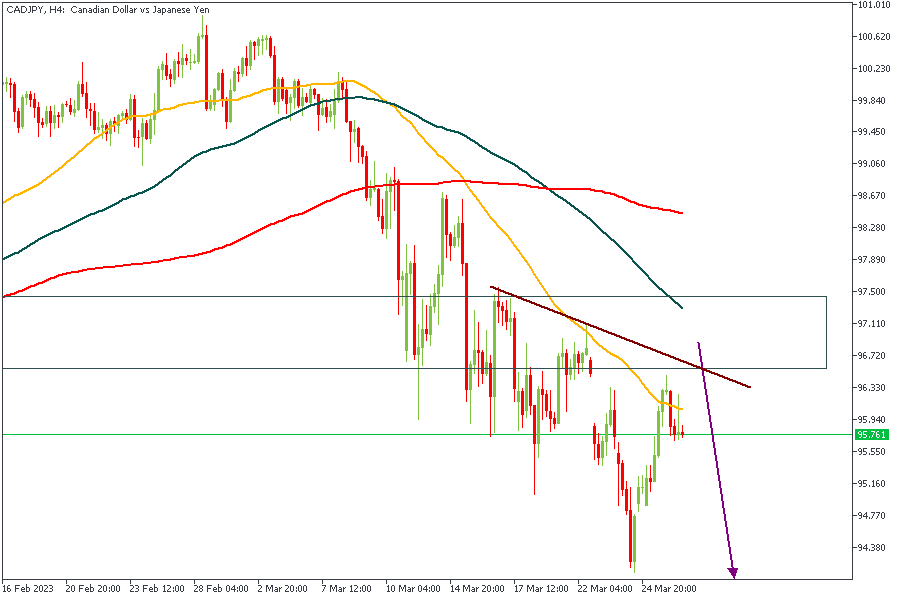
CADJPY has made an initial reaction away from the pivot zone marked by the rectangle. It also seems to have filled the volatility gap from the opening of the new week yesterday. Based on the 76% of the Fibonacci retracement, the trendline resistance, and the Moving Averages, it is safe to expect a bearish reaction from the markets.
Analysts’ Expectations:
- Direction: Bearish
- Target: 94.400
- Invalidation: 97.300
AUDCAD
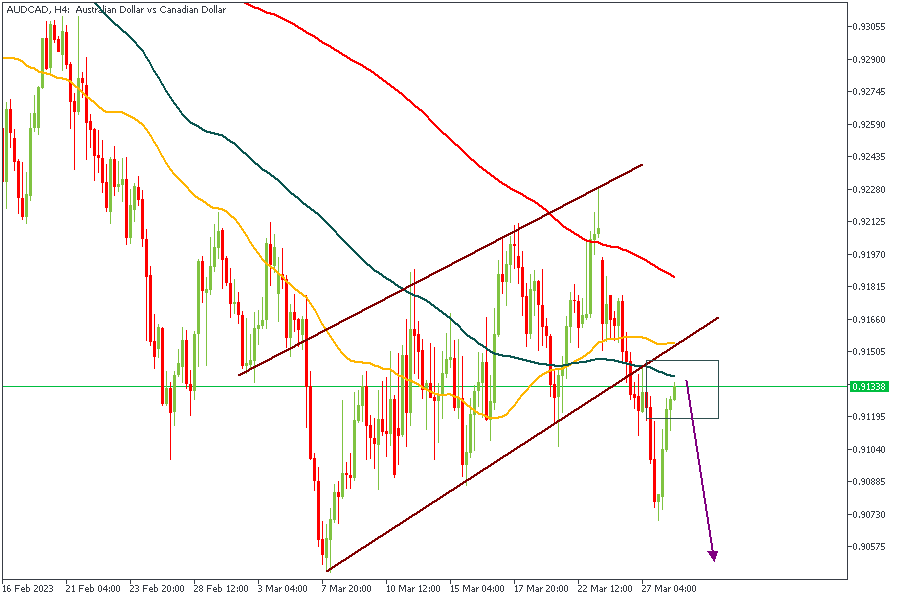
After breaking below the trendline support of the ascending channel, price can be currently considered as making a bullish retracement into the Bearish Order block (supply zone) in order to find the required liquidity and momentum to push lower.
Analysts’ Expectations:
- Direction: Bearish
- Target: 0.90600
- Invalidation: 0.91505
CONCLUSION
The trading of CFDs comes at a risk. Thus, to succeed, you have to manage risks properly. To avoid costly mistakes while you look to trade these opportunities, be sure to do your due diligence and manage your risk appropriately.
AUD/USD – Aussie Rises as Risk Appetite Improves, CPI Next
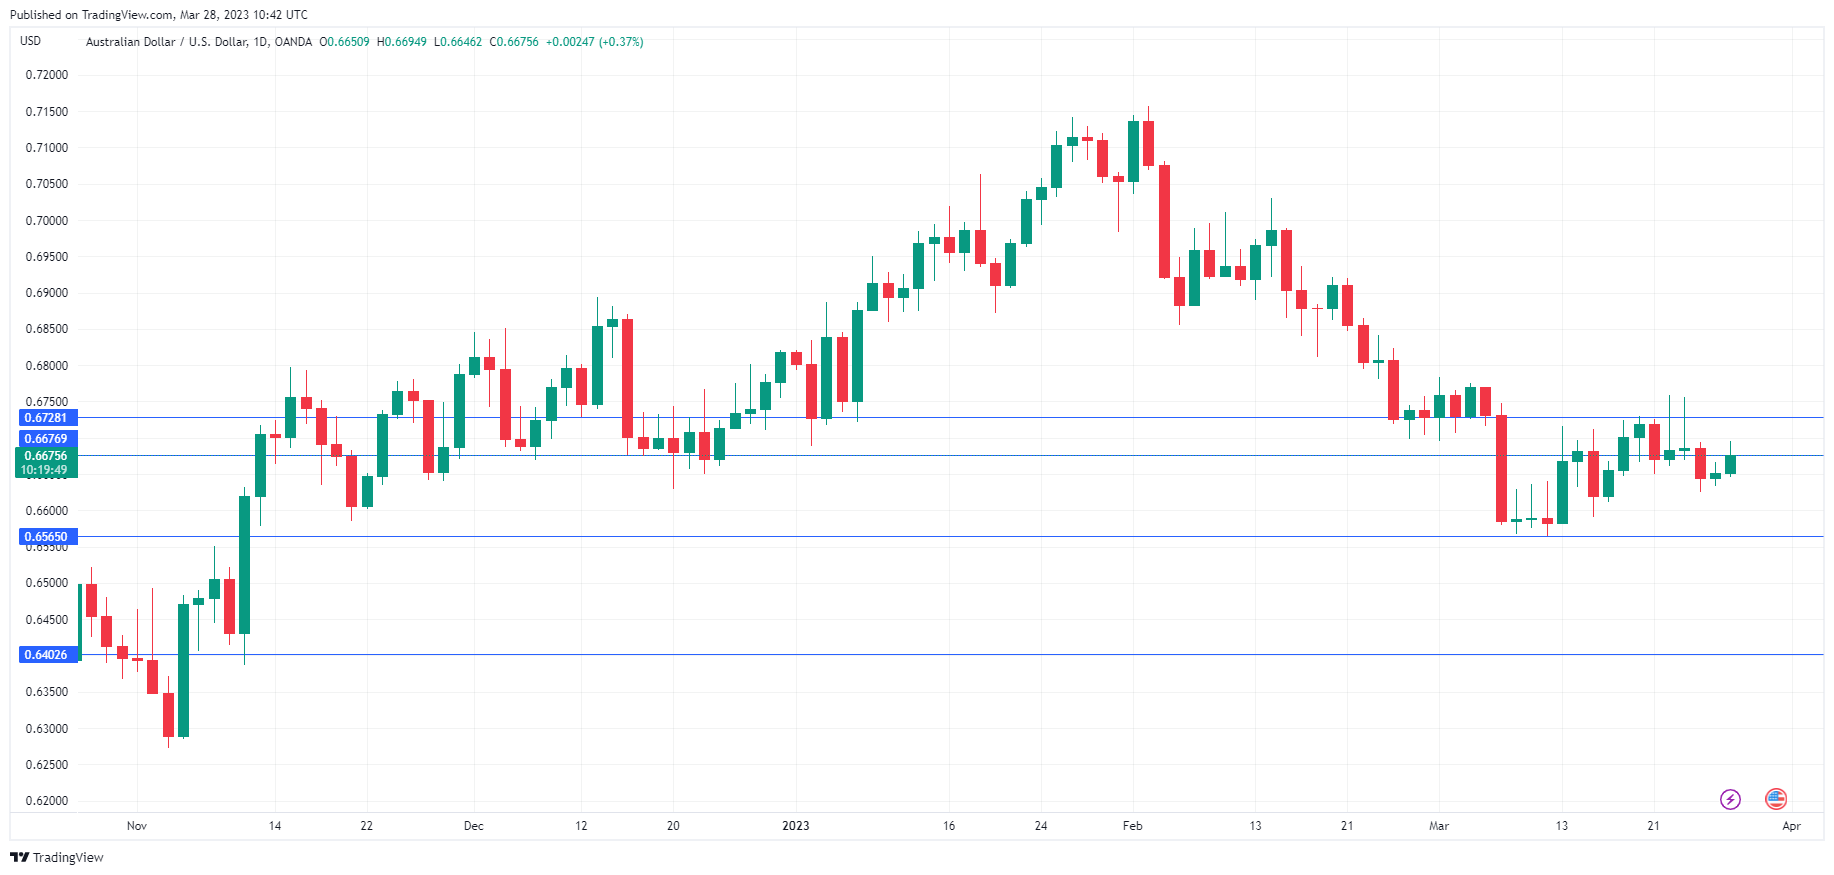
The Australian dollar is trading at 0.6672 in Europe, up 0.39%. Australian retail sales posted a weak gain of 0.2% and the quarterly CPI release is next. The banking crisis has eased a bit and risk currencies like the Aussie are in positive territory today.
RBA keeping eye on retail sales and inflation ahead of rate meeting
The markets were braced for a sharp deceleration in retail sales for February, but the meagre 0.2% gain missed the estimate of 0.4% and follows a strong gain of a revised 1.8% in January. Consumers are holding tighter to their wallets as the double whammy of rising interest rates and high inflation has dampened consumer spending.
RBA Governor Lowe said that this week’s retail sales and inflation release will be key factors in the rate decision on April 4th. The strong drop in retail sales supports the case for the Reserve Bank of Australia to take a pause. As for inflation, it is expected to drop to 7.1% in February, down from 7.4% in February. If the release is higher than the forecast, the RBA will be under pressure to raise rates at next week’s meeting. Another factor that Lowe will have to consider is the banking crisis, as central banks will need to think twice before raising rates since it puts further stress on the banking system.
The Federal Reserve announces its rate decision on Wednesday and the fact that the meeting is a live one will add to the drama. Market pricing has swung wildly, as only a few weeks ago the markets expected a 50 bp hike. Throw in a nasty bank crisis, and currently, the markets are split between a 25 bp increase and a pause. In December, the Fed’s Summary of Economic Projections (SEP) which includes forecasts for interest rates and inflation. There has been a lot of market turbulence since then, and any revisions in the SEP could affect the movement of the US dollar.
AUD/USD Technical
- AUD/USD is testing resistance at 0.6676. Above, there is resistance at 0.6728.
- There is support at 0.6565 and 0.6402
Market Mood Improves As Banking Fears Ease
European markets flashed green on Tuesday along with Asian equities as fears over a looming banking crisis eased.
A deal backed by U.S regulators for First Citizens Bank to purchase failed Silicon Valley Bank (SVB) has boosted global sentiment and cooled jitters over the banking sector. The renewed appetite for risk is likely to stimulate demand for global equities at the expense of safe haven assets. However, some caution still lingers from the recent market chaos and this could encourage investors to think twice before jumping on the risk train. U.S futures are pointing to a mixed open as market players await the Senate hearings on Silicon Valley Bank. Looking at commodities, gold struggled to nurse wounds from Monday’s selloff as easing bank fears dulled its allure.
This week, financial markets will focus on key inflation figures from across the globe, speeches by Fed officials, and the U.S Senate hearings on Silicon Valley Bank. Although some normality seems to be returning to markets, this could easily be disrupted by negative news or data that rekindle concerns not only over the banking sector but also inflation.
More Pain Ahead For USD?
The past few weeks have not been kind to the dollar.
It has weakened against most G10 currencies since the start of March thanks to growing expectations around the Federal Reserve slowing and eventually halting rate hikes in the face of the banking turmoil. Although fears of a full-blown crisis have cooled, markets still expect the Fed to cut its benchmark rates by 50 basis points by September.
These expectations could be intensified by the upcoming hearings on Silicon Valley Bank’s collapse and U.S inflation data on Friday. If the mid-week hearings before the House and Senate reveal fresh information on the chaos witnessed in the U.S banking sector, this could rekindle contagion fears, ultimately hitting the dollar as rate cut expectations mount. Regarding the inflation data, the Core PCE Deflator for February is expected to show inflation rising 4.7%, which would match January’s annual figure. Ultimately, a report that meets or prints below forecasts could fuel speculation around the Fed’s next move being a rate cut. Although the path of least resistance for the dollar is starting to point south, hawkish commentary from Fed officials could limit downside losses.
Currency spotlight: EURUSD
It could be a wild week for the EURUSD due to high-risk events and key inflation data.
The currency pair has kicked off the week on a positive note, pushing higher thanks to a weaker dollar. Given how the looming US Senate hearings and speeches from Fed officials mid-week will influence the dollar, this could translate to more volatility in EURUSD. Things could really spice up on Friday due to inflation data from the eurozone and the United States. Headline eurozone inflation is expected to fall sharply in March to 7.1% from 8.5% seen in the previous month. But the ECB is more focused on the core readings, so if these decline, this may weaken the euro as investors ponder whether the ECB may pause rate hikes down the road.
Looking at the technical picture, the EURUSD has the potential to push higher towards 1.09 if a solid daily close above the 1.08 level is achieved. Should bulls run out of steam, prices may slip back towards 1.0750 and 1.0710, respectively.
Commodity spotlight – Gold
Investor appetite for gold has been dampened by a combination of technical and fundamental forces.
After kissing the psychological $2000 level three times last week, bears have exploited this stubborn resistance to attack, with easing banking fears further dulling the metal’s safe haven allure. While prices could trade lower in the shorter term to medium term, the longer term still remains in favour of bulls due to expectations around the Fed cutting interest rates in September.
Looking at the technical picture, gold seems to be experiencing a pullback after failing to conquer the $2000 level. This could see the precious metal dip once again towards $1955 and $1935 before the bulls re-enter the scene. If prices break below $1925, gold is likely to test $1900.
BoE officials address credit conditions and interest rates amid market turmoil
BoE Governor Andrew Bailey acknowledged the existence of "some evidence of some tightening credit conditions" during today's parliamentary hearing, addressing concerns surrounding the current financial market turmoil. Despite the tightening, Bailey remains optimistic, stating that "we do not see a critical development in that respect."
The Governor emphasized that the BoE always considers credit conditions when setting monetary policy and expressed confidence in the bank's ability to assess the impact of raising interest rates on the position of the banks themselves.
Deputy Governor Dave Ramsden shared similar sentiments, acknowledging the importance of vigilance regarding the risks higher interest rates might pose to other parts of the economy. He added that the current environment is "volatile and challenging," highlighting the need for careful monitoring and assessment by central bank officials to ensure financial stability and well-informed policy decisions.
HG_F: Copper Futures – Reaction Higher from Equal Legs Area
Hello Traders, in this article we will analyze how we were able to forecast here at Elliott Wave Forecast the reaction higher in HG_F (Copper Futures). Firstly, copper was trading within a cycle from 01.18.2023 in a pullback phase. Secondly, we had in place the first leg of the cycle including the connector in place. This allows us to be able to project the equal legs area of the market. Within these areas buyers and sellers agree to a reaction of minimum 3 waves. Using our system we are able to enter trades with a defined entry, risk and take profit strategy.
Our members know how to utilize it in their favor.
Having said that let’s go and have a look on how we saw HG_F during 03.14.2023 4 hour update presented to members showing the area:
HG_F 4 hour update 03.14.2023
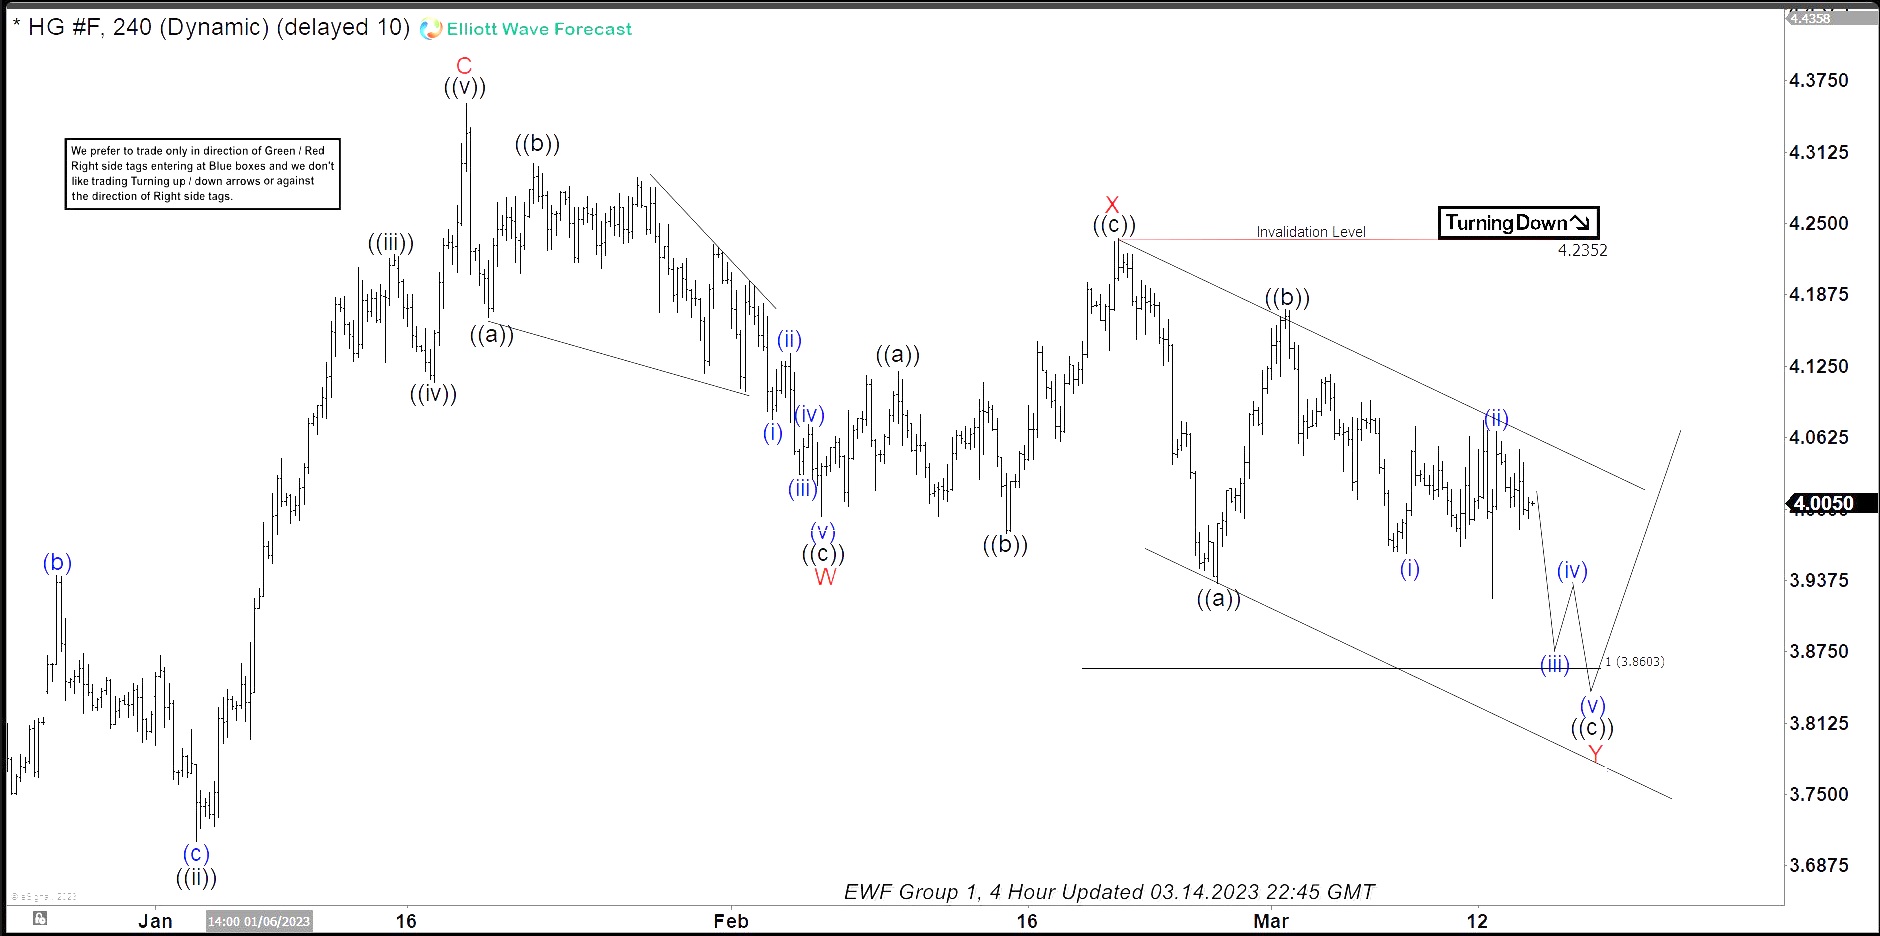
As we can see we were already within the Y leg lower towards equal legs area of 3.8603 – 3.6283. Specifically it was trading lower within wave (ii) of ((c)) of Y. From there our members knew the area in which they can enter the market if they were looking for a buy entry.
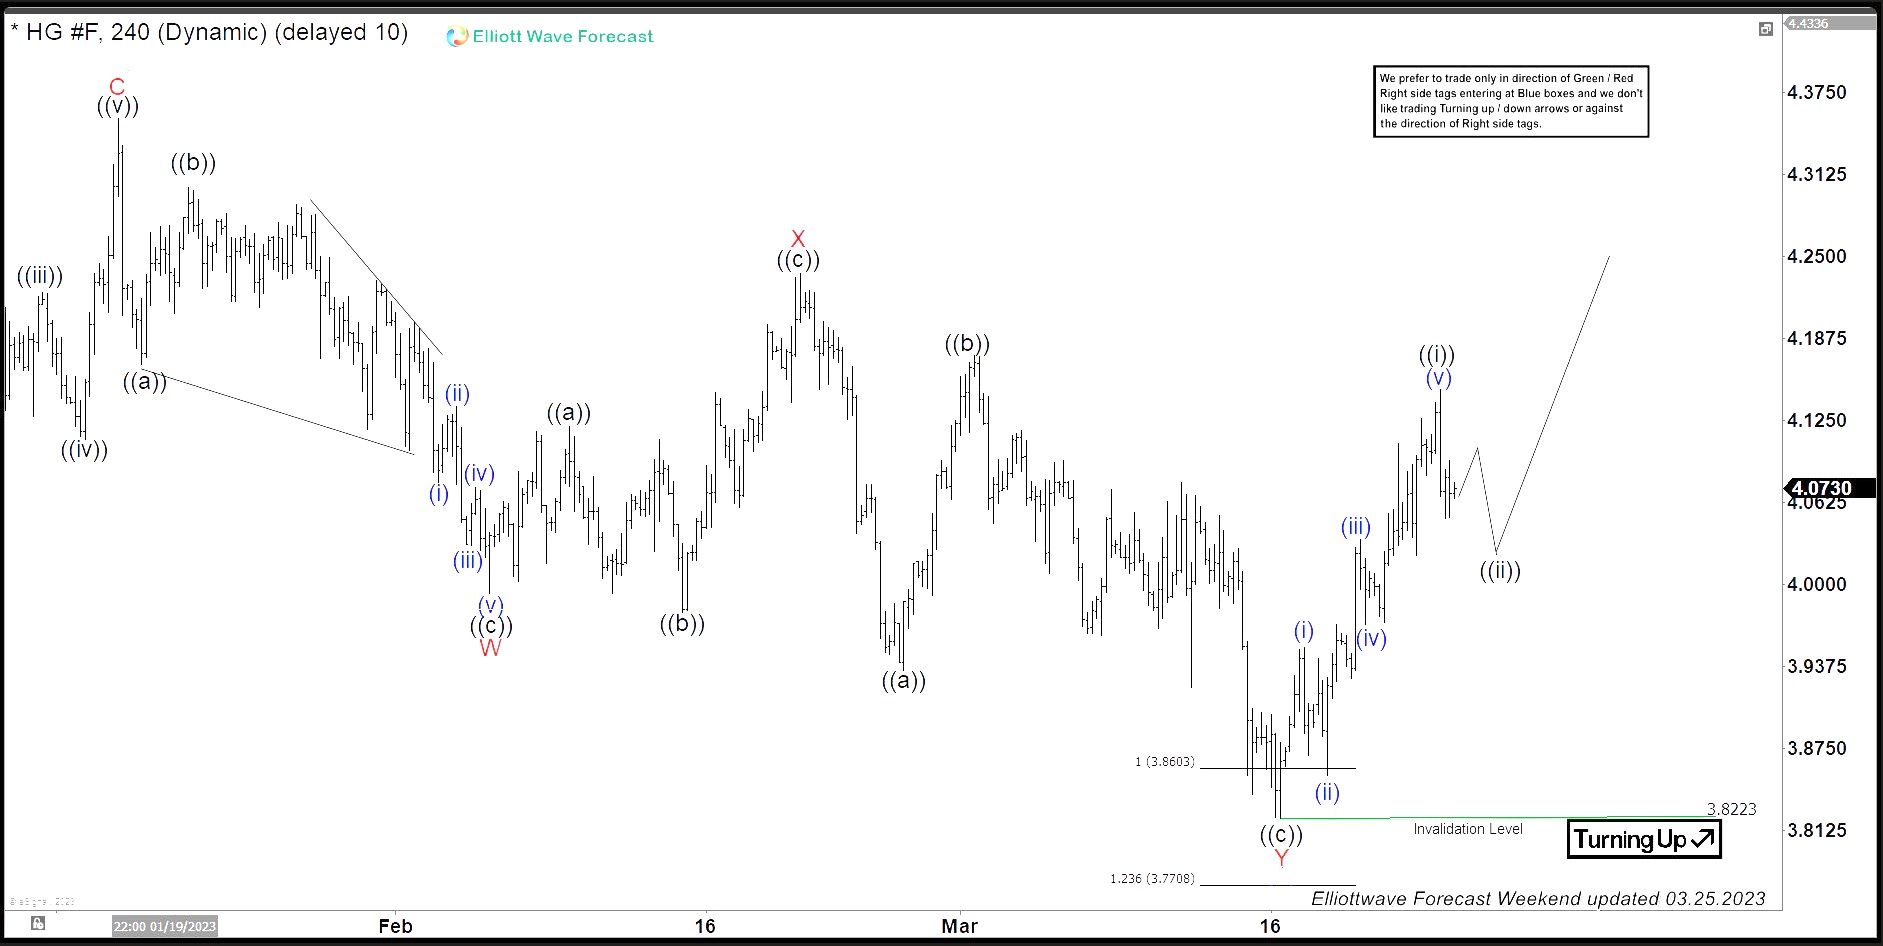
Now let’s fast forwards the time and see the latest 4 hour weekend update from 03.25.2023 which shows where we are:
HG_F 4 Hour weekend update 03.25.2023
As we can see Copper reacted higher from 3.8223 allowing us to create a risk free position already. Moreover, expecting next to pullback in wave ((ii)) before it can resume the rally higher in wave ((iii)). In conclusion, we are expecting Copper to continue to trade higher in the short term cycle.
USDJPY Reacting Lower From The Equal Legs Area
In this technical blog, we will look at the past performance of the 1-hour Elliott Wave Charts of USDJPY. In which, the decline from 16 March 2023 high ended 5 waves in an impulse sequence and showed a lower low sequence in a higher time frame charts. Therefore, we knew that the structure in USDJPY is incomplete to the downside & should see more weakness. So, we advised members to sell the bounces in 3, 7, or 11 swings at the extreme areas. We will explain the structure & forecast below:
USDJPY 1 Hour Elliott Wave Chart From 3.27.2023
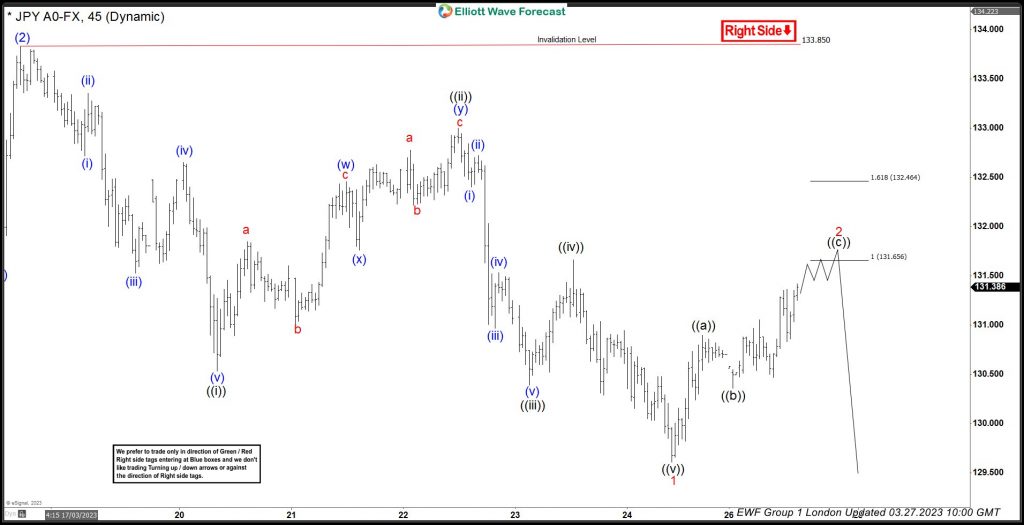
Above is the 1hr Elliott wave Chart from the 03/27/2023 London update. In which, the decline from 16 March unfolded in an impulse sequence & showed a lower sequence where the pair made a short-term bounce in wave 2. The internals of that bounce unfolded as an Elliott wave zigzag correction where wave ((a)) ended at $130.89 high. Then a decline to $130.35 low ended wave ((b)) pullback and started the ((c)) leg higher towards $131.65- $1132.46 equal legs area from where sellers were expected to appear looking for more downside or for a 3 wave reaction lower at least.
USDJPY Latest 1-Hour Elliott Wave Chart From 3.28.2023
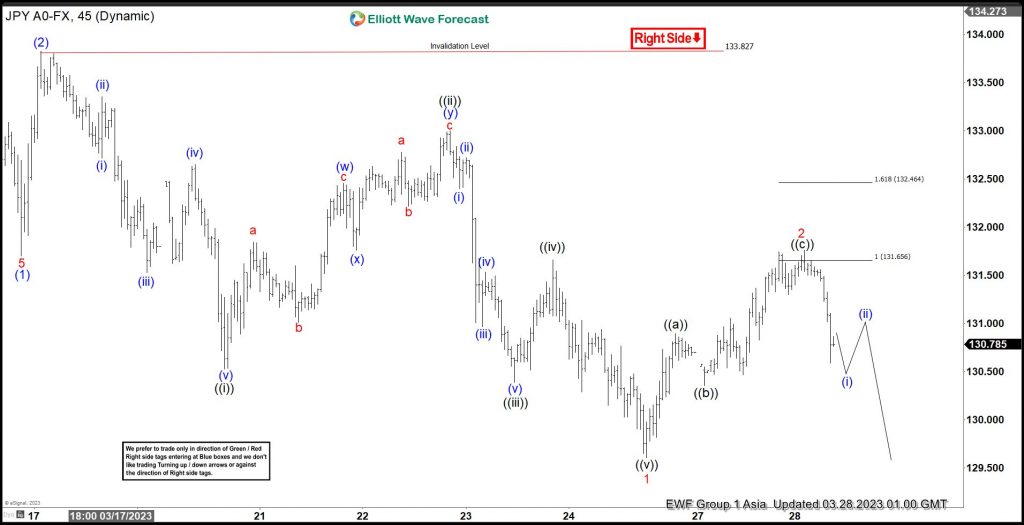
This is the Latest 1hr view from the 03/28/2023 Asia update. In which the pair is showing a reaction lower taking place from the equal legs area allowing shorts to get into a risk-free position shortly after taking the position. However, a break below $129.61 low is still needed to confirm the next extension lower & avoid a double correction higher.
GBP/USD: High Inflation and Growing Expectations for Further Rate Hikes Keep Pound Supported
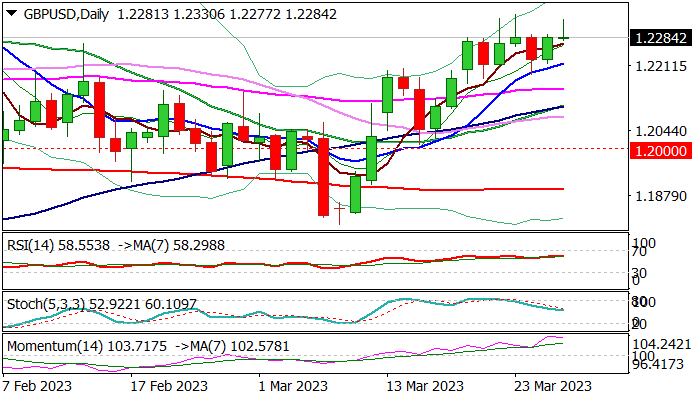
Cable edged lower in European trading on Tuesday, after attempts at pivotal barrier at 1.2343 (Mar 23 high) stalled just under the target but keeps overall firm bullish stance.
The latest inflation data and comments from BOE Governor Bailey fuel expectations for further rate hikes, which underpins the pound.
Governor Bailey highlighted that fighting inflation remains the key job for BOE policymakers and recent rising worries about the health of global banking system should not obstruct their primary task.
The latest data showed that soaring food prices pushed inflation in British shops to the highest in nearly two decades, with comments Britain’s Retail Consortium that shop price inflation has yet to peak, adding to growing expectations that the BOE would for for the twelfth consecutive rate hike in May.
This creates positive environment for pound, which is already in near-term uptrend, as bulls challenge 1.2343 pivot, the last obstacle on the way towards key barrier at 1.2447 (peaks of Dec 2022/Jan 2023) which also mark the ceiling of larger range.
Bullish daily studies offer additional support, with potential deeper dips expected to stay above solid support at 1.2185 (daily Tenkan-sen) to keep bulls intact.
Res: 1.2330; 1.2343; 1.2402; 1.2446.
Sup: 1.2270; 1.2217; 1.2185; 1.2154.
USD/JPY – Japanese Yen Tests 131, BOJ Core CPI Eases
The Japanese yen is in positive territory and broke below the 131 line in the Asian session. USD/JPY is trading at 131.17, in Europe, down 0.30% on the day.
BoJ inflation indicator eases
BoJ Core CPI, the preferred inflation gauge of the central bank, dropped to 2.7% in February, down from 3.1% in January and below the estimate of 3.5%. The decline in core inflation wasn’t all that surprising, as last week’s National Core CPI also fell sharply, due to government subsidies for utility bills which took effect in February. The yen’s response has thus been muted to the inflation release.
The Bank of Japan has been very reluctant to tighten policy, and the only moves we’ve seen over the past few months have related to yield curve control, in order to prop up the yen. The BoJ has insisted that high inflation is transient and will fall to 2% later this year as the effect of high commodity prices eases. The Bank has said it would consider tightening if wages move higher, as this would be a sign that inflation is sustainable.
Stay tuned as employees won substantial wage hikes at annual labour talks earlier this month. If wage growth does translate into higher inflation, the BoJ will be under pressure to tighten policy, but the new BoJ Governor, Kazuo Ueda, has not given any indications that he plans to exit accommodative policy anytime soon. BoJ Governor Kuroda spoke earlier today, with a “business as usual” message. Kuroda said that the sustainable infation target had not been met and it was too early to discuss an exit from the Bank’s loose monetary policy.
The Federal Reserve announces its rate decision on Wednesday, and after a roller-coaster ride for market pricing, it’s currently close to a 50/50 toss-up. Will the Fed hike by 25 basis points or will it take a pause for the first time in the current rate-tightening cycle? The Fed was expected to raise rates by 25 bp, but the banking crisis, which has shaken up the financial markets, is a compelling reason for the Fed to stay on the sidelines and let the markets catch their breath.
USD/JPY Technical
- There is resistance at 130.60 and 131.57
- 129.30 and 127.05 are providing support
JP225 Index Upward Move Appears to Have Run its Course
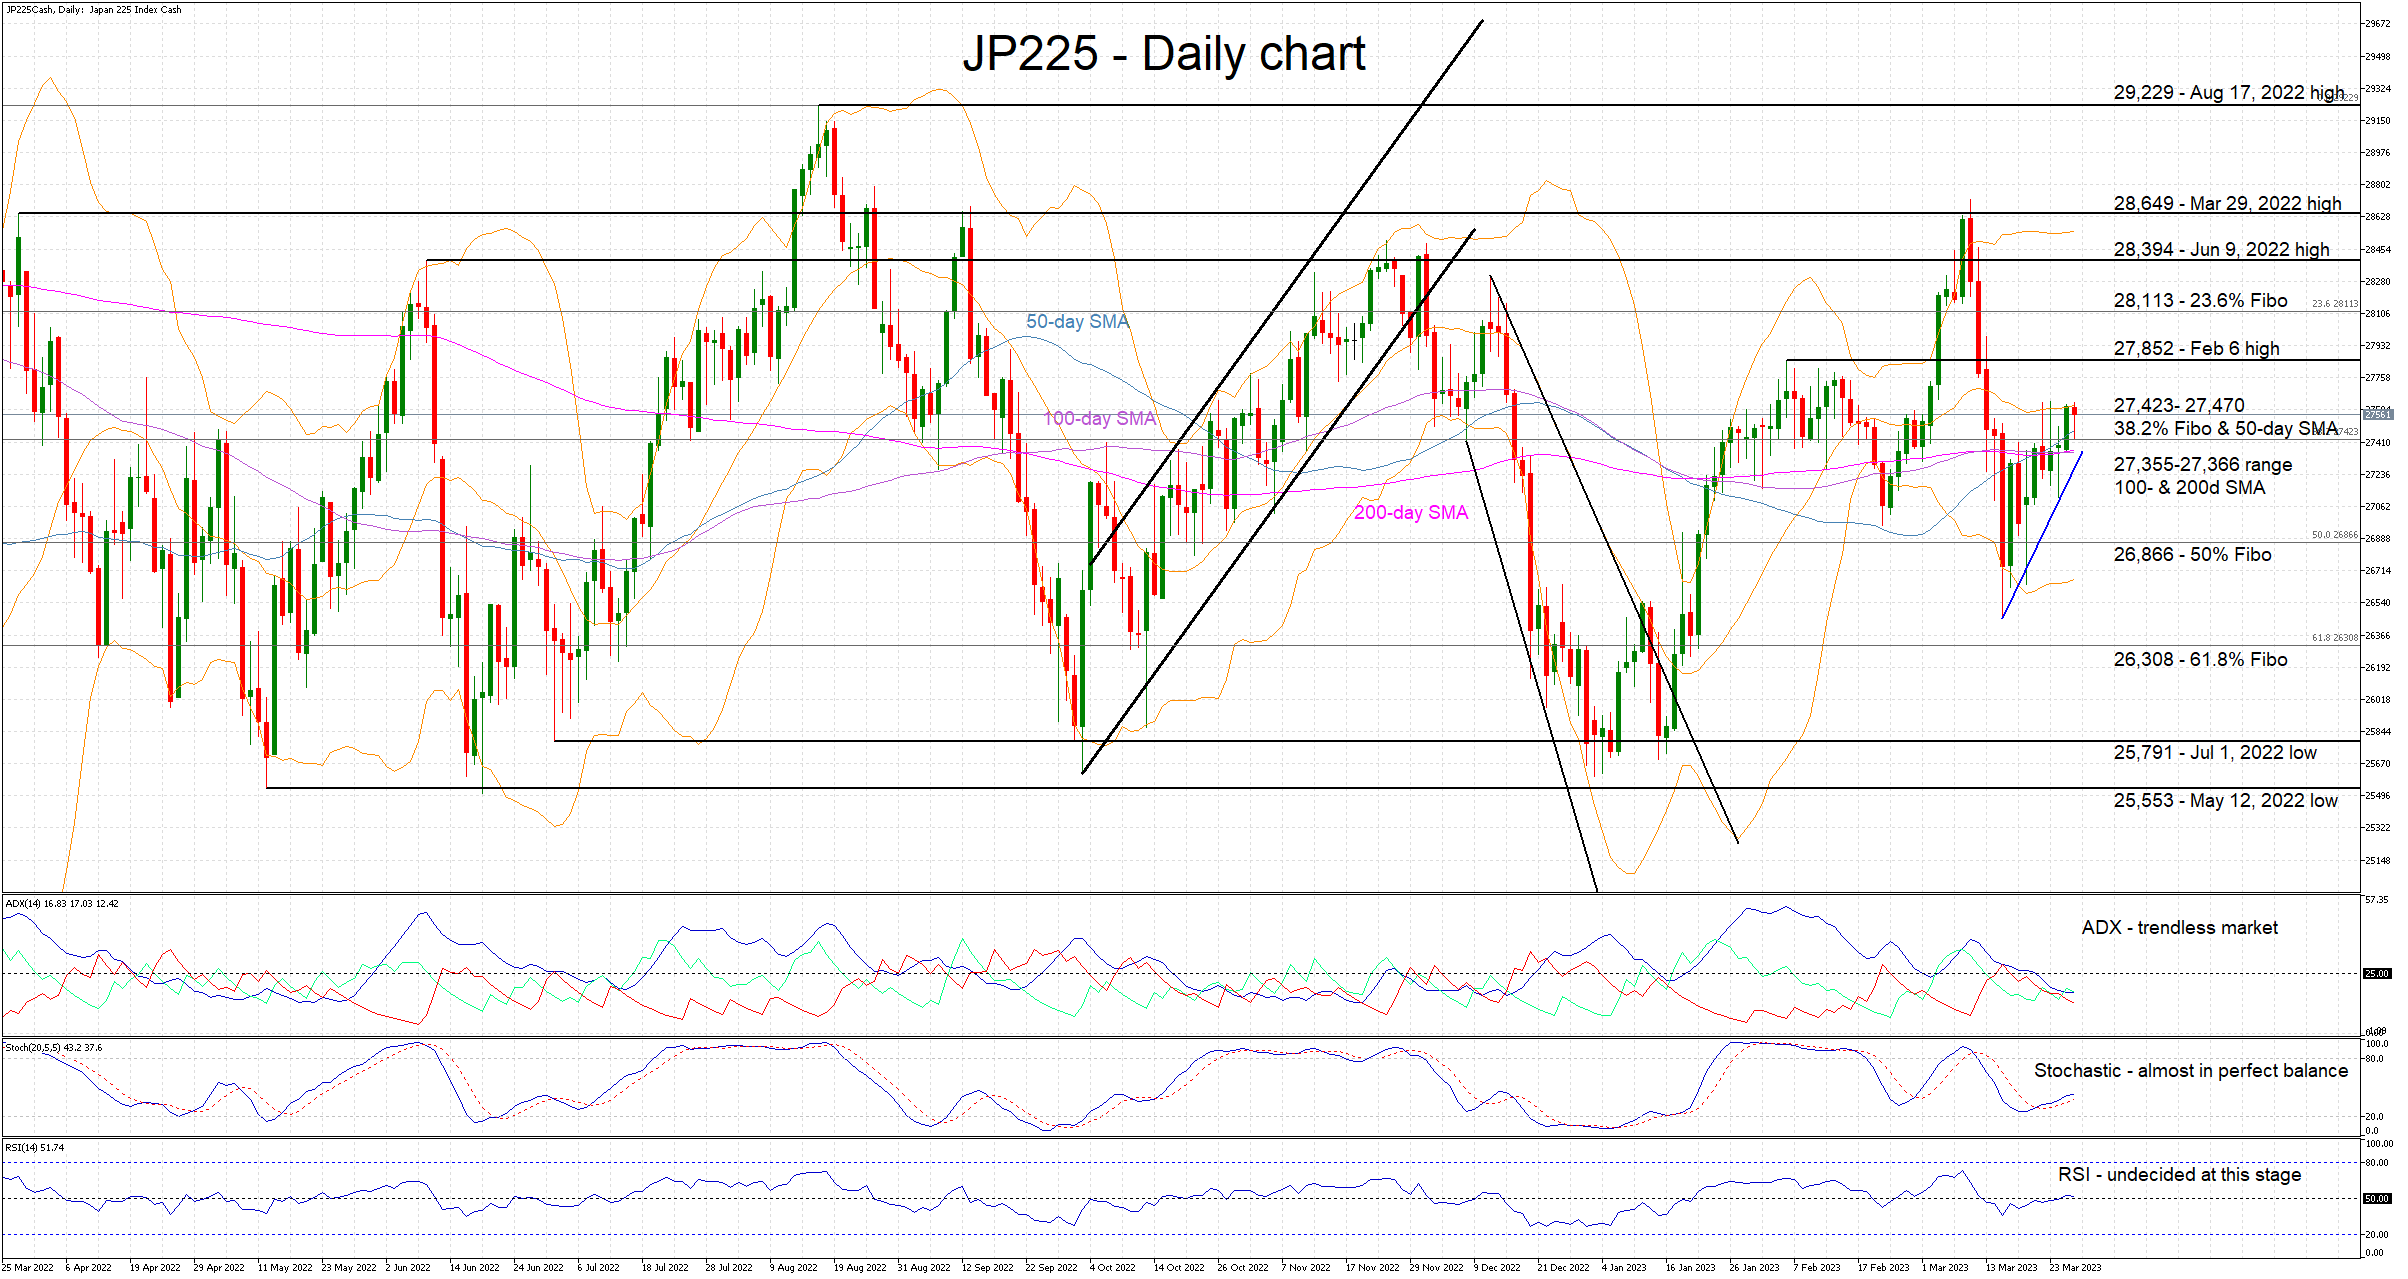
The JP225 cash index has been on a decent upward move since the March 15 low of 26,457. This short-term rally appears to have halted just above the 27,423- 27,470 range set by the 38.2% Fibonacci retracement level of the March 8, 2022 – August 17, 2022 uptrend and the 50-day simple moving average (SMA). This move appears to have been the least-resistance path for the index, correcting half of the acute downward move recorded in early March.
At this juncture the momentum indicators are revealing a precarious balance. The RSI is just on the 50-threshold and the stochastic oscillator appears to be moving horizontally, which is atypical for this indicator. In the meantime, the Average Directional Movement Index (ADX) is clearly pointing to a trendless market. It is actually stuck at the lowest level since December 15, 2022, the start of the 10% correction that pushed the JP225 index to the 25,603 low.
If the bulls maintain the market reins, their first target would be at the February 6 high of 27,852. Even higher, the 23.6% Fibonacci retracement at 28,113 could prove tougher to clear, just below the June 9, 2022 high of 28,394.
Should the bears regain market control, they would face the 38.2% Fibonacci retracement level and the 50-day SMA at the 27,423- 27,470 range. Then, the twin 100- and 200-day SMAs at the 27,355-27,366 area could put up a stronger fight. If this range is broken, the path would be clear until at the 50% Fibonacci retracement level of 26,866.
To conclude, the JP225 bulls have been enjoying a nice upleg, but the technical picture appears to be balanced now.
GBPUSD Aims for a Bullish Breakout
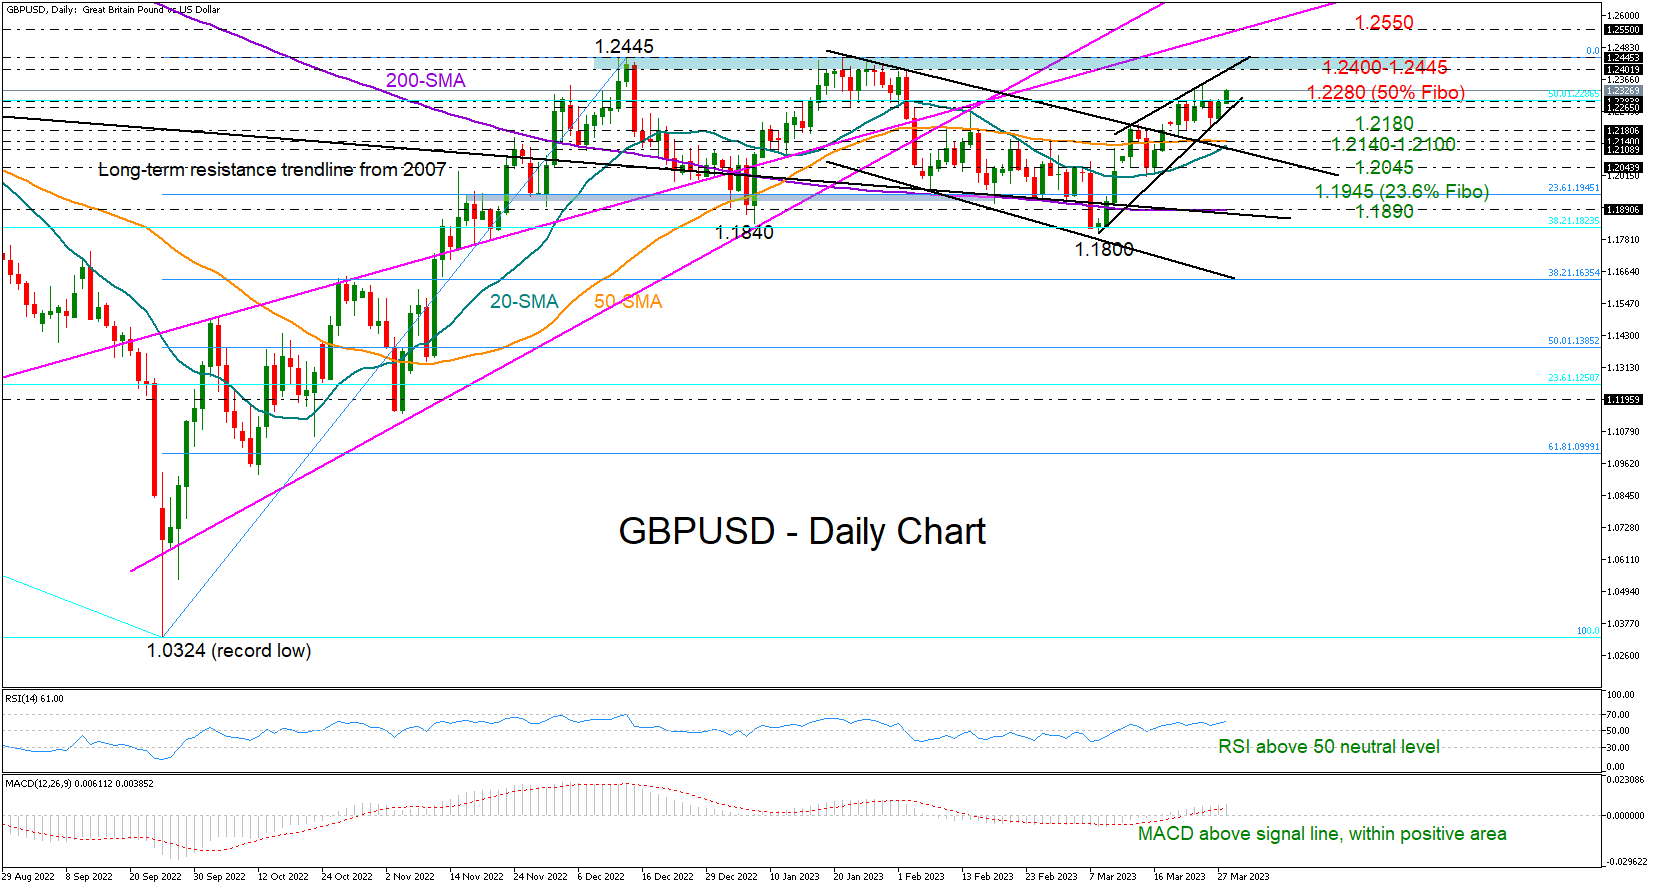
GBPUSD was stubbornly pushing for a close above the 1.2280 bar during Tuesday’s early European trading hours despite six consecutive failed attempts.
From a technical perspective, the short-term bias remains skewed to the upside as the RSI and the MACD are clearly fluctuating within the bullish area. Yet, the former is maintaining a sideways trajectory, suggesting that some caution is warranted.
If the bulls successfully climb above the 1.2280 wall, which coincides with the 50% Fibonacci retracement of the 2021-2022 downtrend, the next barrier might occur within the 1.2400-1.2445 zone. Another step higher could face some congestion around 1.2550 before speeding up to 1.2665-1.2700. The 1.2800 area could be the next destination.
Alternatively, a flip below the short-term support trendline at 1.2260 may cause a quick decline to 1.2180. Even lower, the 20- and 50-day simple moving averages (SMAs) and the upper boundary of the broken channel could provide a footing to keep the price within the 1.2100 territory. If they fail, the sell-off could intensify towards 1.2040.
In brief, GBPUSD is aiming for a bullish continuation, though only a sustainable move above 1.2280 would boost buying appetite.