Sample Category Title
Technical Outlook and Review
DXY:
Looking at the DXY chart, we can see that there is a strong bearish momentum. There is potential for a continuation towards the first support level at 101.93, which is a swing low support level and coincides with a 78.60% Fibonacci retracement. If prices were to drop further, they could reach the second support level at 100.82, which is also a swing low support level.
On the other hand, the first resistance level is at 103.48, which is an overlap resistance level and coincides with a 38.20% Fibonacci retracement. Breaking through this resistance could lead to a rise towards the second resistance level at 104.60, which is also an overlap resistance level.
It’s worth noting that there is an intermediate support level at 102.62, which is an overlap support level. Traders should keep an eye on this level as a break of this intermediate support could trigger a strong bearish acceleration towards the first support level.
EUR/USD:
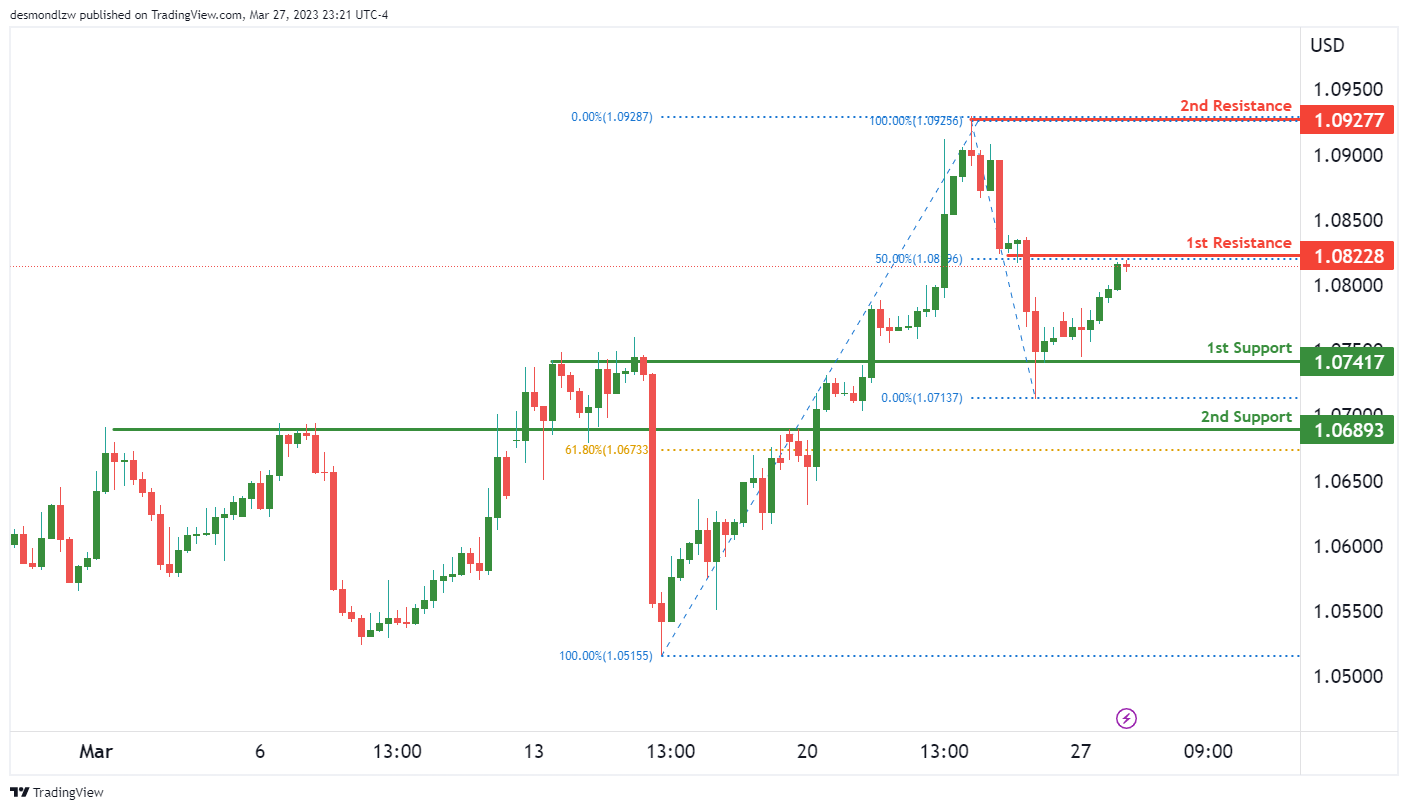
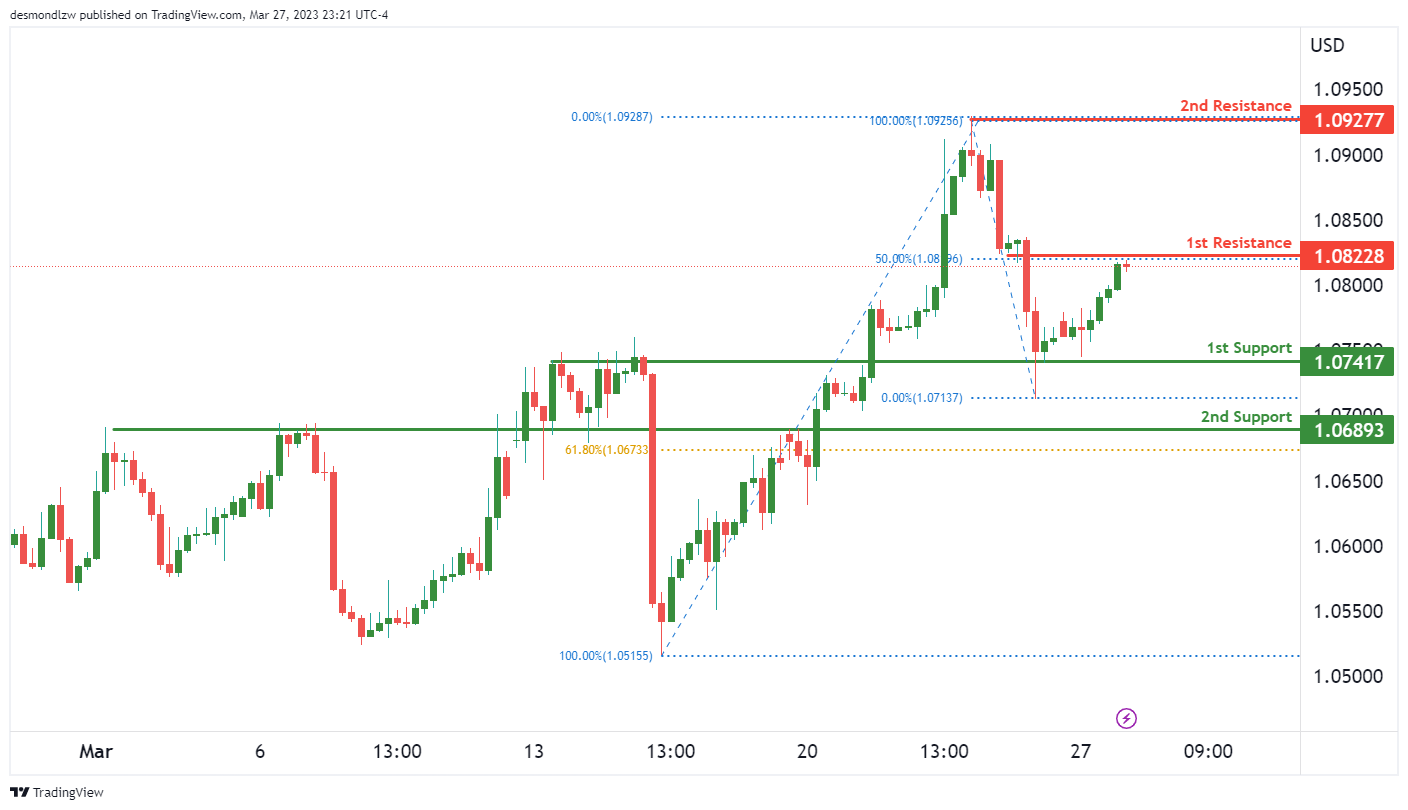
The EUR/USD chart is currently showing bearish momentum, with potential for a bearish reaction off the first resistance level at 1.0822 and a subsequent drop to the first support level at 1.0741. The first support level is an overlap support level, while the second support level at 1.0689 is also an overlap support level and coincides with the 61.80% Fibonacci retracement level.
On the other hand, the first resistance level is a swing high resistance at 1.0822, which also coincides with the 50% Fibonacci retracement level. Breaking through this resistance could lead to a rise towards the second resistance level at 1.0927, which is another swing high resistance level.
GBP/USD:
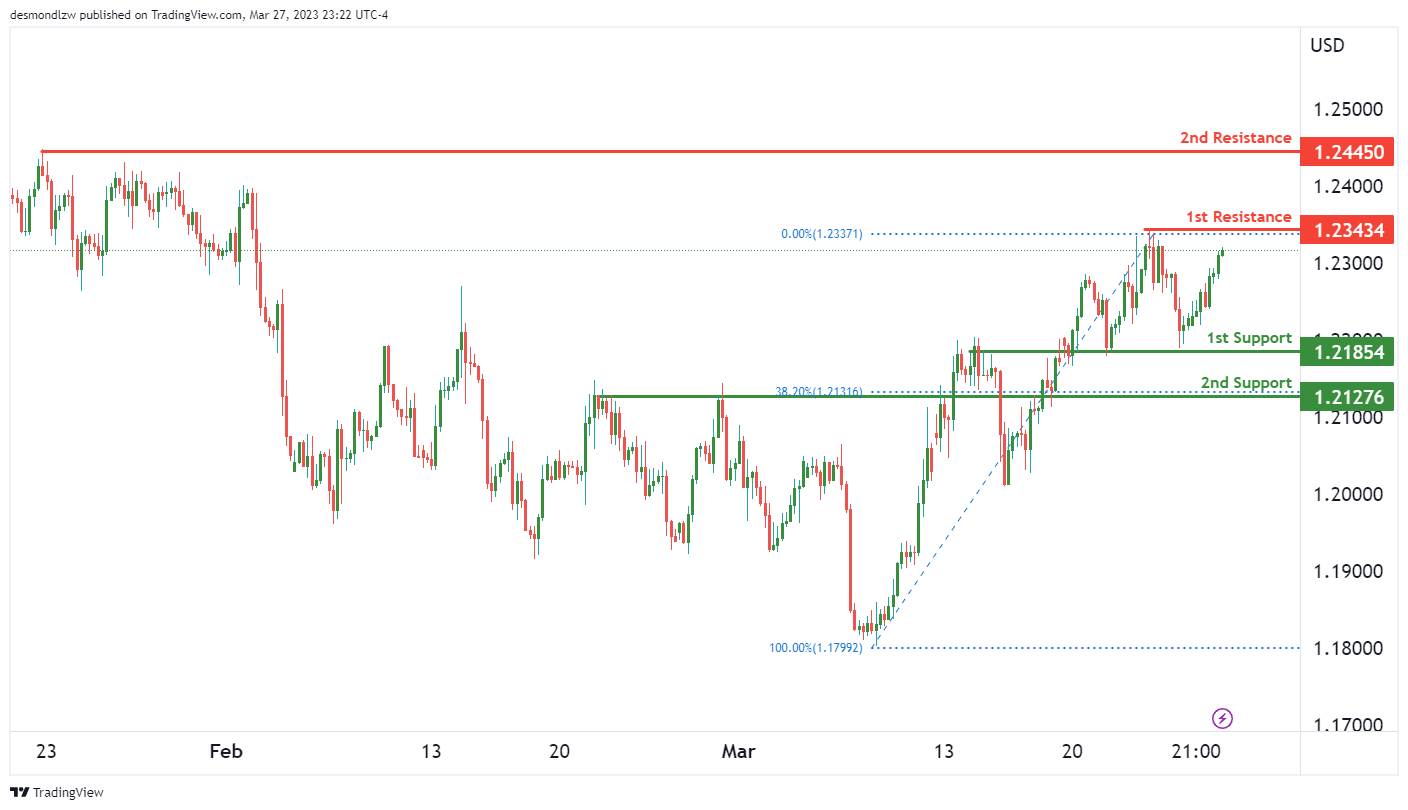
The GBP/USD chart is currently showing a bearish momentum with the potential for a continuation towards the first support level at 1.2185, which is an overlap support level. If the price were to drop further, it could reach the second support level at 1.2127, which is also an overlap support level and coincides with the 38.20% Fibonacci retracement level.
On the other hand, the first resistance level is at 1.2343, which is a multi-swing high resistance level. If the price were to bounce from this level, it could potentially drop towards the first support level. However, if the price were to break through the first resistance level, it could rise towards the second resistance level at 1.2445, which is a swing high resistance level.
USD/CHF:
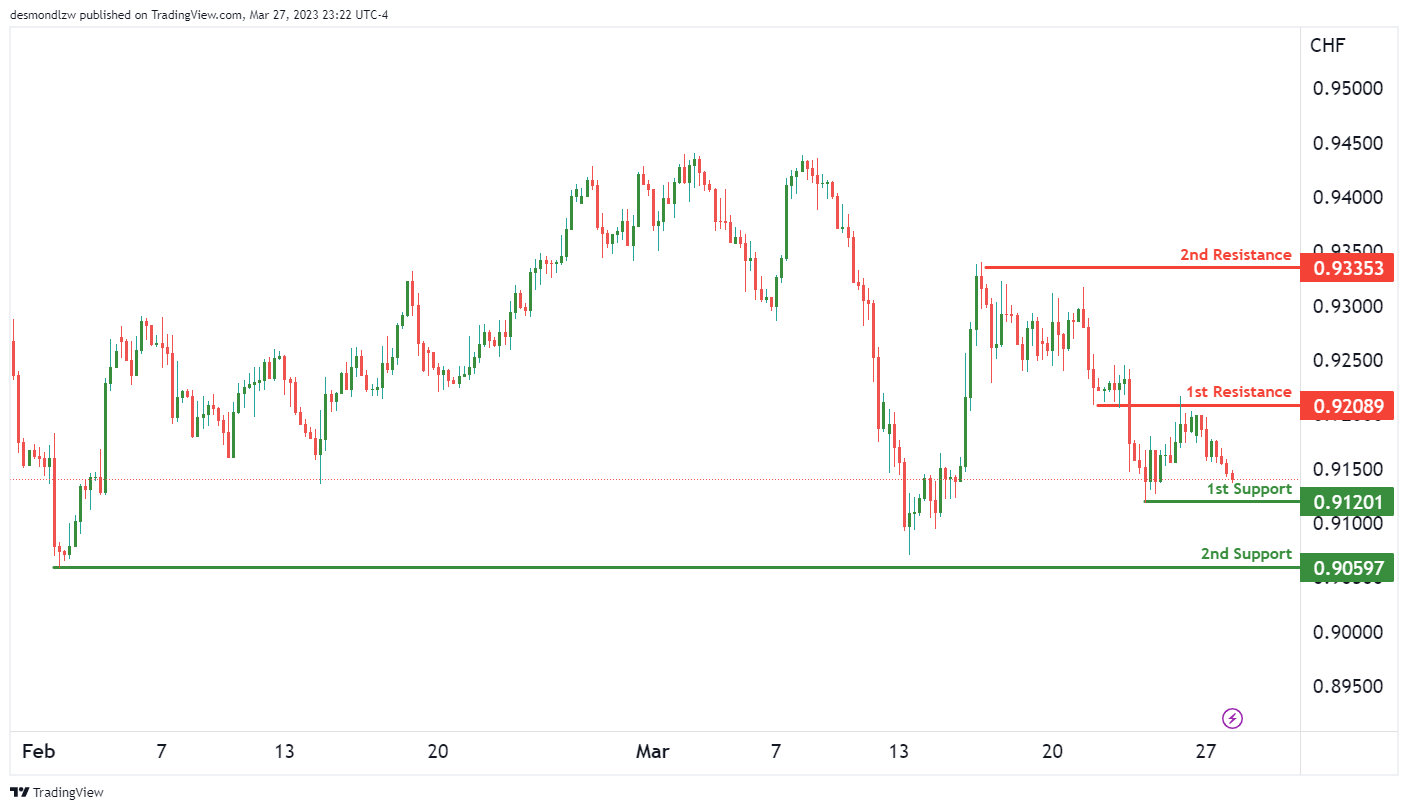
The USD/CHF chart is currently showing bearish momentum, indicating a potential for a continuation towards the first support level at 0.9120. This level is a swing low support, which makes it a strong candidate for a potential bounce. In addition, there is a second support level at 0.9059, which is also a swing low support and could provide further support if prices were to drop further.
On the other hand, the first resistance level is at 0.9208, which is an overlap resistance level that coincides with a potential retracement level. If prices were to rise, they could potentially reach the second resistance level at 0.9335, which is a multi-swing high resistance level.
Overall, the momentum of the chart is bearish, indicating that prices could continue to drop towards the first support level. However, traders should keep an eye on the chart for any potential breakouts or market movements that could cause prices to rise towards the resistance levels.
USD/JPY:
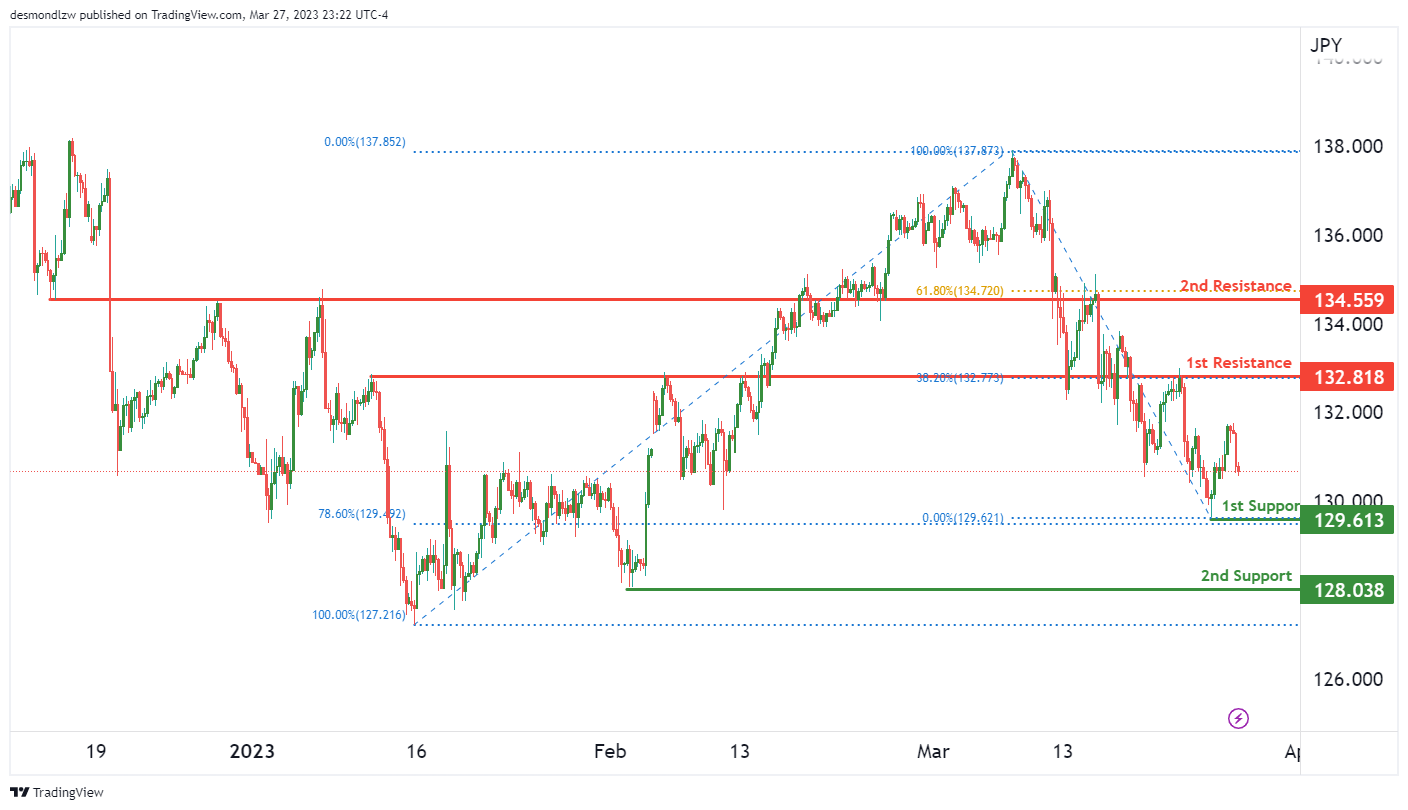
The USD/JPY chart currently shows bearish momentum, indicating that prices could potentially continue to move downwards. The first support level is at 129.61, which is a swing low support and coincides with the 78.60% Fibonacci retracement level. The second support level is at 128.03, which is also a swing low support. On the resistance side, the first level is at 132.81, which is an overlap resistance and lines up with the 38.20% Fibonacci retracement level. The second resistance level is at 134.55, which is also an overlap resistance and coincides with the 61.80% Fibonacci retracement level. If prices break the first support, it could potentially drop down to the second support level. However, if prices break the first resistance, it could potentially move upwards towards the second resistance.
AUD/USD:
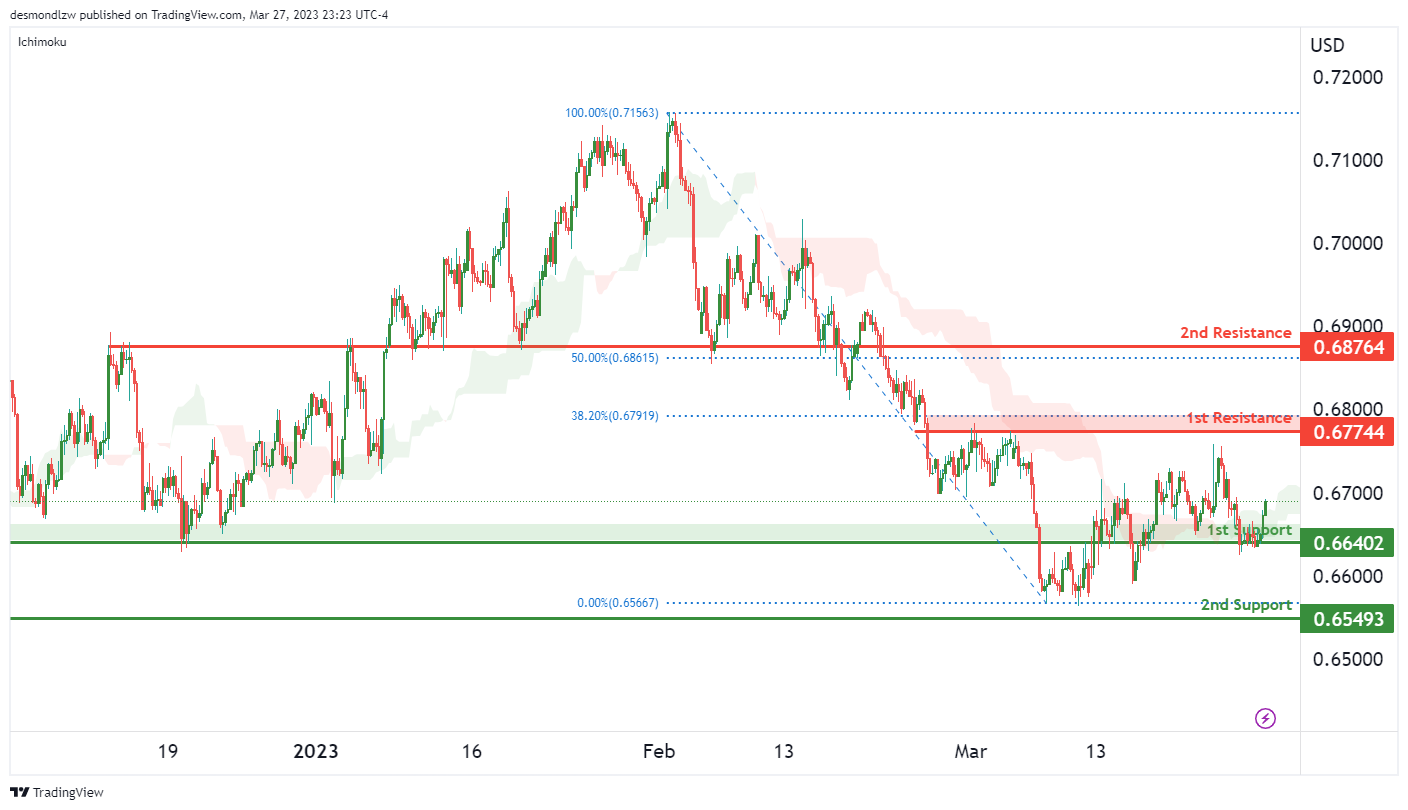
The AUD/USD chart is currently showing a bullish momentum, with price above the Ichimoku cloud. This suggests that the uptrend may continue.
If price were to continue to rise, it could potentially reach our 1st resistance at 0.6774, which is a strong overlap resistance level and coincides with a 38.20% Fibonacci retracement.
In the event of a price drop, the first support level to look out for is at 0.6640, which is a strong overlap support level. If price were to break this support level, it could potentially drop to the 2nd support at 0.6549, which is also a swing low support.
There is a 2nd resistance level at 0.6876 which is a significant overlap resistance level and coincides with a 50% Fibonacci retracement. If price were to break this resistance level, it could potentially rise even further.
Overall, the bullish momentum in the AUD/USD chart suggests that price may continue to rise towards the 1st resistance level at 0.6774. However, it’s important to monitor the support levels at 0.6640 and 0.6549 in case of a price drop.
NZD/USD:
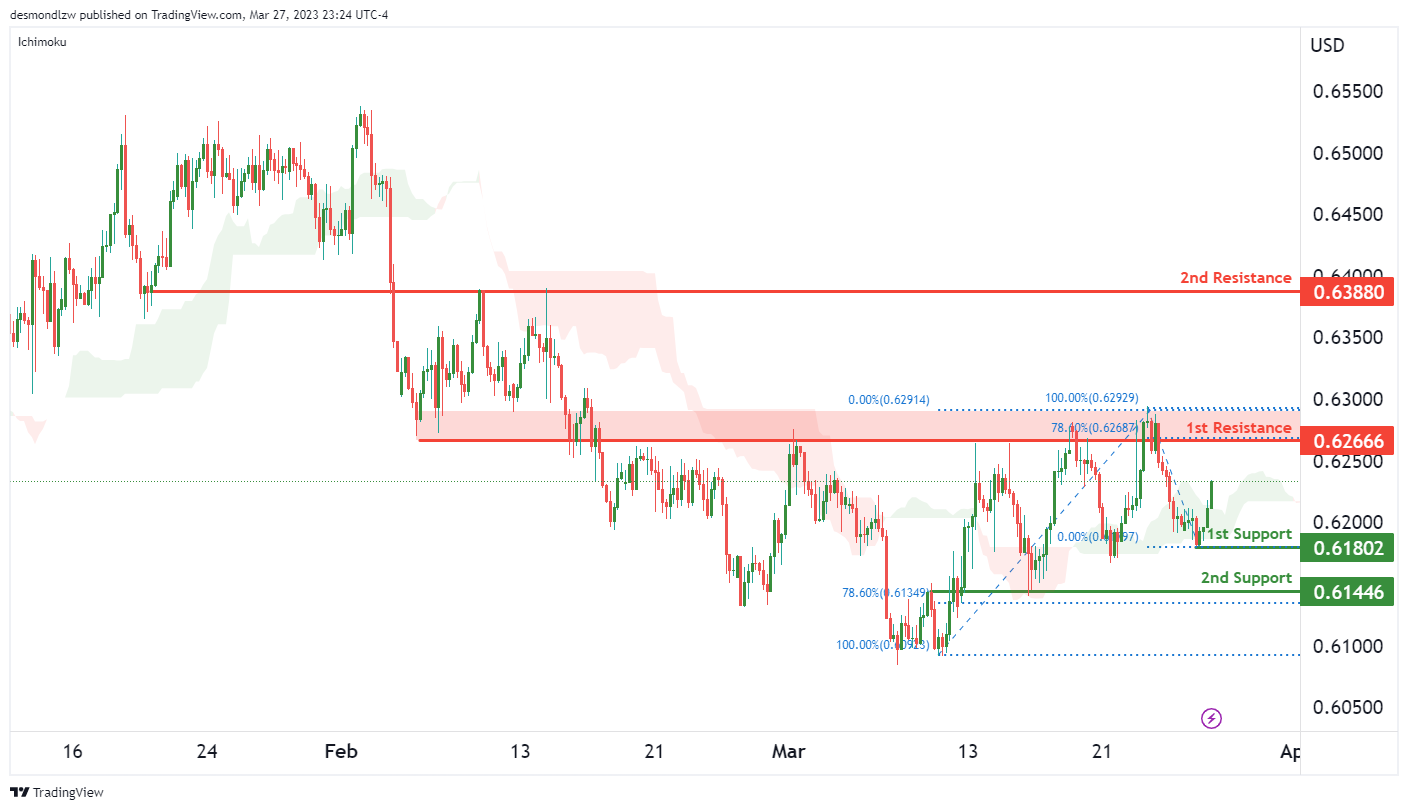
The overall momentum of NZD/USD for this particular instrument has been bullish. One of the key factors contributing to this bullish momentum is the fact that price is currently above the bullish Ichimoku cloud. With that in mind, there is a potential for a bullish continuation towards the 1st resistance level.
The 1st support level is situated at 0.6180 and is a good level to look out for, as it is a swing low support. The 2nd support level at 0.6144 is also significant as it is an overlap support and is aligned with the 78.60% Fibonacci retracement.
On the other hand, the 1st resistance level is at 0.6266, which is another overlap resistance and is aligned with the 78.60% Fibonacci retracement. If price were to break this level, the next resistance level to look out for would be the 2nd resistance at 0.6388, which is also an overlap resistance.
USD/CAD:
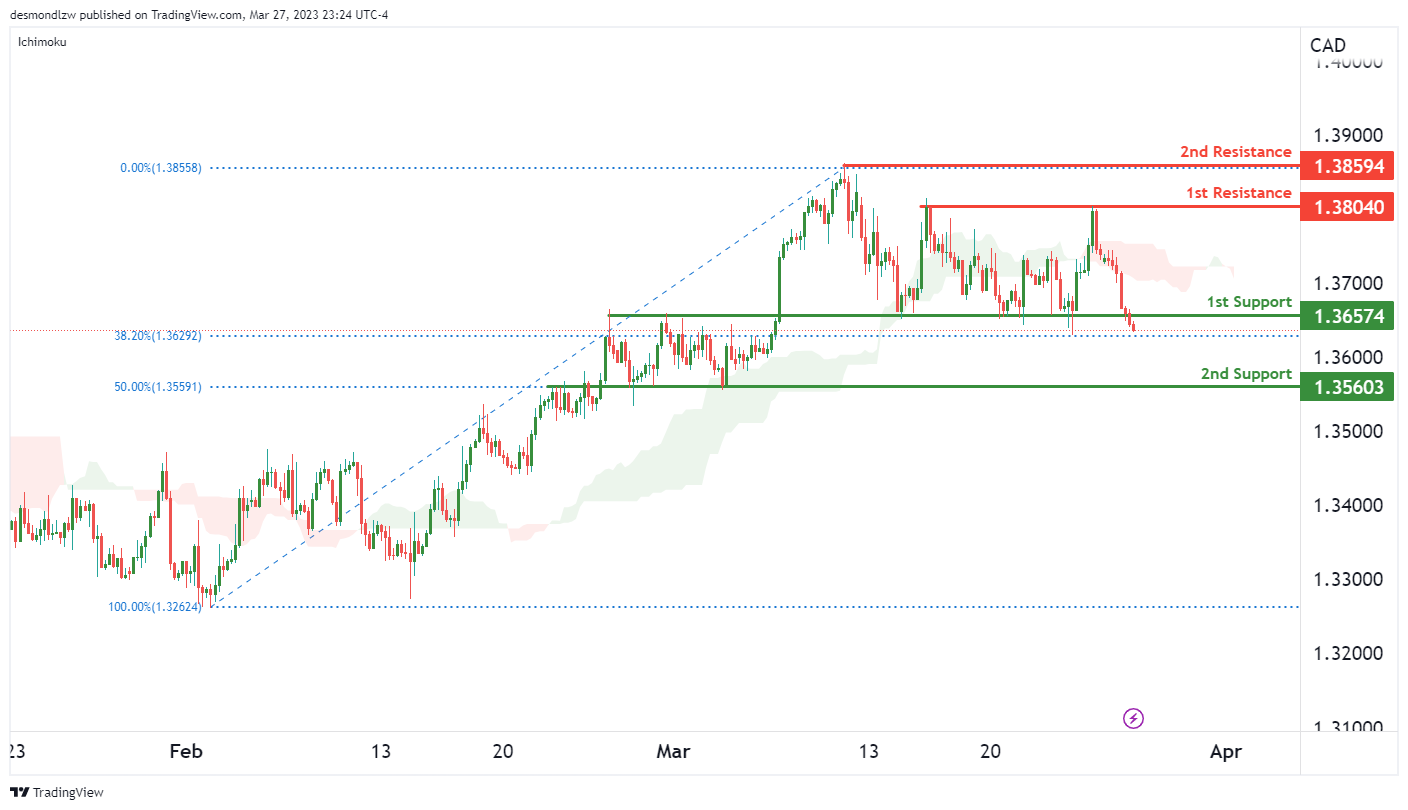
The overall momentum of the USD/CAD chart is bearish, with price currently trading below the bearish Ichimoku cloud. There is a possibility of a bearish break off the 1st support level, which could result in a drop towards the 2nd support level
The 1st support level is at 1.3657, and it is a strong overlap support level, coinciding with a 38.20% Fibonacci retracement. If price were to break below this level, it could potentially drop towards the 2nd support level at 1.3560, which is another overlap support level coinciding with a 50% Fibonacci retracement.
On the other hand, there are two resistance levels to watch out for. The 1st resistance level is at 1.3804, and it is a swing high resistance. The 2nd resistance level is at 1.3859, which is also a swing high resistance.
Given the current bearish momentum of the chart, there is a higher probability of a drop towards the support levels rather than a rise towards the resistance levels. However, it is important to monitor price action closely, as a break above the 1st resistance level could potentially shift the bias towards a more bullish outlook.
DJ30:
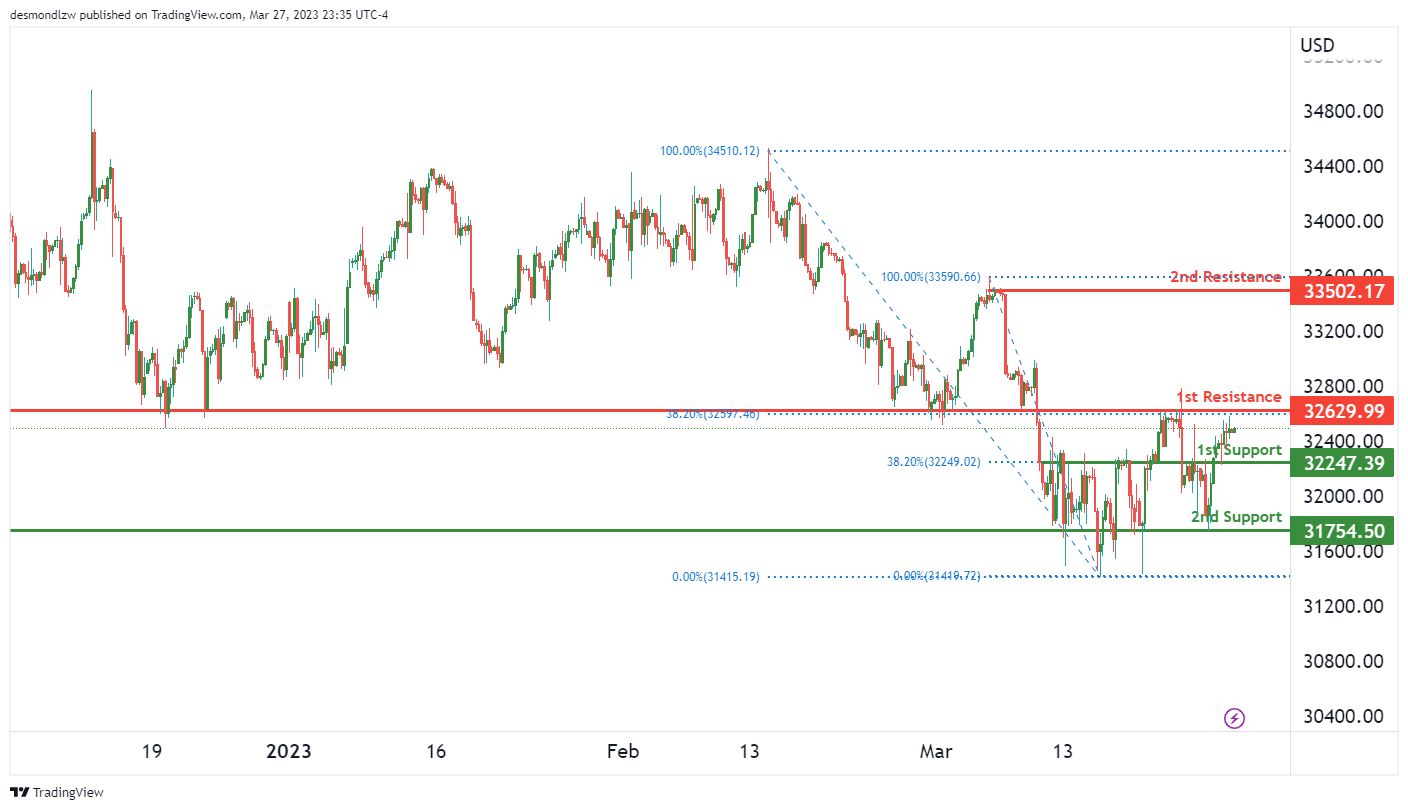
The DJ30 chart is currently showing a neutral momentum, indicating that there is no clear direction or trend at present. The price may fluctuate between the first resistance and support levels in the near future.
The first support level is at 32,247 and is a strong overlap support level that coincides with the 38.20% Fibonacci retracement level. The second support level is at 31,754 and is a swing low support level that has been tested multiple times in the past.
On the other hand, the first resistance level is at 32,629 and is another strong overlap resistance level that coincides with the 38.20% Fibonacci retracement level. The second resistance level is at 33,502 and is a swing high resistance level.
It is important to note that there is no clear momentum driving the price in a certain direction at present.
GER30:
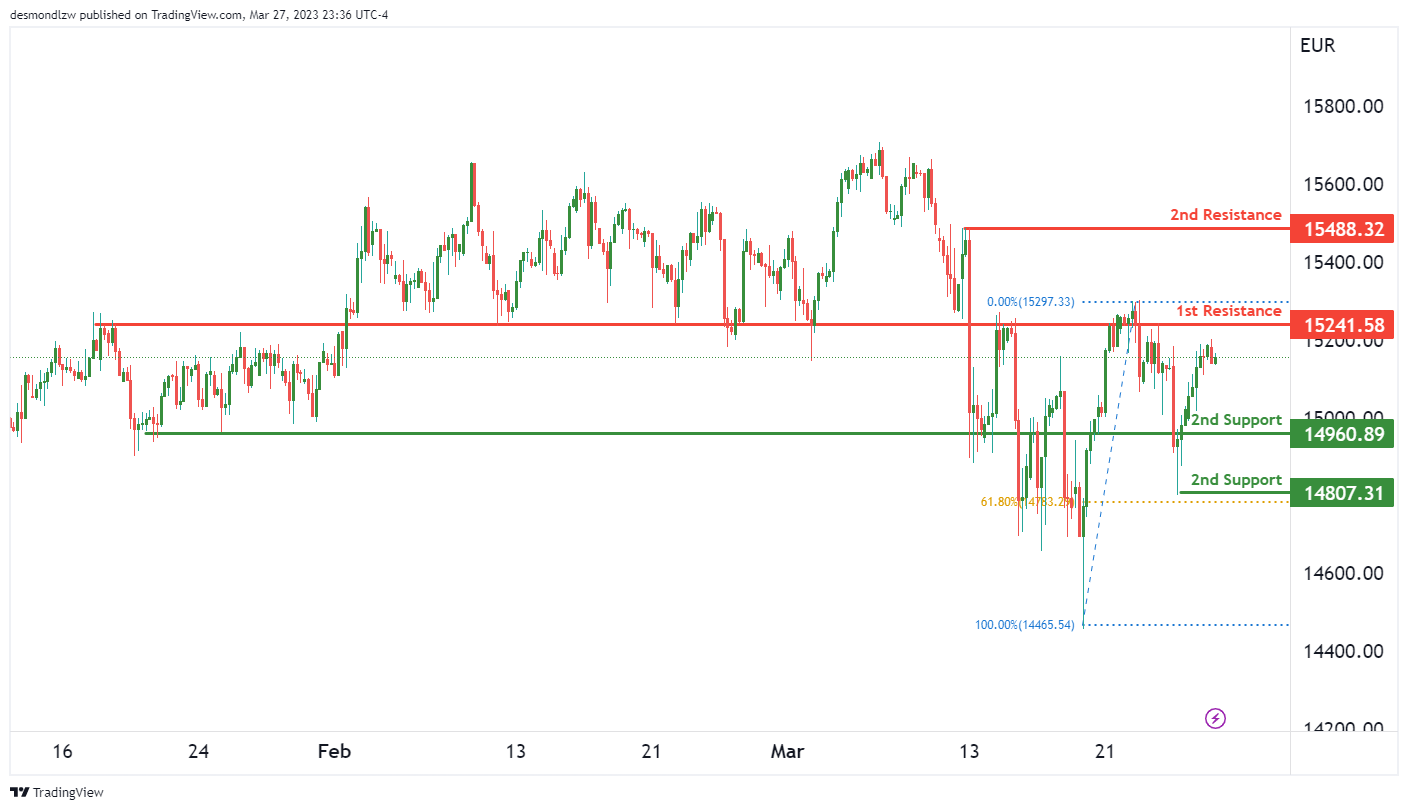
The GER30 chart is currently showing bullish momentum, with price potentially making a continuation towards the 1st resistance level. Price is currently above the Ichimoku cloud, which suggests further bullish momentum could be in store.
The 1st support level is at 14960, which is a strong overlap support. If price were to bounce from this level, it could rise to the 1st resistance level at 15241. This level is also an overlap resistance, which adds to its significance.
If price were to break the 1st resistance, it could potentially rise towards the 2nd resistance at 15488. This level is a multi-swing high resistance and could provide a significant challenge for bulls.
However, if price were to drop, the 2nd support level at 14807 could provide a potential rebound point. This level is a swing low support and also lines up with the 78.60% Fibonacci retracement, making it a strong support zone.
BTC/USD:
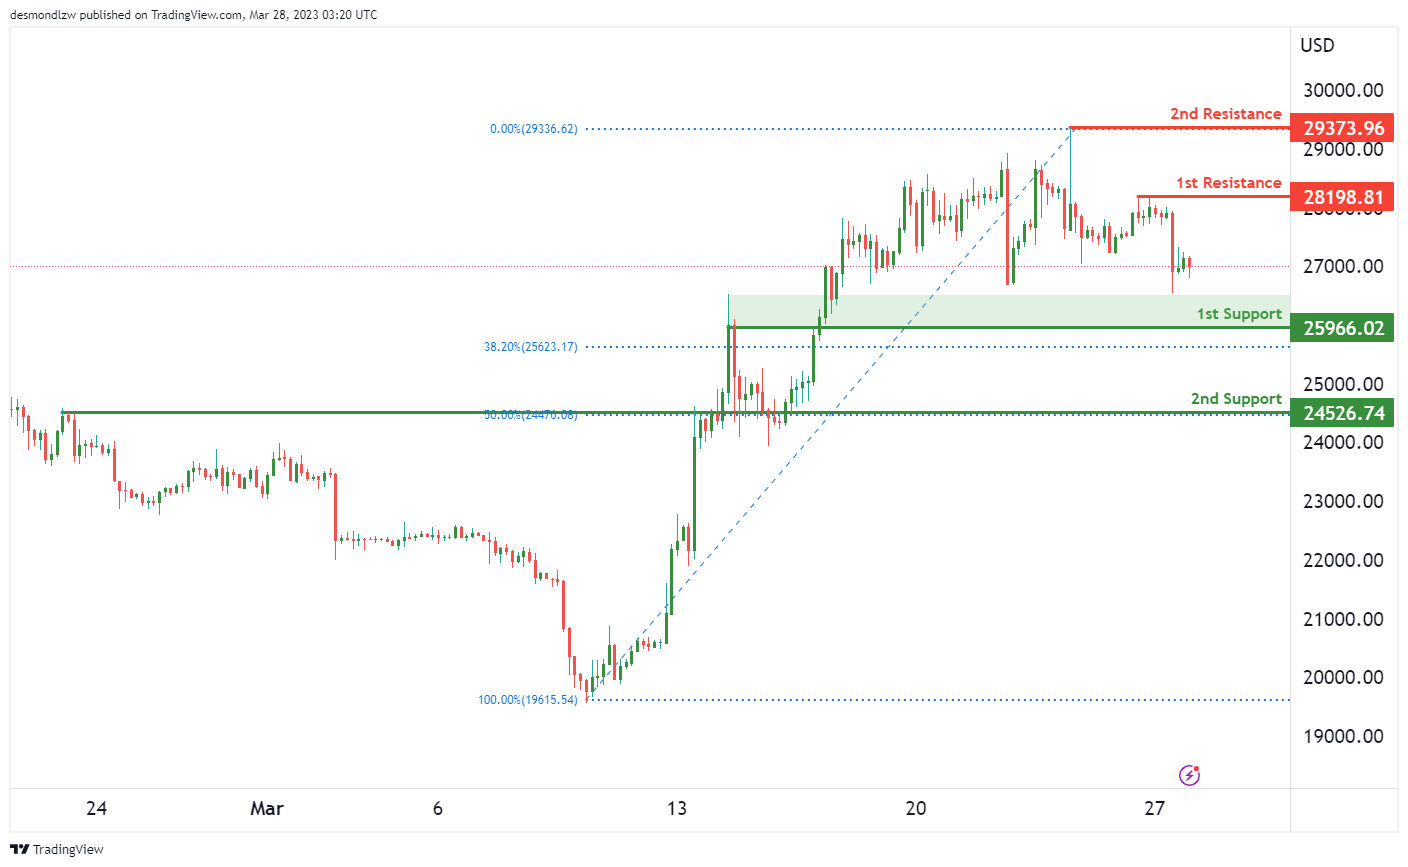
The overall momentum of the BTC/USD chart is currently bearish. Price has the potential to make a bearish continuation towards the 1st support level, which is at 25966. This level is an overlap support and coincides with a 38.20% Fibonacci retracement, making it a strong level of potential support. If price were to break below this level, the next support level it could drop to is the 2nd support at 24526. This level is also an overlap support and lines up with the 50% Fibonacci retracement, making it another strong level of potential support.
On the resistance side, the 1st resistance is at 28198. This level is a swing high resistance and could potentially act as a level where price might reverse its downward momentum. The 2nd resistance is at 29373, which is also a swing high resistance and could be another level where price may reverse its downward momentum.
Overall, it seems like the BTC/USD chart is exhibiting bearish momentum. The support and resistance levels discussed above suggest that price could potentially drop further towards the 1st and 2nd support levels. It’s important to keep an eye on these levels as a break of the 1st support could signal a potential move down towards the 2nd support. On the other hand, a break above the 1st resistance could indicate a potential reversal in the bearish momentum.
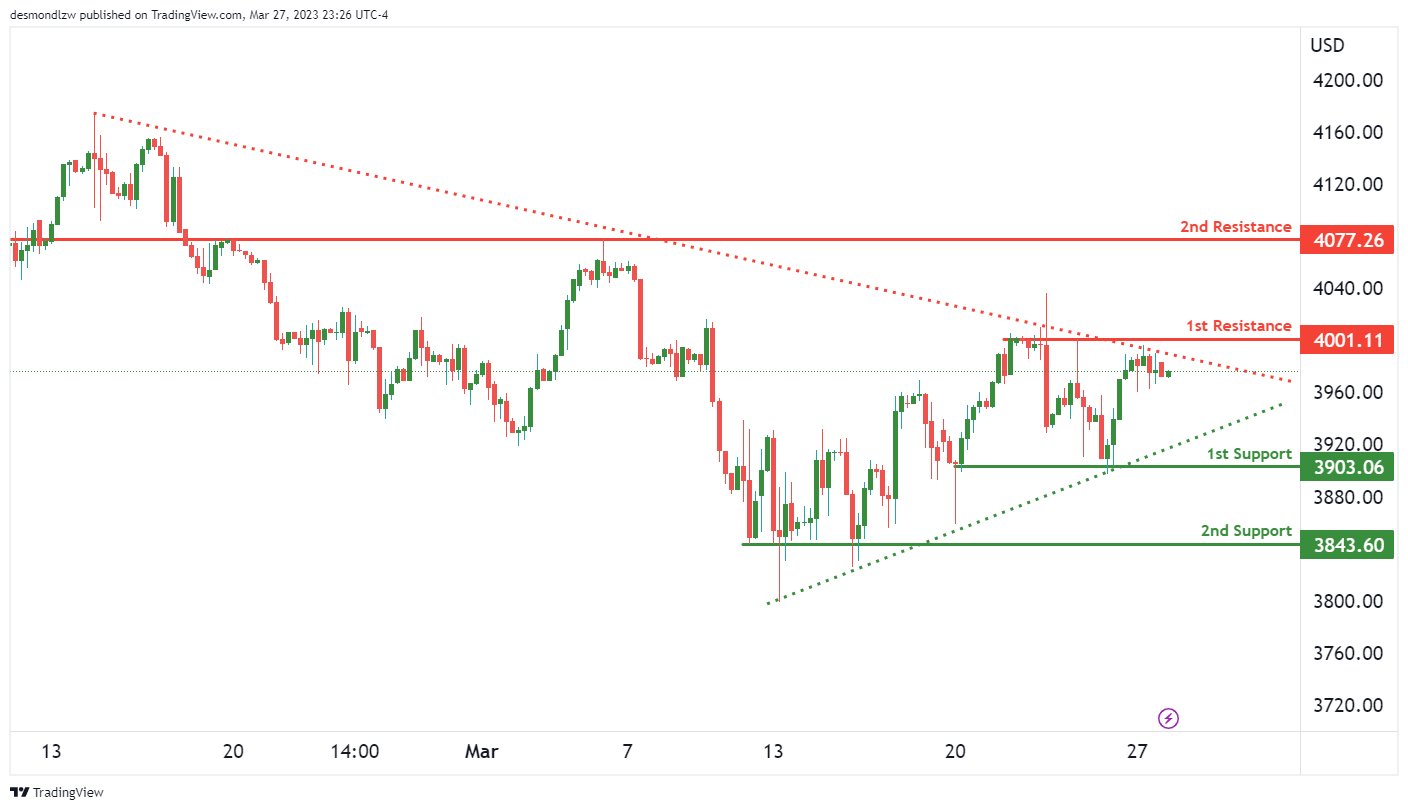
US500
The US500 chart shows overall bullish momentum, with price above a major ascending trend line indicating further potential bullish momentum on the horizon. However, there is also a major descending trend line above price, suggesting that bearish momentum could also be on the cards.
In terms of potential price movement, the US500 could see a bearish continuation towards its 1st support at 3903.06, which is a multi-swing low support level. If this level were to break, the next support is at 3843.60, another multi-swing low support.
On the other hand, if bullish momentum continues, price could rise towards the 1st resistance level of 4001.11, which is a multi-swing high resistance level. The 2nd resistance level is at 4007.26, an overlap resistance level.
ETH/USD:
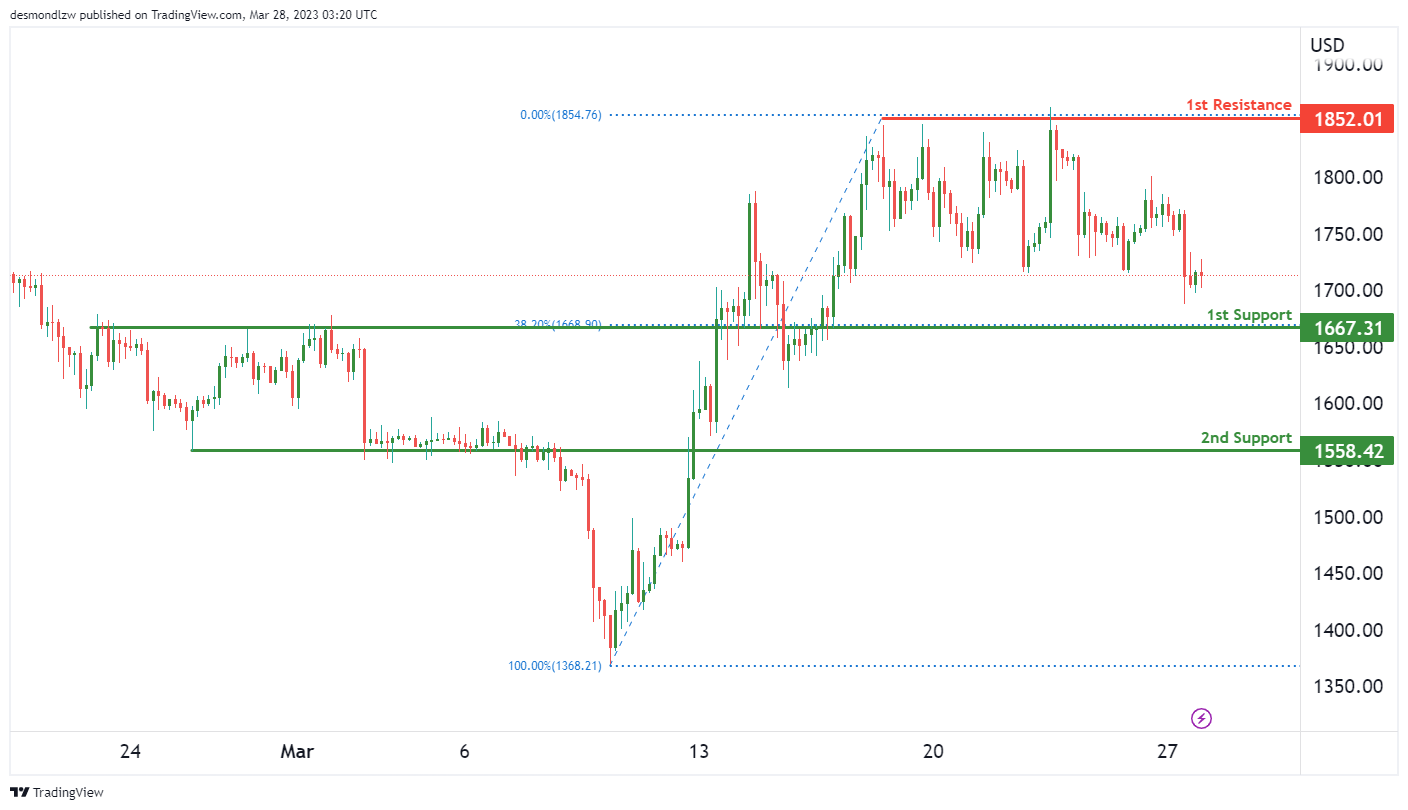
ETH/USD Continues Bearish Momentum, Potential for Drop to 1st Support
The overall momentum of the ETH/USD chart is currently bearish, with the price potentially making a bearish continuation towards the 1st support level. This is indicated by the price being below the bearish Ichimoku cloud.
The 1st support level for ETH/USD is at 1667.31. This level is a good support as it is an overlap support and also has a 38.20% Fibonacci retracement lining up with it. If the price were to break below this level, it could potentially drop towards the 2nd support level at 1558.42, which is another overlap support.
On the other hand, the 1st resistance level for ETH/USD is at 1852.01, which is a multi-swing high resistance. The price has struggled to break above this level in the past, indicating strong selling pressure from the bears.
WTI/USD:
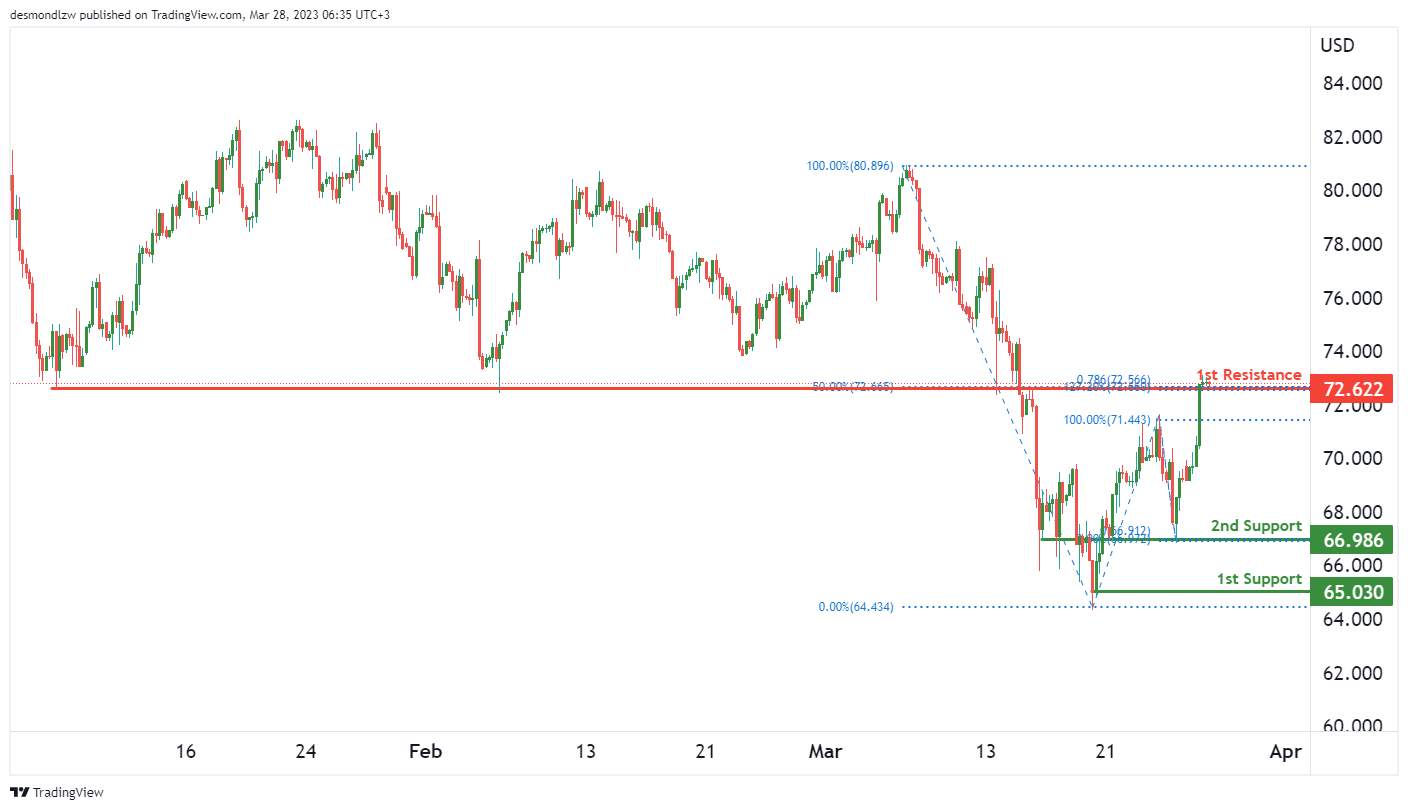
WTI: Potential for Bearish Reaction off 1st Resistance and Drop to 1st Support
The overall momentum of the WTI chart is currently bearish, with price potentially making a bearish reaction off 1st resistance and dropping to 1st support.
The 1st support level to watch is at 66.98. This level is an overlap support and has held as support in the past. If price were to break below this level, it could drop towards the 2nd support at 65.03, which is a multi-swing low support.
On the other hand, the 1st resistance level to watch is at 72.62. This level is an overlap resistance and has acted as a ceiling to price in the past. It also coincides with the 127.20% Fibonacci retracement, adding more significance to the level.
If price were to react off the 1st resistance and drop towards the 1st support, it would confirm the bearish momentum of the chart. However, if price were to break above the 1st resistance, it could potentially rise towards higher resistance levels.
XAU/USD (GOLD):
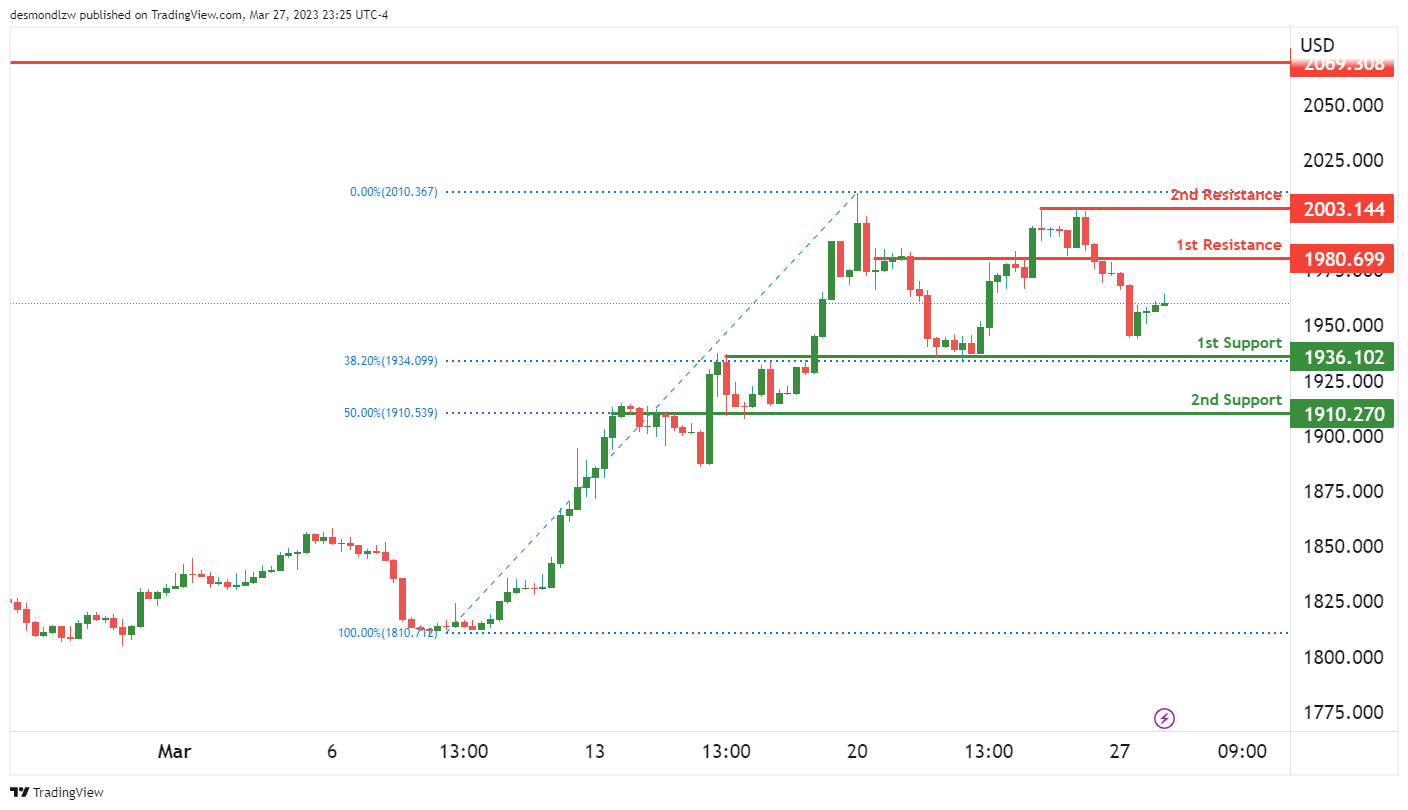
Gold Maintains Bullish Momentum, Could See Continuation Towards Resistance Levels
Gold’s overall momentum remains bullish, as the precious metal continues to trade above key support levels. Currently, gold is trading at around $1965.00 against the US dollar.
Price could potentially see a bullish continuation towards the 1st resistance level of $1980.00. However, it may encounter some resistance at this level, which coincides with a strong overlap resistance.
If price manages to break through the 1st resistance, it could potentially rise towards the 2nd resistance level of $2003.00, which is a multi-swing high resistance.
On the downside, there are two support levels to watch out for. The 1st support level is at $1963.00, which is a key overlap support level and a 38.20% Fibonacci retracement. The 2nd support level is at $1910.00, which is also an overlap support level and a 50% Fibonacci retracement.
Fed Jefferson on balancing inflation and economic stability
Fed Philip Jefferson stated yesterday that the current inflation rate is too high, emphasizing the FOMC's goal to reduce it to 2% as quickly as possible. Speaking at Washington and Lee University in Lexington, Virginia, he acknowledged that the process may take some time due to persistent inflation components such as services excluding housing.
Jefferson said, "I would like to say that inflation will return to 2% soon, but we have to do it in a way that does not damage the economy any more than is necessary. That's what we are trying to do." Fed is grappling with the challenge of ensuring price stability amid high inflation while also maintaining financial stability in the wake of the second-largest bank failure in US history.
In his speech, Jefferson also noted that although inflation has begun to decline, it remains unclear whether this decrease is due to higher interest rates, easing pandemic-induced supply strains, or falling energy prices.
He highlighted the uncertainty surrounding the full impact of the Fed's tightening measures, saying, "Monetary policy affects the economy and inflation with long, variable, and highly uncertain lags, and we are still learning about the full effect of our tightening thus far."
GBP/USD Eyes Sustained Increase Above 1.2350
Key Highlights
- GBP/USD is showing positive signs above the 1.2220 level.
- A connecting bullish trend line is forming with support at 1.2240 on the 4-hours chart.
- EUR/USD is well supported above the 1.0720 support zone.
- USD/JPY might attempt a recovery wave if it clears the 132.00 resistance.
GBP/USD Technical Analysis
The British Pound gained pace above the 1.2050 resistance against the US dollar. GBP/USD broke the 1.2150 level to settle in a positive zone.
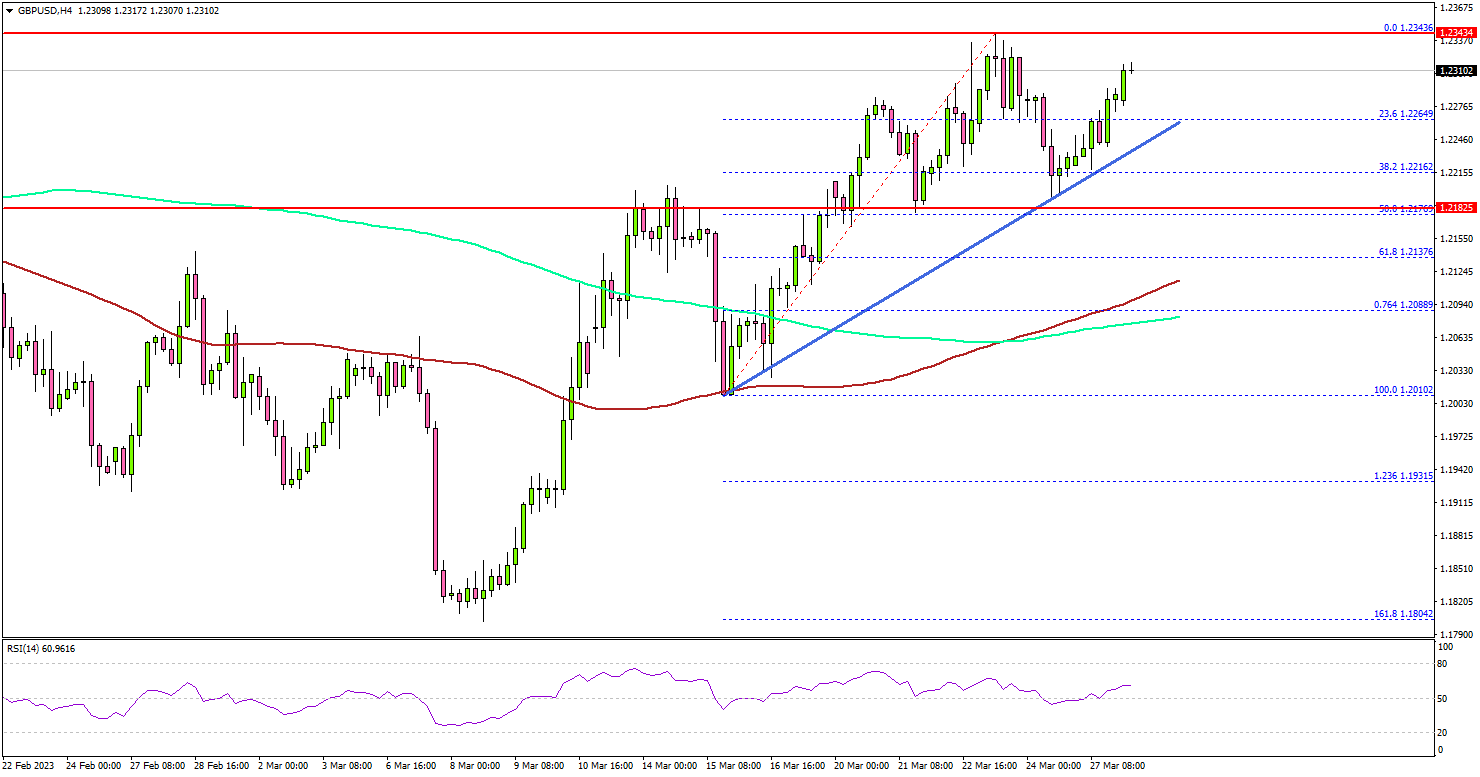
Looking at the 4-hours chart, the pair even settled above the 1.2200 level, the 100 simple moving average (red, 4-hours) and the 200 simple moving average (green, 4-hours). It traded towards 1.2350 before there was a downside correction.
The pair tested the 1.2200 support zone and remained in a positive zone. It is now rising, with an immediate resistance near the 1.2320 level.
The first major resistance is near the 1.2350 level. The next major resistance is near the 1.2400. A clear move above the 1.2400 resistance might send the pair towards the 1.2500 zone. Any more gains might send the pair towards 1.2580 or even 1.2700.
On the downside, an immediate support is near the 1.2220. The next major support is near the 1.2200 level, below which there is a risk of a move towards the 100 simple moving average (red, 4-hours). Any more losses might open the doors for a drop towards the 1.1920 level.
Looking at EUR/USD, the pair stayed above the 1.0720 support zone and might attempt a fresh increase if GBP/USD extends gains.
Economic Releases
- ECB's President Lagarde speech.
CADJPY Wave Analysis
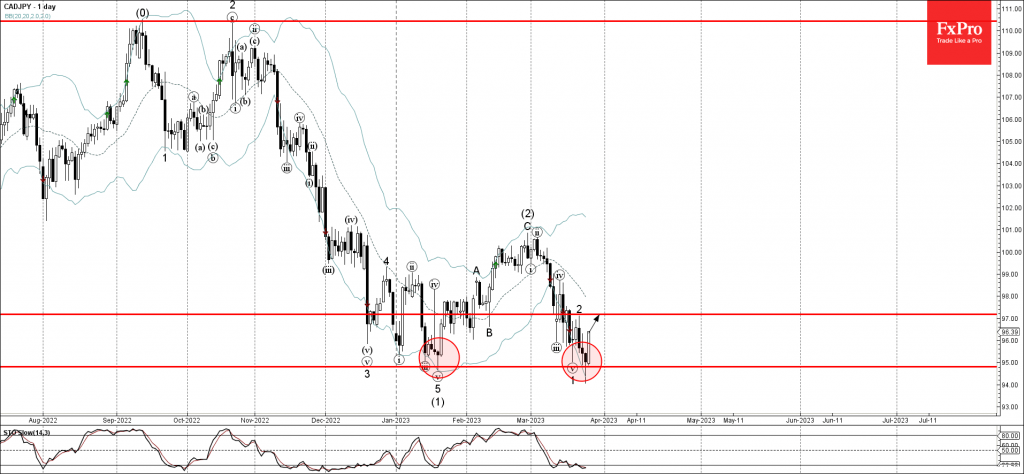
- CADJPY reversed from support level 94.80
- Likely to rise to resistance level 97.00
CADJPY previous reversed up from major support level 94.80 (which stopped the previous sharp downtrend in the middle of January), standing near the lower daily Bollinger Band.
The upward reversal from the support level 94.80 created the daily Japanese candlesticks reversal pattern Hammer – similar to the one the pair created in January.
Given the oversold daily Stochastic and the strong yen sales, CADJPY can then be expected to rise further toward the next resistance level 97.00 (top of the previous correction 2).
EURJPY Wave Analysis
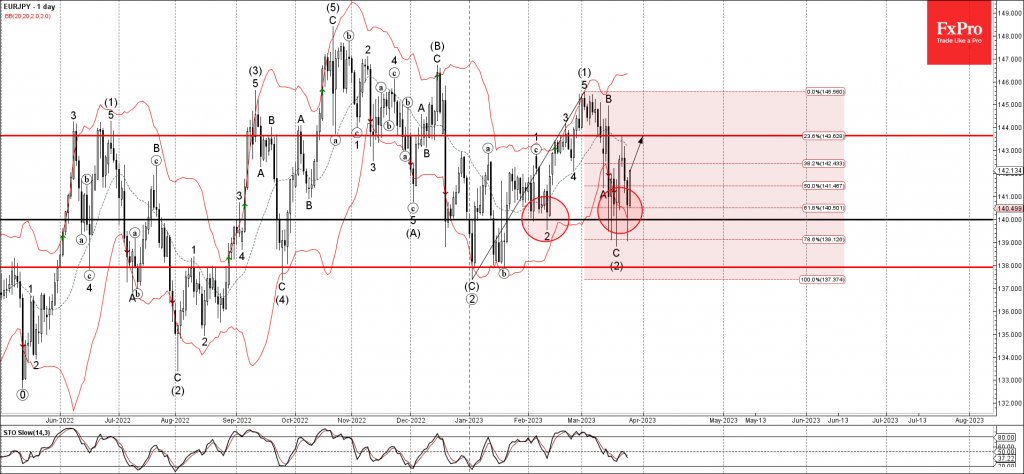
- EURJPY reversed from key support level 140.00
- Likely to rise to resistance level 143.65
EURJPY recently reversed up from key support level 140.00 (which has been reversing the price from the start of February).
The support level 140.00 was strengthened by the 61.8% Fibonacci correction of the previous upward impulse (1) from January and by the lower daily Bollinger Band.
EURJPY can then be expected to rise further toward the next resistance level 143.65 (top of the previous Evening Star).
USD/JPY: Recovery Gains Pace But Strong Obstacles Lay Ahead
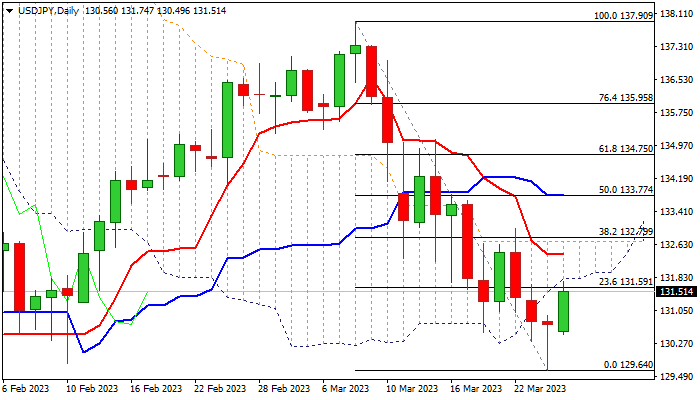
The USDJPY bounces on Monday after Friday’s action left long-tailed Doji, with short-lived dip below psychological 130 support signaling a bear-trap and forming reversal pattern on daily chart.
Initial signal of direction change still needs more evidence, with break of daily cloud base (131.81), seen as a minimum requirement, with extension above the cloud top (132.69) needed to confirm reversal.
Daily cloud twists on Friday and was so far magnetic, though prevailing negative tone on daily studies (rising negative momentum / moving averages in full bearish setup) may cause more significant negative impact on fresh bulls, which already came under pressure on 4-hr hart (fading bullish momentum / overbought stochastic).
Slight optimism on easing tensions in banking sector prompted traders into dollar from safe-haven yen, however persisting concerns that crisis may deepen, as markets are not convinced that the worst is already behind us, continue to weigh and require caution.
Look for initial signal on today’s closing and reaction at daily cloud base.
Res: 131.81; 132.37; 132.70; 133.00.
Sup: 130.98; 130.74; 130.00; 129.64.
Japanese Yen Suffers the Most on Currency Markets
Markets
Investors adopted a glass-half-full approach at the start of the new week, extending an intraday recovery that lifted Wall Street out of the red on Friday. Optimism today was further fueled by Bloomberg reporting over the weekend that US authorities are considering to extend the liquidity-offering programme in such a way that it gives the current US bank in focus, First Republic, more time to restore its balance sheet. Equities in Europe bounced 1%, recouping about half of the losses incurred on Friday. US stocks open with 0.2-0.8% gains. Core bond yields shoot higher and money markets in areas including the US, UK and eurozone, pare back their premature cutting bets. ECB’s Nagel in this respect was pretty clear: the central bank must be resolute in fighting inflation: “[…] we’ll continue to move forward resolutely on the path of monetary normalization until inflation is contained and price stability is restored.” Aside from more rate hikes, he calls for an acceleration in QT from the summer. Nagel added that Europe’s banking and financial system is resilient but the ECB has suitable instruments (other than rates) to offer support if needed. German yields jump between 12.9 (30y) and 17.0 bps (2y). The 2% support in the country’s 10y yield thus survives another test that begun end last week. US yields surge in a similar curve shift (7.2 to 19.2 bps) with the 2y yield testing the symbolic 4% mark. Economic data was scant but in any case did not thwart the upleg. The German Ifo indicator rose from 91.1 to 93.3, defying expectations for a stabilization at 91. It is the highest reading since February 2022, before the Russian invasion. Both the current assessment (from 93.9 to 95.4) and the expectations component (from 88.4 to 91.2) improved.
The Japanese yen suffers the most on currency markets. Risk-on and the core bond yield rally lifts USD/JPY from 130.56 to 131.68. EUR/JPY rebounds from 140.57 to 141.85. The euro and the dollar are worthy to each other. EUR/USD ekes out a small gain to 1.078. The trade-weighted DXY index is holding steady above 103. Last week’s risk-off failed to support the traditional safe haven that the USD normally is. That’s because concerns about financial stability originated specifically from the US. Consequently, when fears ebb like today, the dollar’s appeal isn’t dented as much as would be the case otherwise. Sterling isn’t giving up the fight for EUR/GBP 0.88. The pair however did leave the intraday lows at around 0.878 behind as the first US investors started joining.
News & Views
According to GKI Economic Research, economic sentiment in Hungary rose markedly in March to -13.8 from -18.2 as both consumer expectations (-43.8 from -51.9) and business confidence (-3.2 from -6.4) improved. In the business sector, expectations of industrial and service companies improved significantly, while expectations in construction and trade deteriorated noticeably, but to a lesser extent. According to GKI, companies’ efforts to raise prices declined substantially, while their willingness to hire rose. Consumers are no more worried than they were in 2020, during the panic of the Covid outbreak. However, pessimism is still very strong. The assessment of the state of the Hungarian economy was more positive than in February, both among households and businesses. In other news from the country, government party Fidesz nominated Eva Buza and Zoltan Kovacs for the monetary council of the National bank of Hungary. Buza said that price stability is the MNB’s primary goal. Inflation needs to be curbed to single digits by the end of the year. She also advocated fiscal and monetary policy coordination is needed. Recently, MNB governor Matolcsy and Prime Minster Orban openly disagreed on the trajectory for monetary policy. The forint trades even trades marginally weaker today (EUR/HUF 385.75 area) even as risk sentiment improved.
According to data published by the Confederation of British Industry, reported sales in retailing in March were broadly stable (1 from 2). However, sales for the time of the year improved from 6 to 12 and orders placed at suppliers also improved from -25 to -2. Retailers even turned further positive on future sales. The expected volume of sales (retailing) for April rose to 9 from -18, the first positive figure after 6 months of negative readings. Last week, the Bank of England in the communique after its policy meeting already indicated that GBP growth in the country is now expected to increase slightly in Q2 while a decline of 0.4% was expected in February. Q1 activity was still seen contracting marginally (0.1%).
USDJPY Stages Recovery, But Remains in Downtrend
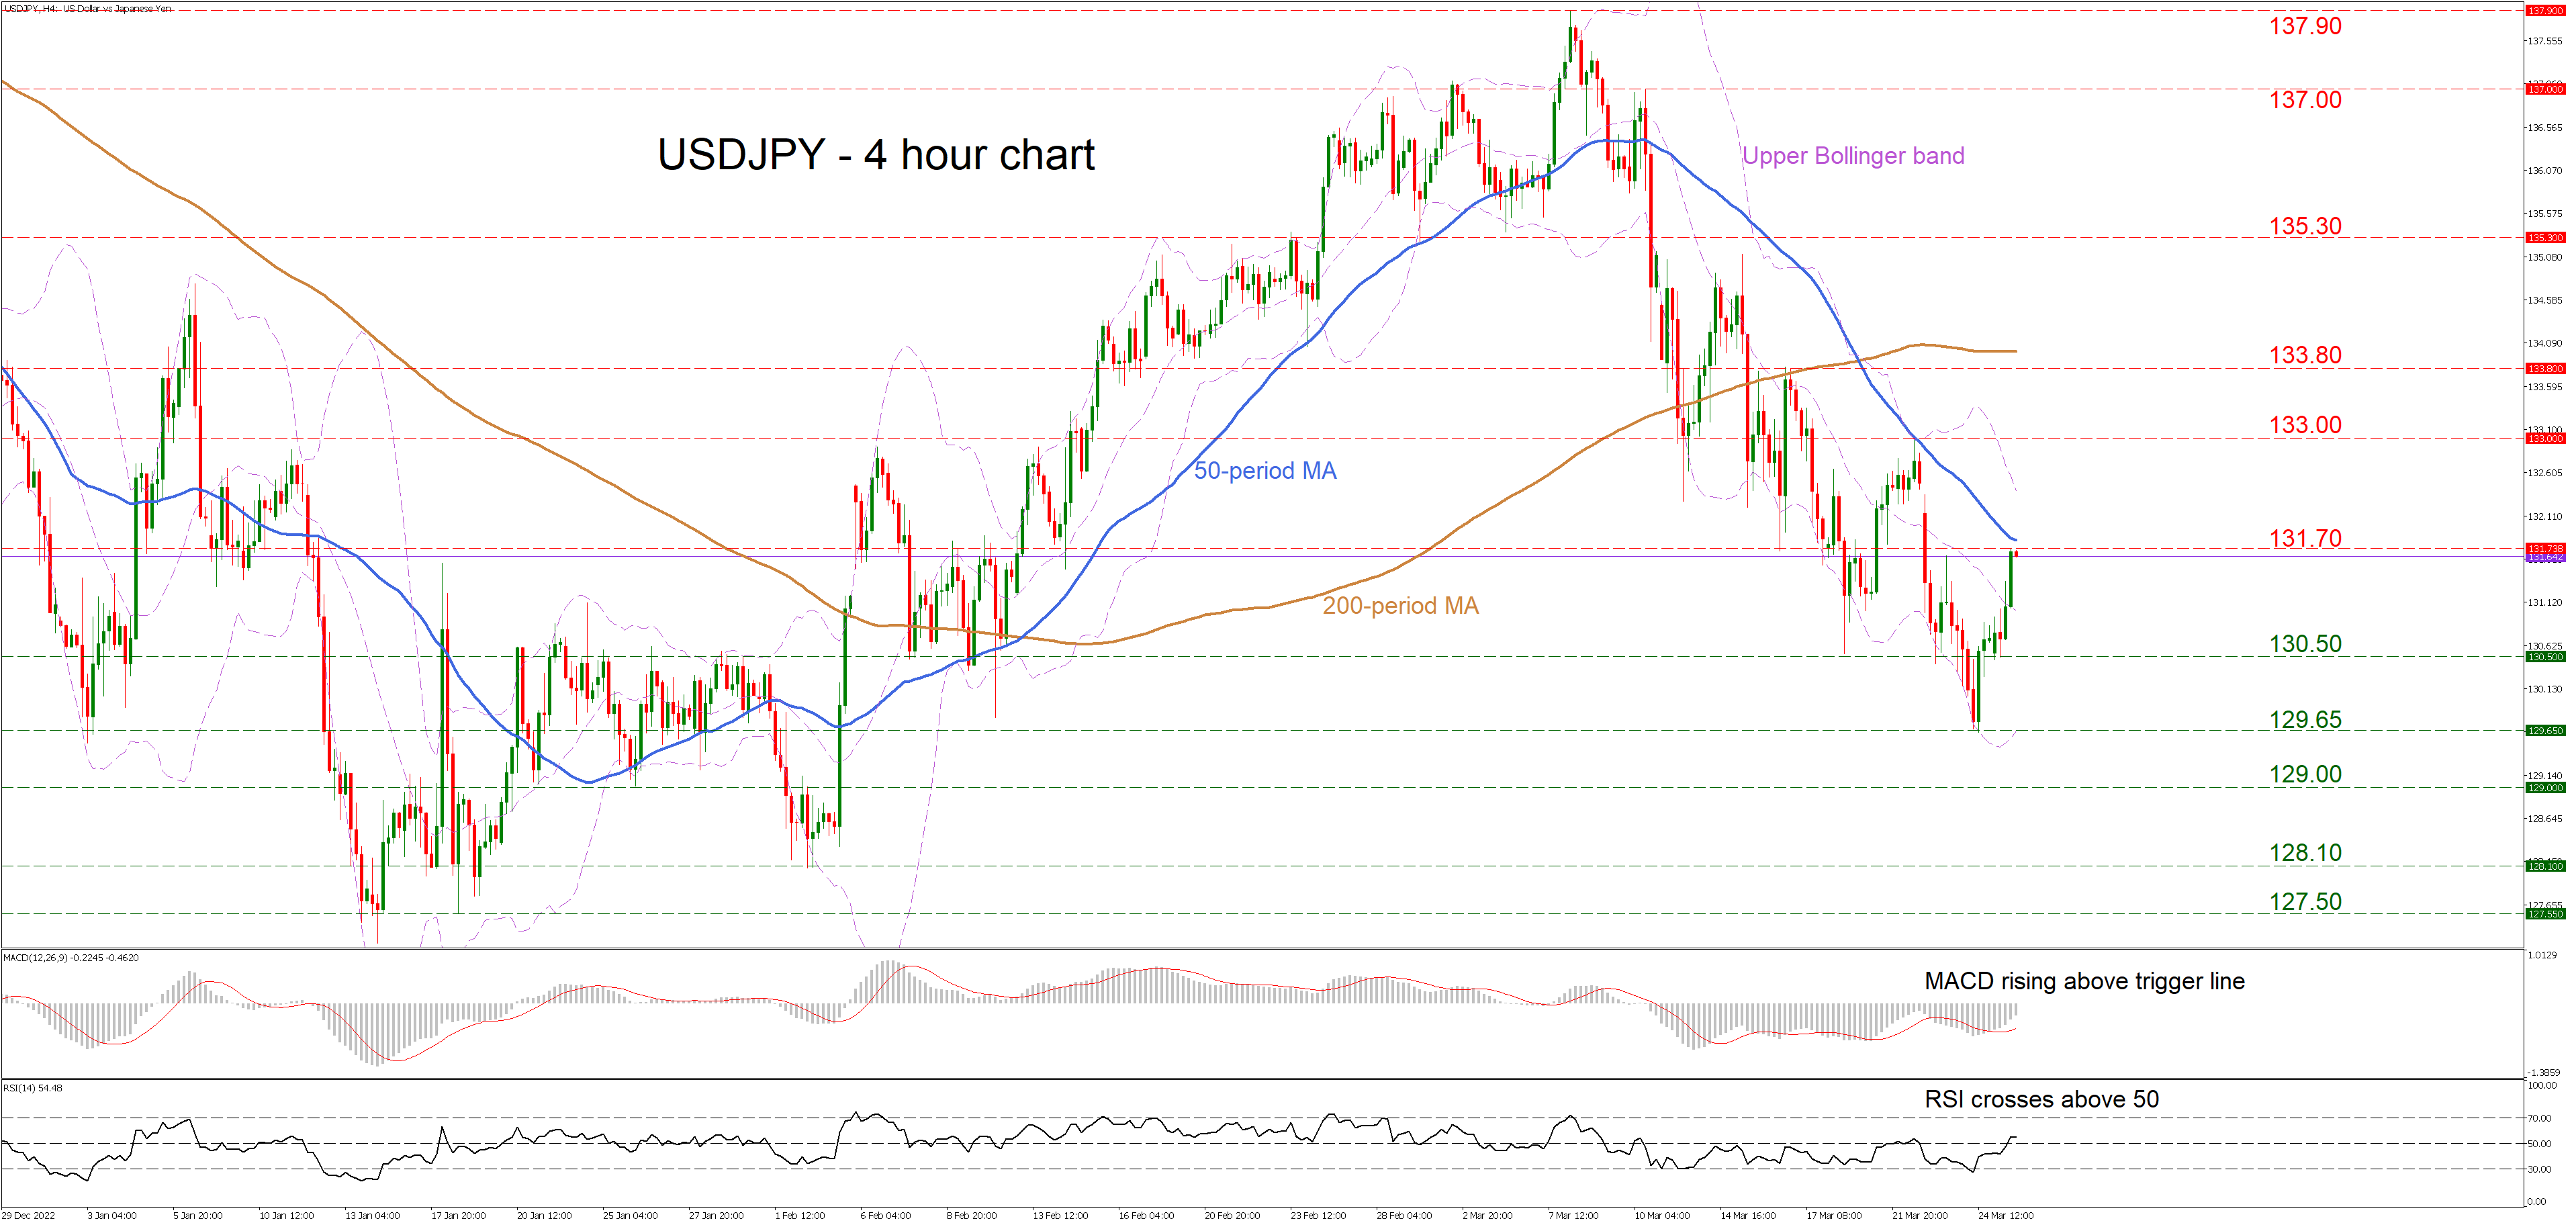
USDJPY staged a fierce recovery over the last few sessions. The pair found fresh buy orders near 129.65 and has risen to challenge the 131.70 region, where a battle is currently taking place between bulls and bears. Despite this rebound though, the market has not escaped its downtrend.
The price structure on the four-hour chart still consists of lower highs and lower lows. Similarly, the 50-period moving average (MA) has crossed below the 200-period one, forming a so-called 'death cross'. Both suggest the overall picture remains negative.
Momentum studies reflect the latest spike in the price, as the RSI has crossed above 50 while the MACD is above its red trigger line. However, neither oscillator reveals much about the next directional wave.
For buyers to remain in control, they would need to pierce above the 131.70 zone, which also encapsulates the 50-period moving average. In this case, the next area to provide resistance might be around the 133.00 handle, which was the latest local high.
Now in case sellers come back into action, the 130.50 territory could be their first target. Slicing below this area, the focus would turn to the recent low of 129.65, where the lower Bollinger band is also located. Any further declines would signal the resumption of the prevailing downtrend, opening the door towards 129.00.
In short, the latest recovery in USDJPY is not enough to alter the broader negative outlook. For that to change, buyers would need a new high above 133.00.
Gold Shines Brighter Even in Difficult Times: What is the Reason for the Price Increase
Gold continues its impressive streak of gains for the fourth week in a row. At the beginning of this week, the price of a troy ounce of the precious metal is around 1,973 USD.
This increase in the price of gold indicates that the market is looking for a "safe haven" from the effects of the banking crisis, which remains one of the main threats to the global economy. In addition, the US Federal Reserve's ambiguous stance on the future interest rate makes gold quite attractive to investors.
At the end of last week, the European banking sector came under pressure again, which caused an increase in anxiety in stock markets around the world. The concern was caused by the decline in the shares of the largest European bank Deutsche Bank.
Against the backdrop of this uncertainty, gold is again becoming a "safe haven" for the capital market, which makes it one of the most demanding investment assets in the face of economic uncertainty. Some analysts believe that the price of gold may continue to rise in the near future, until there is stability in the financial markets.
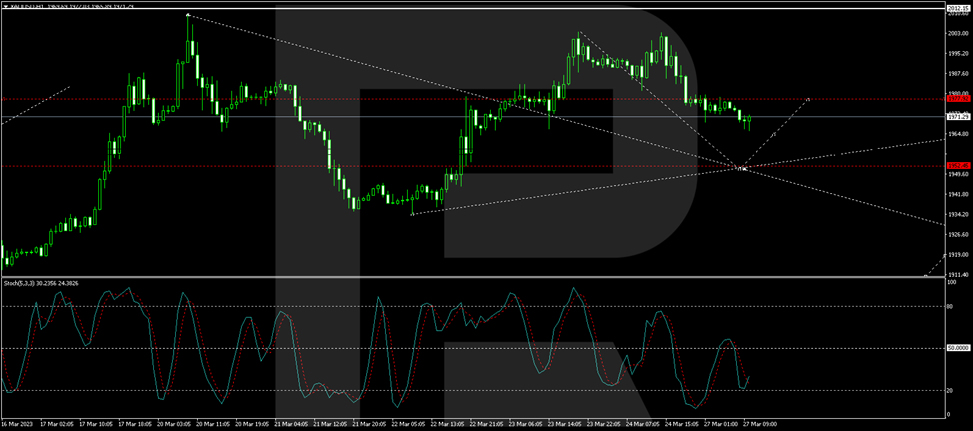
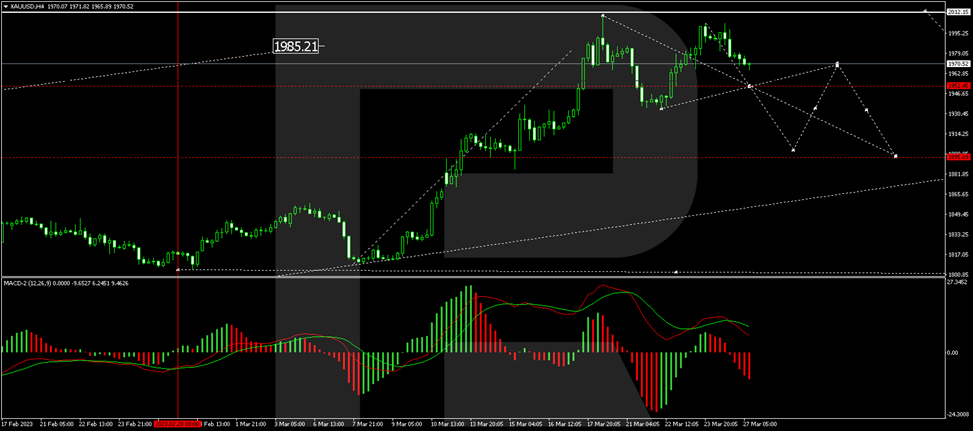
On H4, XAU/USD has performed an impulse of decline to 1934.24 and growth to 2003.30. At the moment, a consolidation range is forming at these levels. If the price breaks out of it downwards, a link of correction to 1895.00 might follow. If the price breaks through upwards, the wave might continue to 2012.12. Technically, this scenario is confirmed by the MACD. Its signal line is above zero, directed strictly down to renew the lows.
On H1, XAU/USD has performed a structure of decline to 1977.90. At the moment, a consolidation range is forming around it. With an escape from it downwards, the wave might continue to 1952.50. Then growth to 1977.90 might follow, and then — a decline to 1927.00. Technically, this scenario is confirmed by the Stochastic oscillator. Its signal line is above 20, aiming strictly upwards.