Sample Category Title
USD/JPY Daily Outlook
Daily Pivots: (S1) 129.93; (P) 130.43; (R1) 131.23; More...
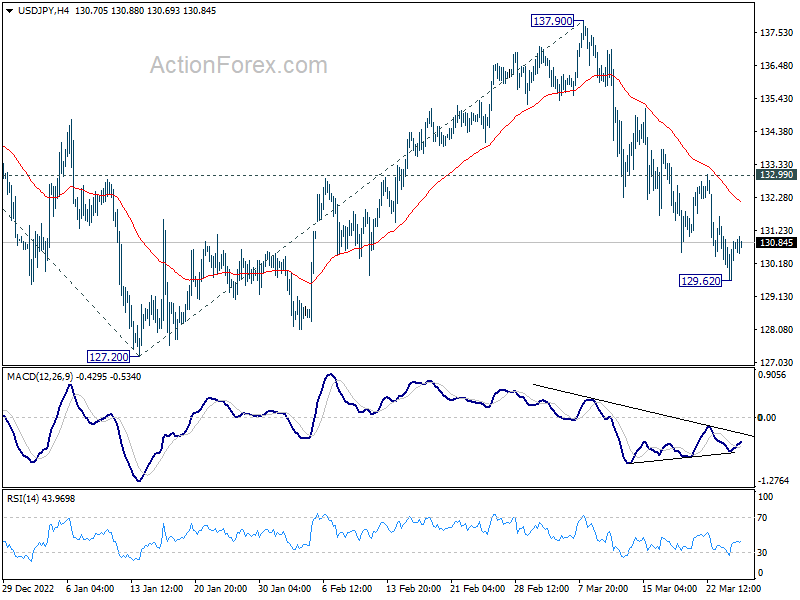
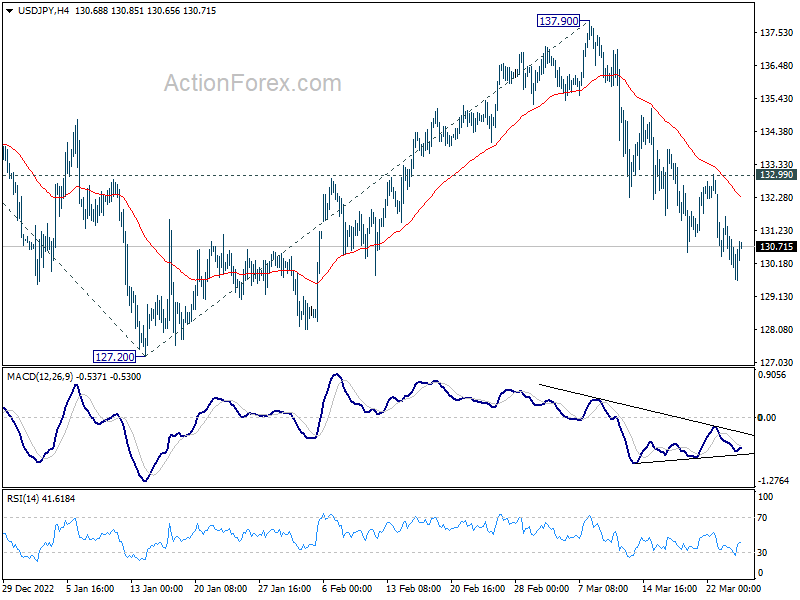
Intraday bias in USD/JPY is turned neutral with as fall from 137.90 lost momentum after hitting 129.62. Some consolidations could be seen first. But outlook stays bearish as long as 132.99 resistance holds. Break of 129.62 will target a test on 127.20 low. Decisive break there will resume larger decline from 151.93 to 61.8% projection of 151.93 to 127.20 from 137.90 at 122.61.
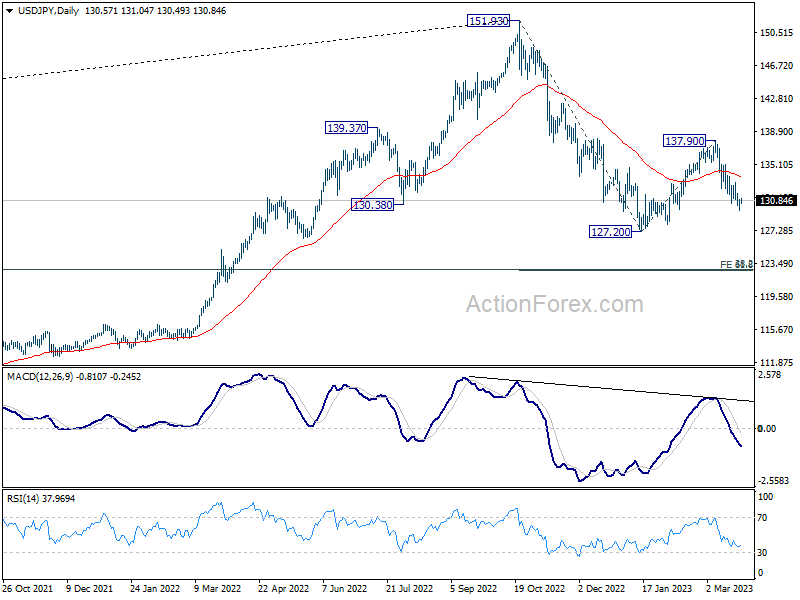
In the bigger picture, rebound from 127.20 should have completed at 137.90 as a corrective move. The down trend from 151.93 (2022 high) is still in progress. Break of 127.20 will resume this down trend and target 61.8% projection of 151.93 to 127.20 from 137.90 at 122.61. This will now be the favored case as long as 137.90 resistance holds.
Forex Markets Quiet as Focus Turns to Inflation Data This Week
The forex markets have been relatively quiet during today's Asian session, with currency pairs staying within Friday's range. Major stock indexes are also demonstrating mixed performance in a tight range. Inflation data from the Eurozone and the US will be closely monitored this week. Although these figures are crucial in determining the future rate path, reactions to this week's data may be somewhat subdued, given that both ECB and Fed meetings will not reconvene until May.
Ongoing developments in the banking crisis will continue to be a significant driving factor for all financial markets. As for currencies, Yen has emerged as the biggest winner for the month, seemingly bolstered by risk aversion and falling benchmark treasury yields in other markets. European majors follow closely behind, despite banking sector troubles. Commodity currencies and Dollar have been the weakest performers. It remains to be seen whether Yen could experience further gains before the month's end and which currencies will be most affected.
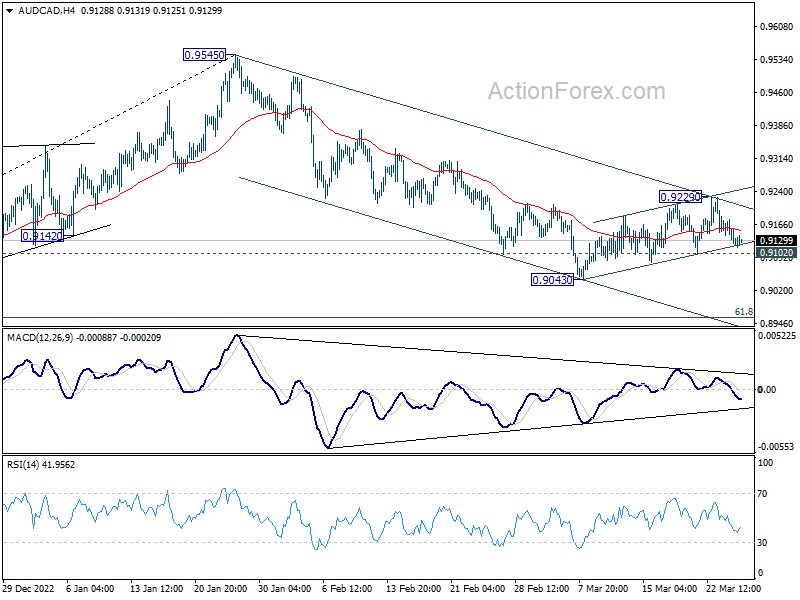
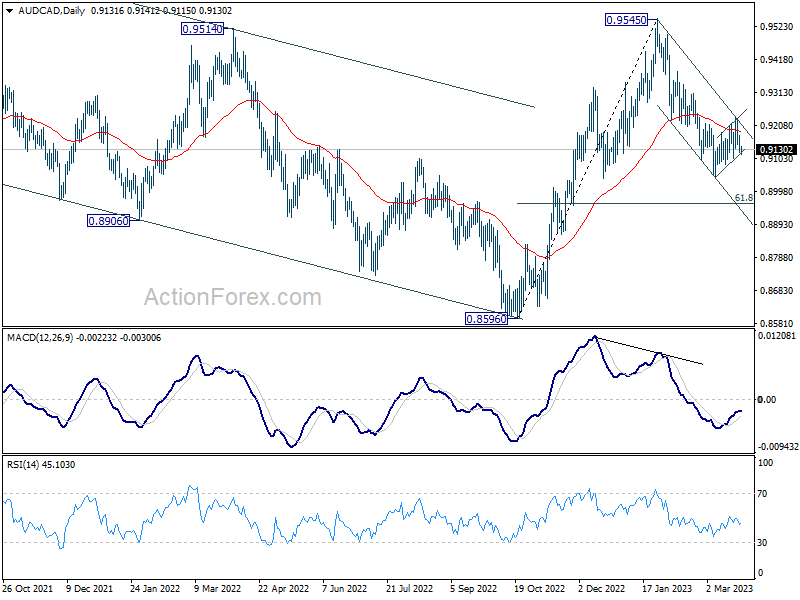
From a technical perspective, AUD/CAD is a currency pair to watch this week. The corrective recovery from 0.9043 may have reached its peak at 0.9229, after failing to break through channel resistance and 55 day EMA decisively. A break below 0.9102 minor support level could signal that decline from 0.9545 is resuming through 0.9043. In this scenario, next target would be 61.8% retracement of 0.8596 to 0.9545 at 0.8959.
Fed's Kashkari warns of recession risks amid banking sector stress
Fed President Neel Kashkari expressed concerns in a recent CBS "Face the Nation" interview about the recent stress in the banking sector, warning that it could lead to a widespread credit crunch and ultimately push the US into a recession. Kashkari stated, "What's unclear for us is how much of these banking stresses are leading to a widespread credit crunch. Would that slow down the economy? This is something that we're monitoring very, very closely."
He acknowledged that the situation is still relatively new, saying, "Right now, the stresses are only a couple of weeks old." However, Kashkari pointed out some positive signs, such as a slowdown in deposit outflows and a restoration of confidence among smaller and regional banks. He noted, "There are some concerning signs. The positive sign is deposit outflows seem to have slowed down. Some confidence is being restored among smaller and regional banks."
Despite these positive developments, Kashkari emphasized the potential risks if capital markets remain closed due to nervous borrowers and lenders, stating, "If those capital markets remain closed because borrowers and lenders remain nervous, then that would tell me, okay, this is probably going to have a bigger impact on the economy."
ECB's de Guindos on rate hikes: Data-Dependent and cautious amid banking sector uncertainty
ECB Vice President Luis de Guindos recently shared his thoughts on the central bank's approach to future rate hikes, emphasizing a data-dependent and cautious stance in light of the uncertainties arising from the financial sector problems in the US and Switzerland.
In an interview, de Guindos stated, "We raised rates by 50 basis points in March and we are open-minded with respect to the future... We are not pre-committing to any action."
The impact of the US banking system and Credit Suisse events on the Eurozone economy is a pressing concern for the ECB. Over the coming weeks and months, de Guindos noted that the central bank would need to evaluate whether these events would lead to tighter financing conditions.
The ECB Vice President acknowledged that such events increase uncertainty and may result in tighter credit standards in the Eurozone, potentially affecting the economy with lower growth and inflation. However, de Guindos explained that it is too early to determine the intensity of this factor.
Regarding the ECB's inflation target, de Guindos emphasized the importance of a timely return to 2% inflation within the two-year projection horizon and highlighted the crucial role of core inflation in achieving this goal.
He stated, "Headline inflation will decline quite rapidly over the next six to seven months as the base effects play in favor of a rapid reduction in inflation... What we want to see is a steady and clear convergence towards the 2% target. In that respect, core inflation is going to be key. It is very difficult to converge towards the 2% target in a sustainable way without a clear decline in core inflation."
Inflation Data Takes Center Stage as Central Banks Weigh Next Policy Decisions
As we head into a week highlighted by inflation data, central banks are gearing up to navigate their policy decisions based on the numbers. Australia's monthly CPI, Eurozone's CPI flash, and US PCE inflation will be under close scrutiny as monetary authorities assess their next moves.
RBA has suggested the possibility of hitting the pause button in May, but the final call will largely rest on how inflation unfolds. On the other hand, ECB is expected to proceed with tightening in May, but the ultimate peak interest rate will be influenced by the pace at which inflation decelerates.
Market participants consider Fed current 4.75-5.00% interest rate as the peak already, contrasting with Fed's own projection of 5.1%. Once again, inflation trends will be the deciding factor here.
Besides inflation, other significant economic indicators to watch this week include US consumer confidence, Japan's industrial production and retail sales, Canada's GDP, Australia's retail sales, and New Zealand's ANZ business confidence.
Here are some highlights for the week:
- Monday: Japan corporate service price index; Germany Ifo business climate: Eurozone M3 money supply.
- Tuesday: Australia retail sales; US goods trade balance, house price index; consumer confidence.
- Wednesday: Australia CPI; Germany Gfk consumer climate; Swiss Credit Suisse economic expectations; UK mortgage approvals, M4 money supply; US pending home sales.
- Thursday: New Zealand building permits, ANZ business confidence; Germany CPI flash; ECB monthly bulletin;US Q4 GDP final, jobless claims.
- Friday: Japan Tokyo CPI, industrial production, retail sales, housing starts; China PMIs; Germany import prices, retail sales; UK Q4 GDP final, current account; Swiss retail sales, KOF economic barometer; France consumer spending; Germany unemployment; Eurozone CPI, unemployment rate; Canada GDP; US personal income and spending with PCE inflation, Chicago PMI.
USD/JPY Daily Outlook
Daily Pivots: (S1) 129.93; (P) 130.43; (R1) 131.23; More...
Intraday bias in USD/JPY is turned neutral with as fall from 137.90 lost momentum after hitting 129.62. Some consolidations could be seen first. But outlook stays bearish as long as 132.99 resistance holds. Break of 129.62 will target a test on 127.20 low. Decisive break there will resume larger decline from 151.93 to 61.8% projection of 151.93 to 127.20 from 137.90 at 122.61.
In the bigger picture, rebound from 127.20 should have completed at 137.90 as a corrective move. The down trend from 151.93 (2022 high) is still in progress. Break of 127.20 will resume this down trend and target 61.8% projection of 151.93 to 127.20 from 137.90 at 122.61. This will now be the favored case as long as 137.90 resistance holds.
Economic Indicators Update
| GMT | Ccy | Events | Actual | Forecast | Previous | Revised |
|---|---|---|---|---|---|---|
| 23:50 | JPY | Corporate Service Price Index Y/Y Feb | 1.80% | 1.80% | 1.60% | |
| 08:00 | EUR | Germany IFO Business Climate Mar | 92 | 91.1 | ||
| 08:00 | EUR | Germany IFO Current Assessment Mar | 94 | 93.9 | ||
| 08:00 | EUR | Germany IFO Expectations Mar | 87.4 | 88.5 | ||
| 08:00 | EUR | Eurozone M3 Money Supply Y/Y Feb | 3.30% | 3.50% |
ECB’s de Guindos on rate hikes: Data-Dependent and cautious amid banking sector uncertainty
ECB Vice President Luis de Guindos recently shared his thoughts on the central bank's approach to future rate hikes, emphasizing a data-dependent and cautious stance in light of the uncertainties arising from the financial sector problems in the US and Switzerland.
In an interview, de Guindos stated, "We raised rates by 50 basis points in March and we are open-minded with respect to the future... We are not pre-committing to any action."
The impact of the US banking system and Credit Suisse events on the Eurozone economy is a pressing concern for the ECB. Over the coming weeks and months, de Guindos noted that the central bank would need to evaluate whether these events would lead to tighter financing conditions.
The ECB Vice President acknowledged that such events increase uncertainty and may result in tighter credit standards in the Eurozone, potentially affecting the economy with lower growth and inflation. However, de Guindos explained that it is too early to determine the intensity of this factor.
Regarding the ECB's inflation target, de Guindos emphasized the importance of a timely return to 2% inflation within the two-year projection horizon and highlighted the crucial role of core inflation in achieving this goal.
He stated, "Headline inflation will decline quite rapidly over the next six to seven months as the base effects play in favor of a rapid reduction in inflation... What we want to see is a steady and clear convergence towards the 2% target. In that respect, core inflation is going to be key. It is very difficult to converge towards the 2% target in a sustainable way without a clear decline in core inflation."
Fed’s Kashkari warns of recession risks amid banking sector stress
Fed President Neel Kashkari expressed concerns in a recent CBS "Face the Nation" interview about the recent stress in the banking sector, warning that it could lead to a widespread credit crunch and ultimately push the US into a recession. Kashkari stated, "What's unclear for us is how much of these banking stresses are leading to a widespread credit crunch. Would that slow down the economy? This is something that we're monitoring very, very closely."
He acknowledged that the situation is still relatively new, saying, "Right now, the stresses are only a couple of weeks old." However, Kashkari pointed out some positive signs, such as a slowdown in deposit outflows and a restoration of confidence among smaller and regional banks. He noted, "There are some concerning signs. The positive sign is deposit outflows seem to have slowed down. Some confidence is being restored among smaller and regional banks."
Despite these positive developments, Kashkari emphasized the potential risks if capital markets remain closed due to nervous borrowers and lenders, stating, "If those capital markets remain closed because borrowers and lenders remain nervous, then that would tell me, okay, this is probably going to have a bigger impact on the economy."
Technical Outlook and Review
DXY:
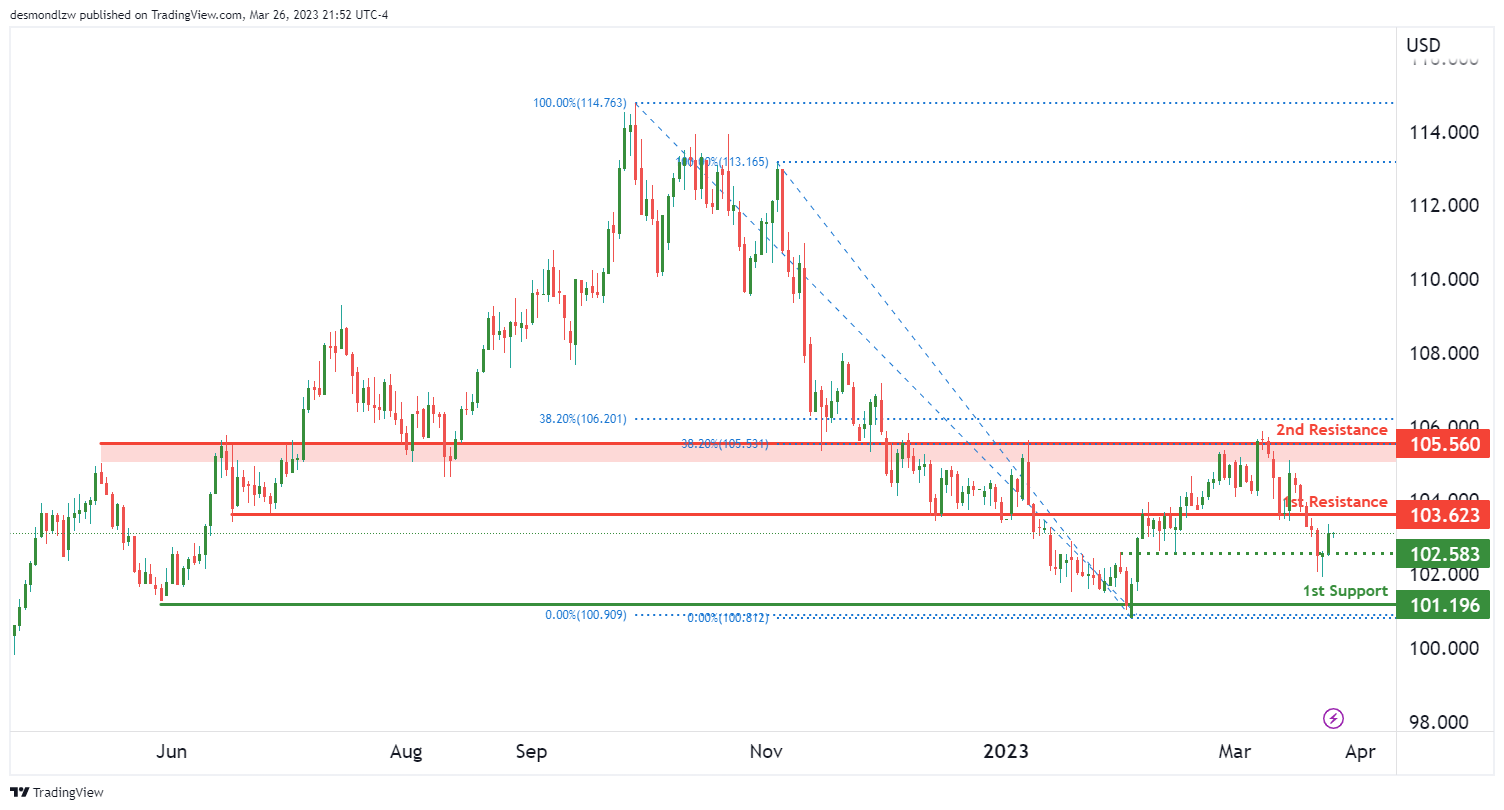
Looking at the DXY chart, the overall momentum is bullish, suggesting that prices may continue to rise. Price could potentially make a bullish continuation towards the 1st resistance level at 103.62.
On the support side, the 1st support level is at 101.19, which is a multi-swing low support level. This level has held prices up in the past, making it a strong level of buying interest. Additionally, there is an intermediate support level at 102.58, which is an overlap support level.
On the resistance side, the 1st resistance level is at 103.62, which is an overlap resistance level. If the price were to break through this resistance, it could potentially rise towards the 2nd resistance level at 105.56. This level is also an overlap resistance level and has a 38.20% Fibonacci retracement lining up with it.
EUR/USD:
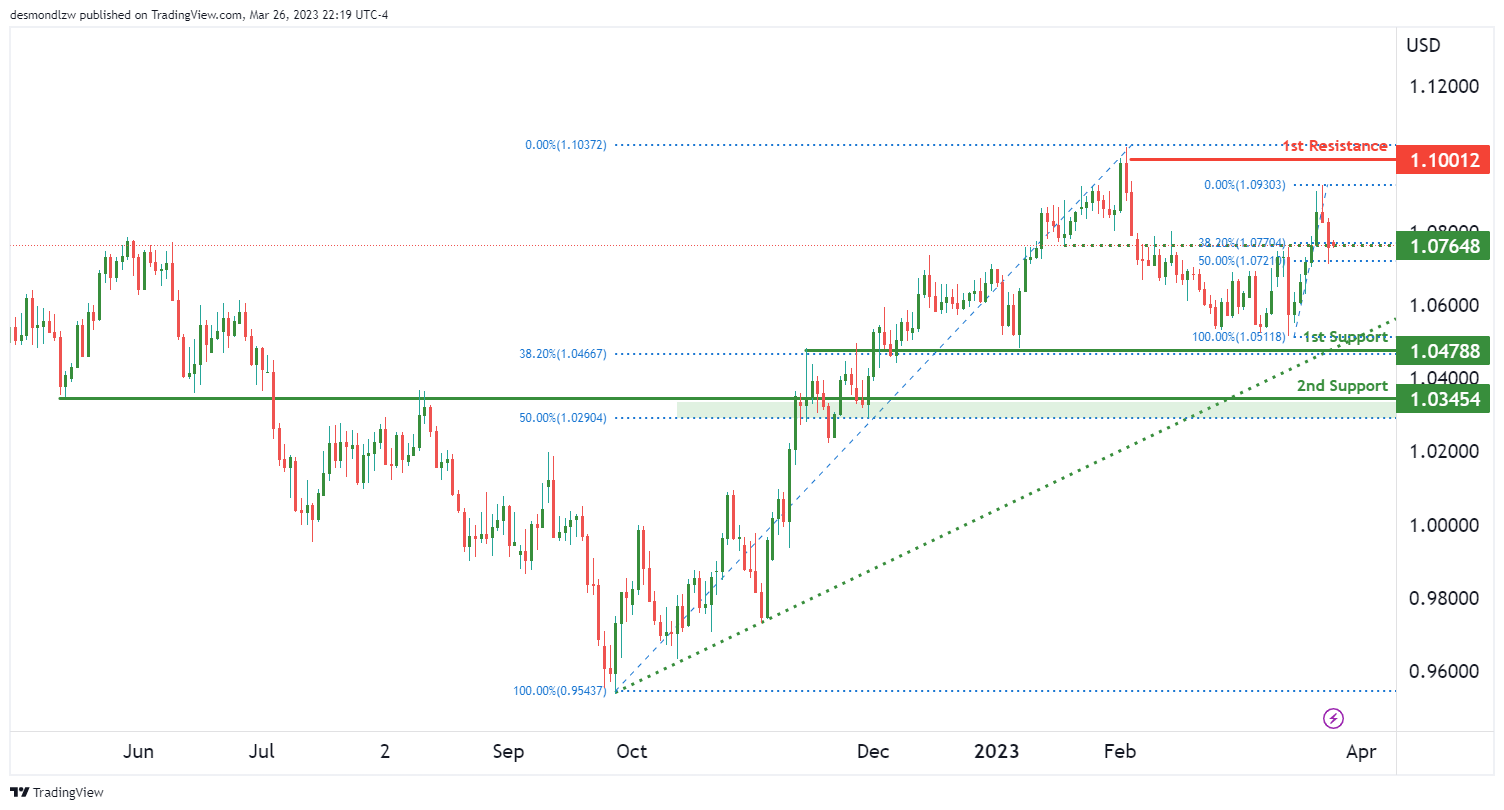
Looking at the EUR/USD chart, the overall momentum appears to be bearish. As such, price could potentially make a bearish continuation towards the 1st support level at 1.0478. This level is an overlap support and also has a 38.20% Fibonacci retracement lining up with it, which makes it a strong level of support. If the price were to break below this level, it could drop further towards the 2nd support level at 1.0345. This level is also an overlap support and has a 50% Fibonacci retracement lining up with it.
On the resistance side, the 1st resistance level is at 1.1001. This level is a swing high resistance and could provide strong selling pressure. There is also an intermediate support level at 1.0764, which is an overlap resistance and has a 38.20% Fibonacci retracement lining up with it. If the price were to break above this level, it could potentially rise towards the 1st resistance level.
GBP/USD:
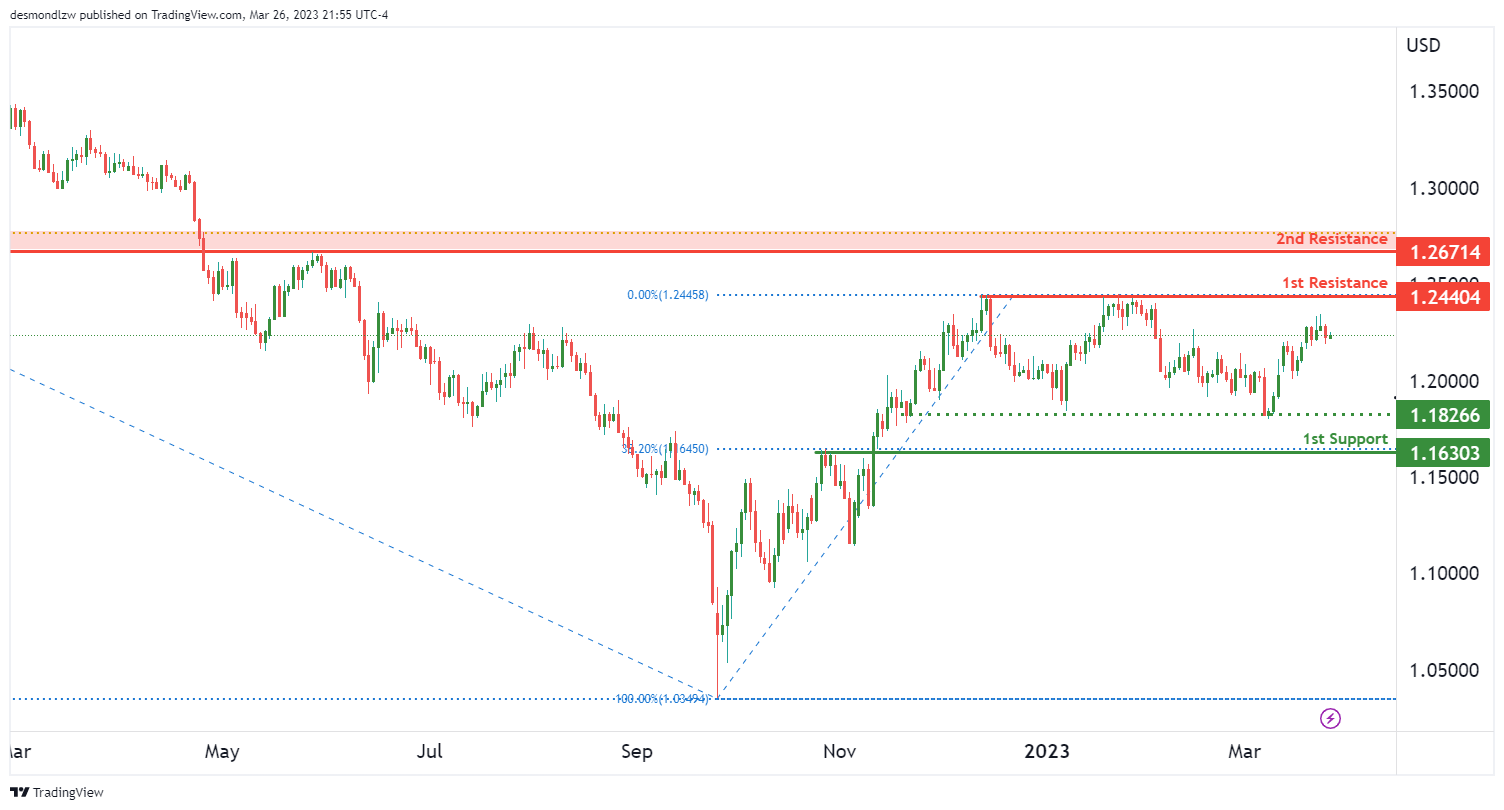
The GBP/USD chart’s overall momentum is currently neutral, suggesting that the price may fluctuate between the 1st resistance and 1st support levels.
The 1st support level is at 1.1630, and it’s an overlap support with a 38.20% Fibonacci retracement lining up with it. This level may act as a strong buying interest area. Additionally, there is an intermediate support level at 1.1826, which could act as a pullback support if price were to drop from the current level.
On the resistance side, the 1st resistance level is at 1.2440, and it’s a swing high resistance. If price were to rise from the current level, it could face selling pressure at this level. The 2nd resistance level is at 1.2671, which is also an overlap resistance.
USD/CHF:
The USD/CHF chart is currently showing bullish momentum, suggesting that prices may continue to rise. The first support level is at 0.9083, which is a swing low support level. This support level is a good level to watch as it could potentially provide a bullish bounce towards the first resistance level at 0.9428. This resistance level is an overlap resistance and has a 38.20% Fibonacci retracement lining up with it. If price were to break above this resistance level, it could potentially rise towards the second resistance level at 0.9605, which is a swing high resistance level.
On the downside, if the price were to break below the first support level at 0.9083, it could potentially drop further towards the second support level at 0.8937, which is a multi-swing low support level.
It’s worth noting that there is an intermediate resistance level at 0.9373, which could act as a pullback resistance if price were to rise from the current level. Conversely, there is an intermediate support level at 0.9230, which could act as a pullback support if price were to drop from the current level.
USD/JPY:
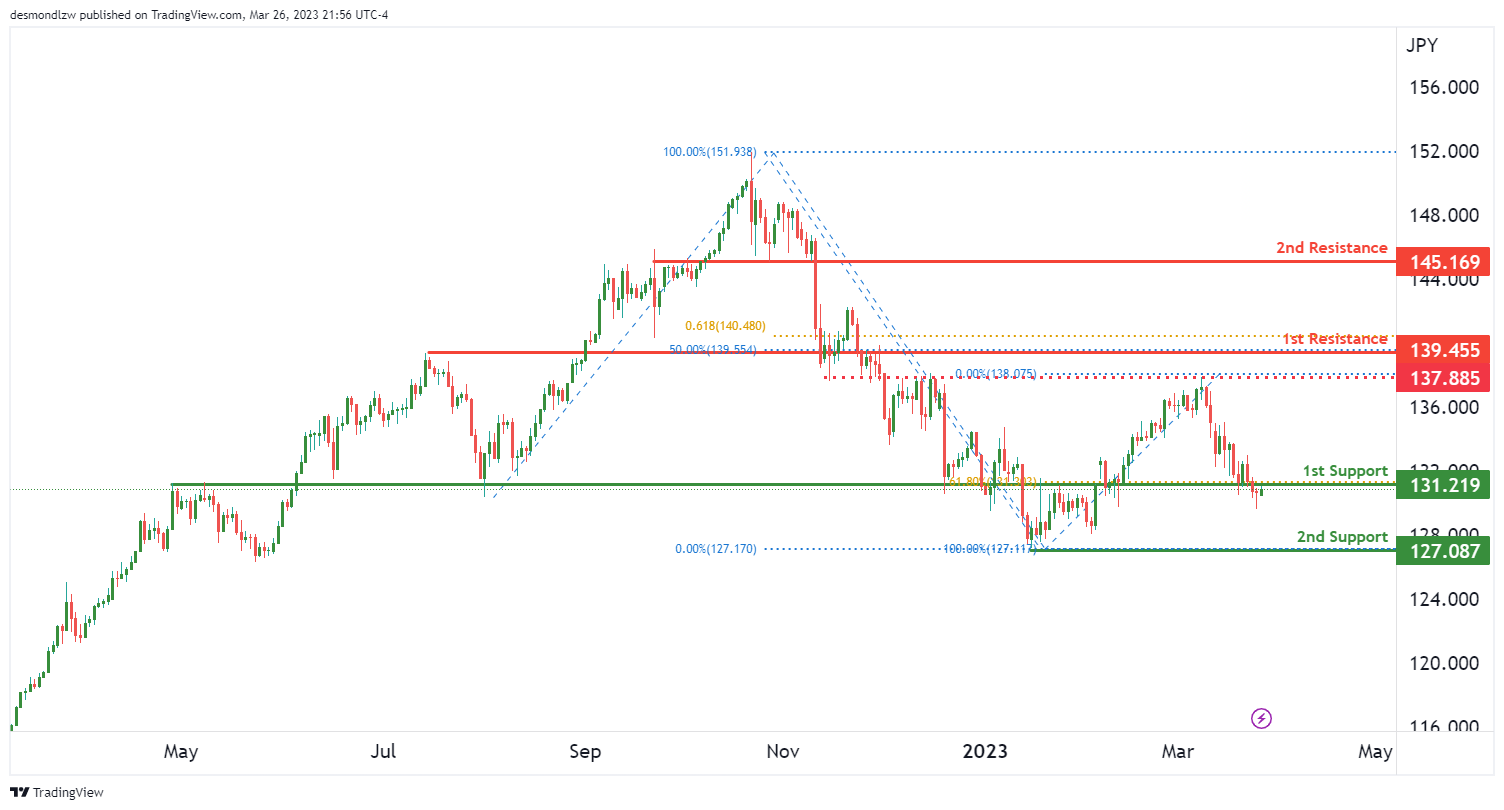
The USD/JPY chart currently shows bullish momentum, suggesting that prices may continue to rise further. The price could potentially make a bullish bounce off the 1st support level at 131.2100, which is an overlap support level and has a 61.80% Fibonacci retracement lining up with it. If the price were to bounce from this level, it could head towards the 1st resistance level at 139.4500, which is also an overlap resistance level and coincides with a 50% Fibonacci retracement.
It’s worth noting that there is an intermediate resistance level at 137.8800, which is an overlap resistance level that price could face before heading towards the 1st resistance level. On the support side, the 2nd support level at 127.0800 is a multi-swing low support level that price has bounced off multiple times in the past.
AUD/USD:
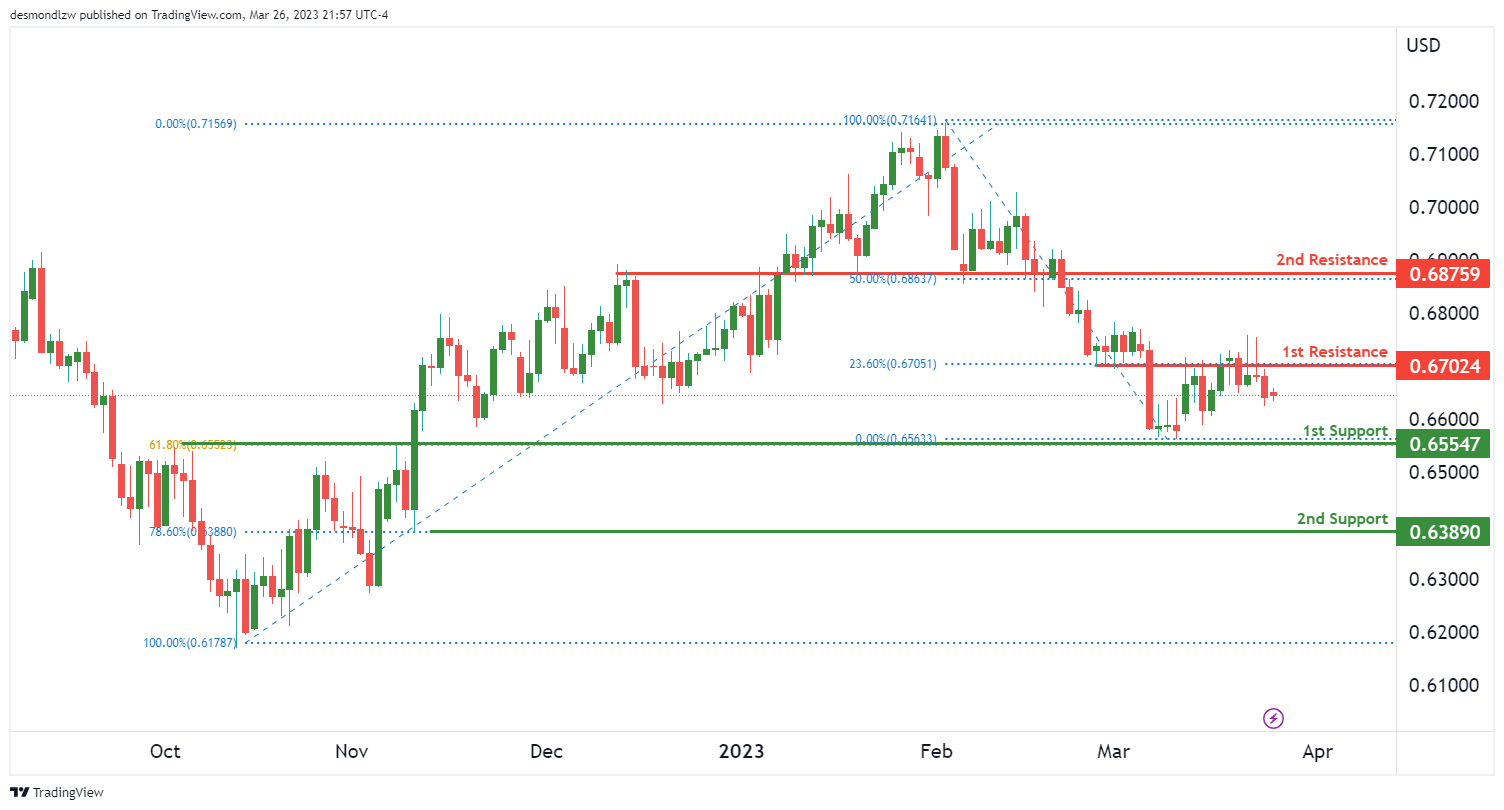
The overall momentum of the AUD/USD chart is currently bearish. This means that there is a higher likelihood of prices decreasing in the future. The price of AUD/USD could potentially make a bearish continuation towards the first support level.
The first support level is located at 0.6554, which is a strong overlap support and coincides with a 61.80% Fibonacci retracement level. This level has held as support in the past, making it a good potential target for a bounce.
If the price were to continue to drop, the second support level is located at 0.6389, which is an overlap support and lines up with a 78.60% Fibonacci retracement level. This level has also held as support in the past, further supporting its potential as a target for a bounce.
On the other hand, if the price were to increase, the first resistance level is located at 0.6702, which is an overlap resistance and coincides with a 23.60% Fibonacci retracement level. If the price were to break above this level, it could potentially push the price up towards the second resistance level at 0.6875. This level is also an overlap resistance and lines up with a 50% Fibonacci retracement level.
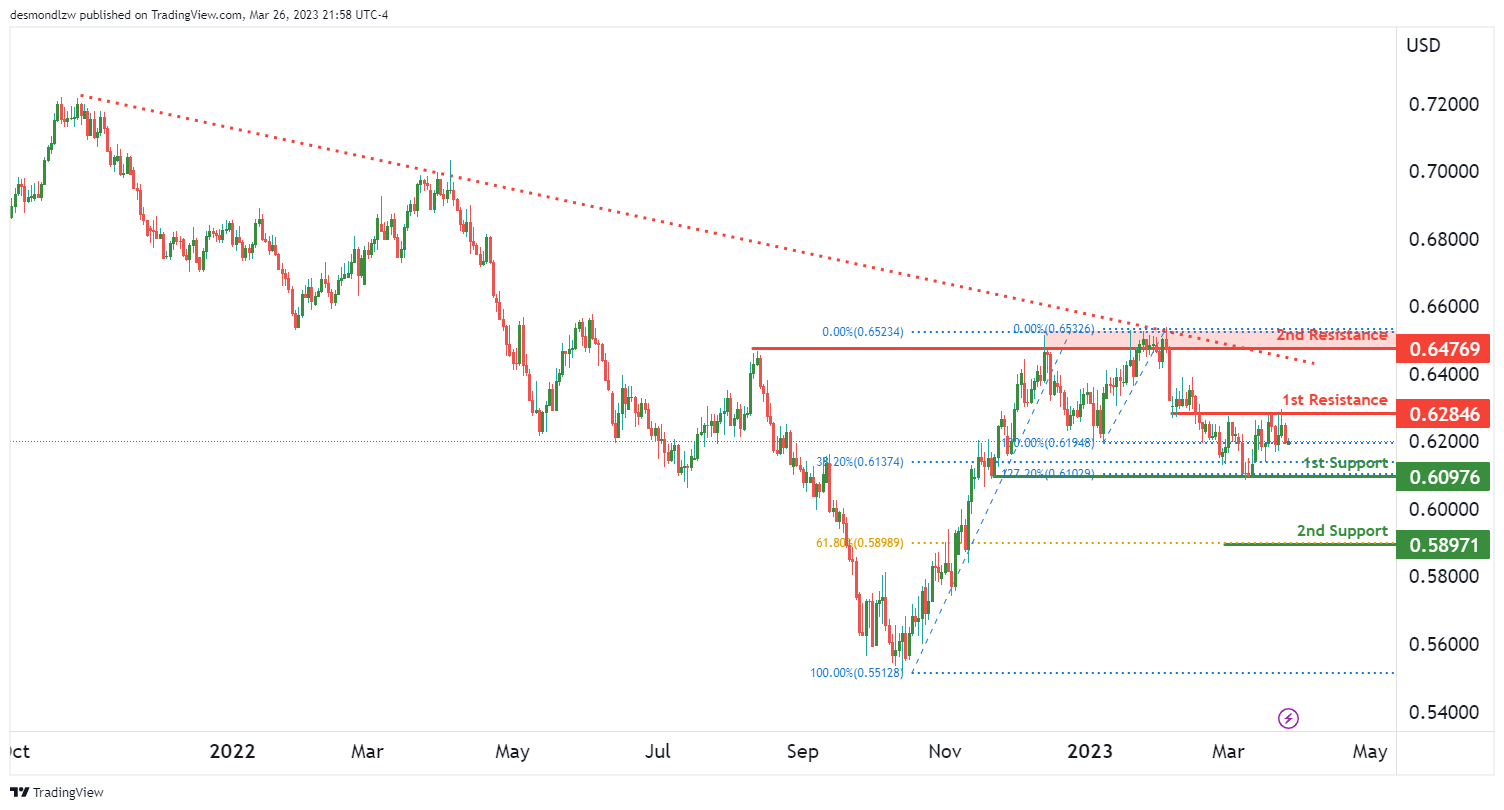
NZD/USD:
The overall momentum of the NZD/USD chart is currently neutral. As the price fluctuates between the 1st resistance and 1st support levels, it’s unclear which direction the momentum will ultimately take.
For support, the 1st support level is at 0.6097, which is a multi-swing low support level and coincides with a 38.20% Fibonacci retracement level. If the price were to drop below this level, the next level of support would be at 0.5897, which is a swing low support level and coincides with a 61.80% Fibonacci retracement level.
On the other hand, for resistance, the 1st resistance level is at 0.6284, which is an overlap resistance level. If the price were to rise above this level, the next level of resistance would be at 0.6476, which is also an overlap resistance level.
USD/CAD:
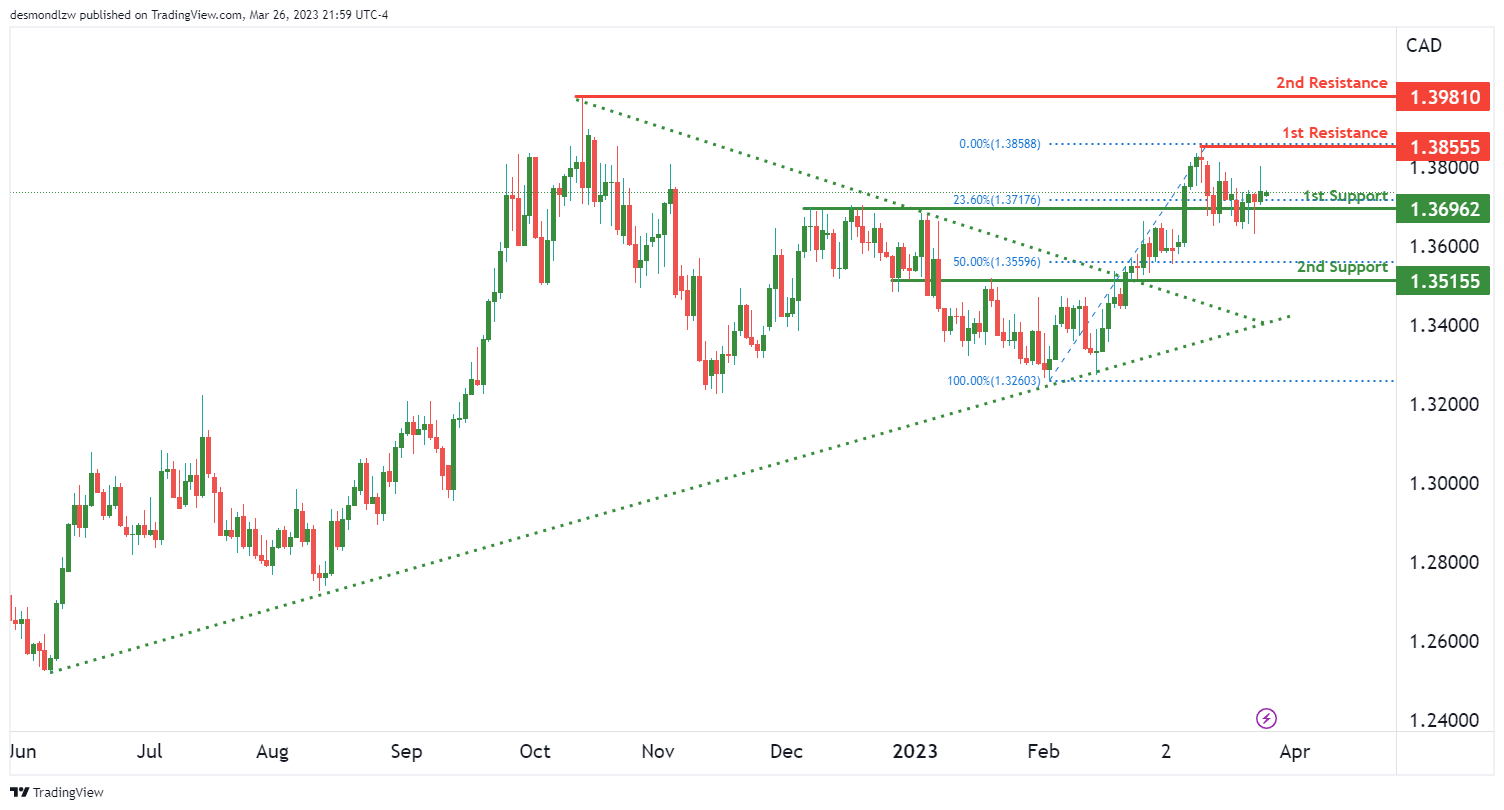
The USD/CAD chart is showing bullish momentum as the price has broken above a descending resistance line, suggesting a potential bullish move. This could potentially lead to a bullish bounce off the 1st support level towards the 1st resistance level. The 1st support level is located at 1.3696, which is an overlap support and has a 23.60% Fibonacci retracement lining up with it. The 2nd support level is at 1.3515, which is also an overlap support and coincides with a 50% Fibonacci retracement. The 1st resistance level is at 1.3855, which is a swing high resistance. Lastly, the 2nd resistance level is at 1.3981, which is another swing high resistance level. These levels could potentially act as key areas for the price to react and should be watched closely.
DJ30:
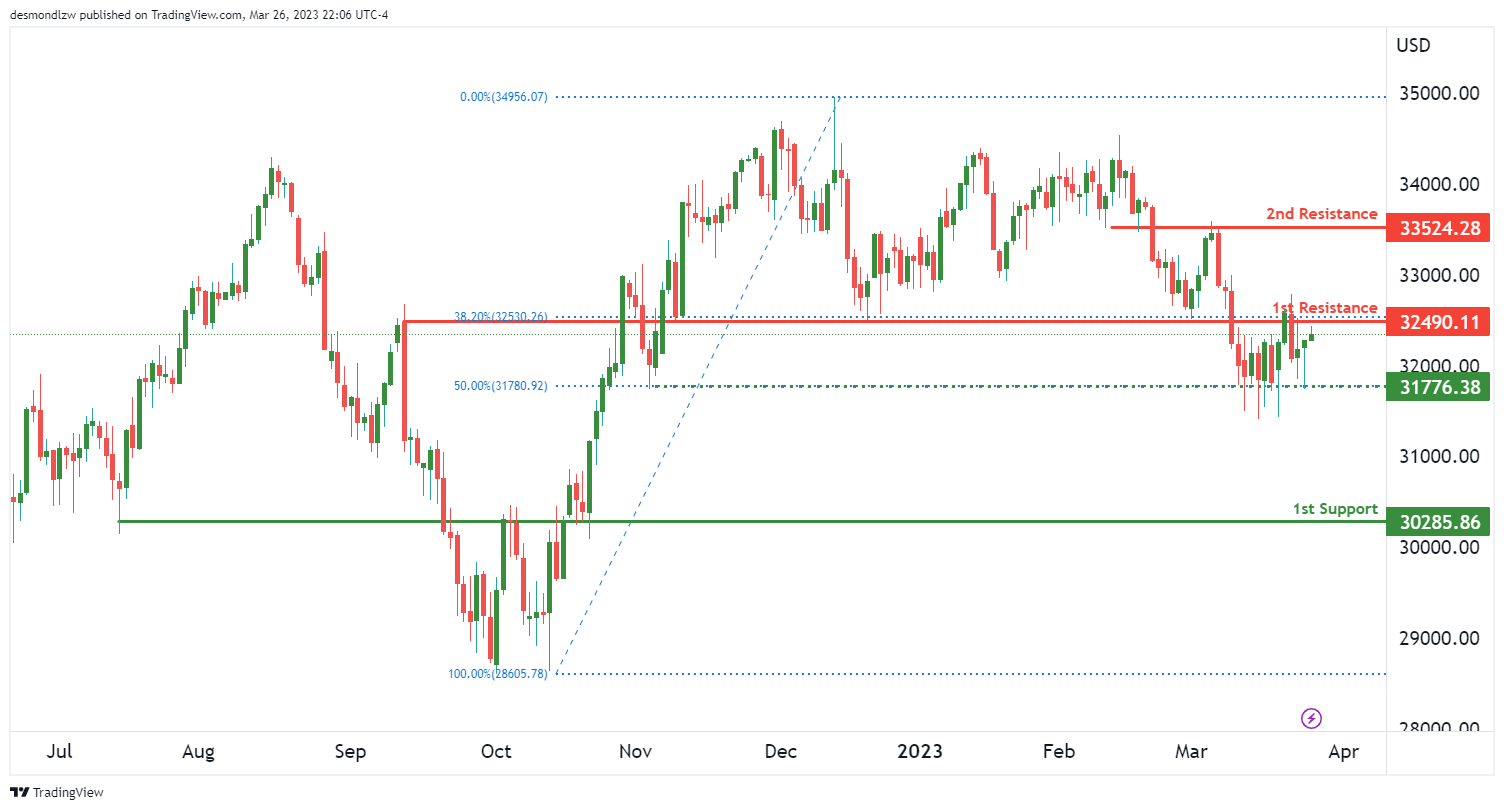
The overall momentum of the chart is bullish, indicating that we may see a continuation of an uptrend. Price could potentially make a bullish break through the first resistance and rise towards the second resistance.
The first support level is at 30285, which is an overlap support level that may provide some price support if the price were to drop. The intermediate support level is at 31776, which is a multi-swing low support level and is also at the 50% Fibonacci retracement level.
The first resistance level is at 32490, which is an overlap resistance level and is also at the 38.20% Fibonacci retracement level. If the price were to break through this resistance, it could potentially rise towards the second resistance level at 33524, which is also an overlap resistance level.
It’s worth noting that the price may fluctuate between these levels before breaking out. However, the bullish momentum suggests that there is a higher probability of a breakout towards the upside.
GER30:
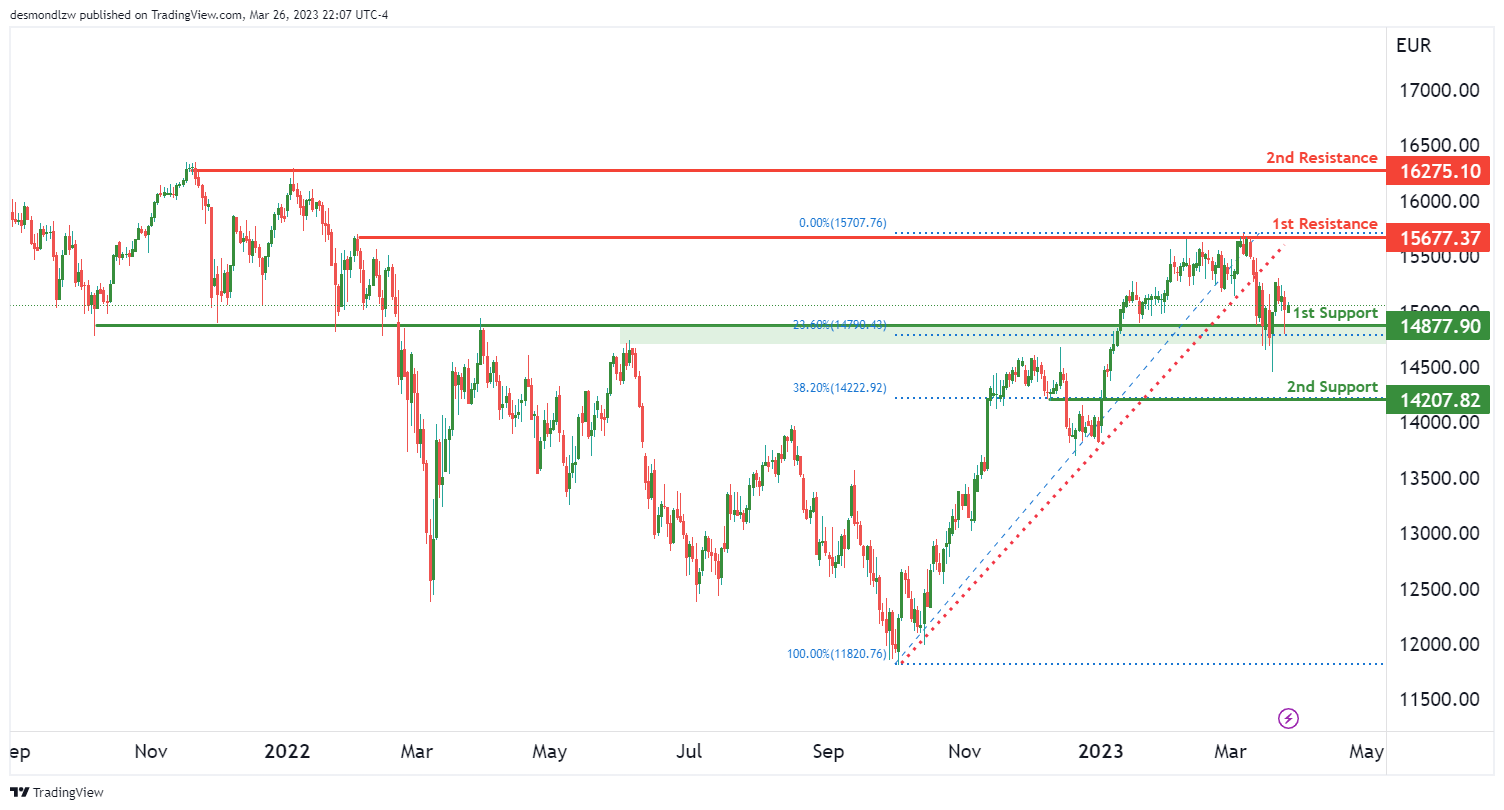
The GER30 chart is currently showing bearish momentum, as it broke below an ascending support line. The overall momentum of the chart is bearish, which suggests that the price may continue to fall.
At the moment, the price could potentially make a bearish break off the first support level at 14877 and drop towards the 2nd support level at 14207. The 1st support level is a good level as it is an overlap support level and has a 23.60% Fibonacci retracement level lining up with it. The 2nd support level is also a good level as it is an overlap support level and has a 38.20% Fibonacci retracement level lining up with it.
On the upside, the 1st resistance level at 15677 is a good level to watch as it is a swing high resistance level. The 2nd resistance level at 16275 is also a good level to watch as it is a multi-swing high resistance level.
BTC/USD:
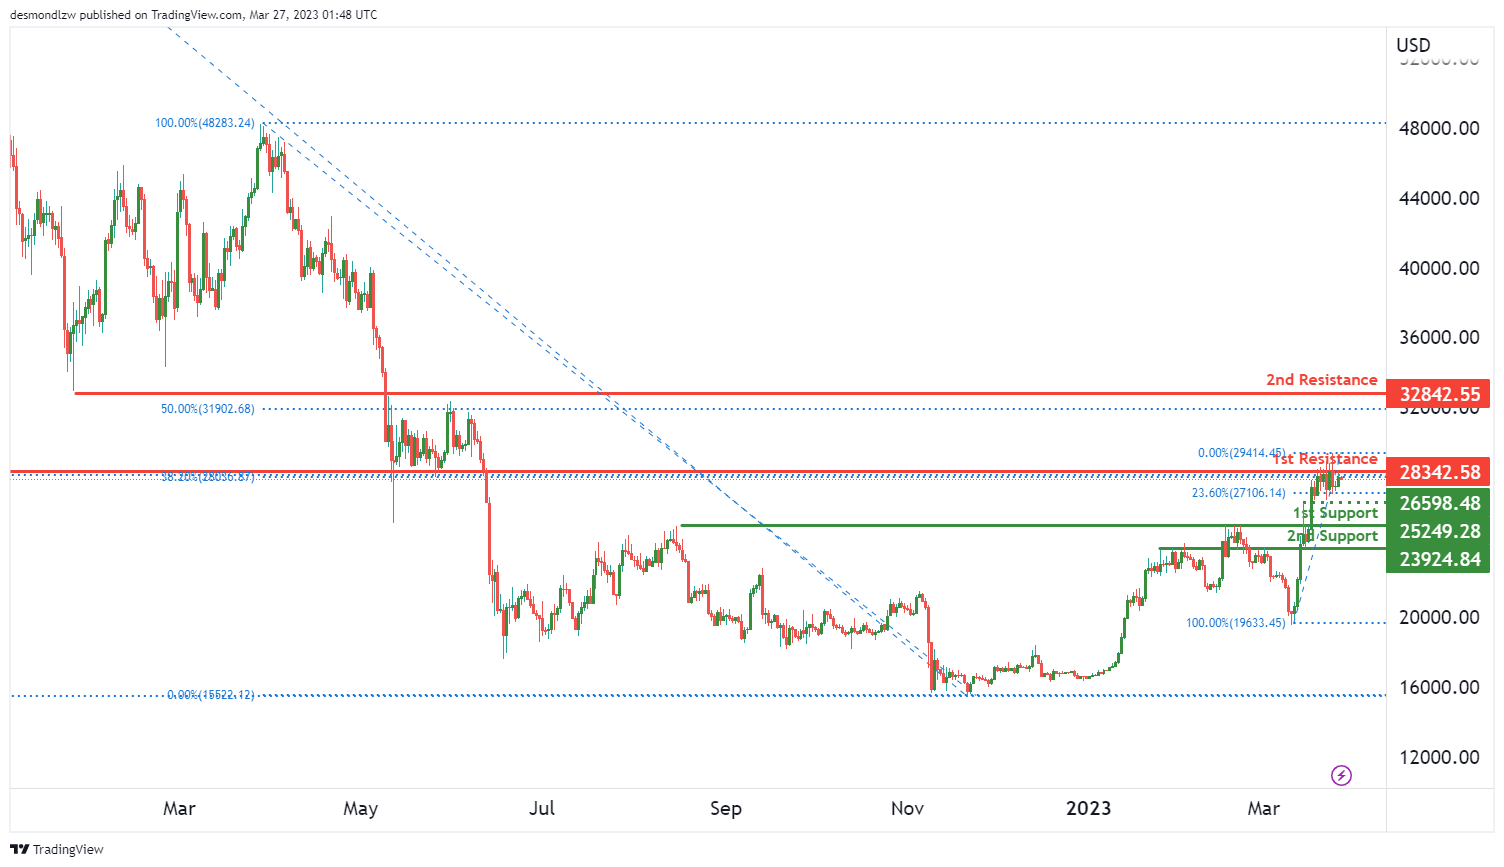
BTC/USD Shows Bearish Momentum with Potential for Drop to Support
Bitcoin has been showing bearish momentum on its chart against the US dollar, with potential for a drop to the first support level. The overall momentum of the chart is bearish, suggesting that prices may continue to fall in the near future.
At the moment, BTC/USD could potentially make a bearish reaction off the first resistance level, dropping down to the first support. The first support level is at 25249, which is an overlap support level. If prices were to break through this support, they could drop down to the second support at 23924, which is another overlap support level.
On the other hand, the first resistance level is at 28342, which is an overlap resistance level with a 38.20% Fibonacci retracement. If prices were to break through this resistance, they could rise up to the second resistance level at 32842, which is also an overlap resistance level and a 50% Fibonacci retracement.
It’s worth noting that there is an intermediate support level at 26598, which is a swing low support. If prices were to drop to this level, it could potentially trigger a rebound towards the first resistance level.
US500
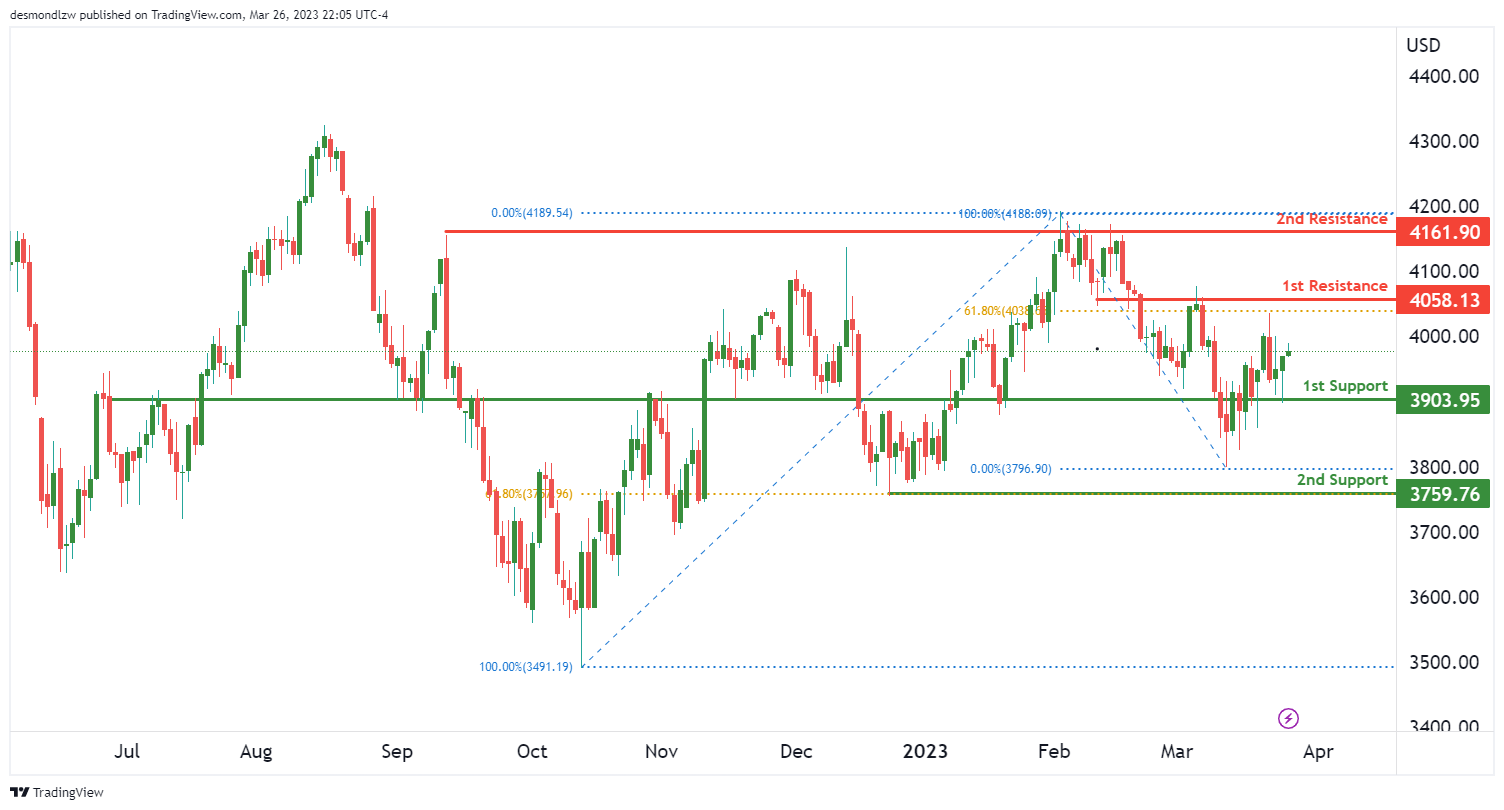
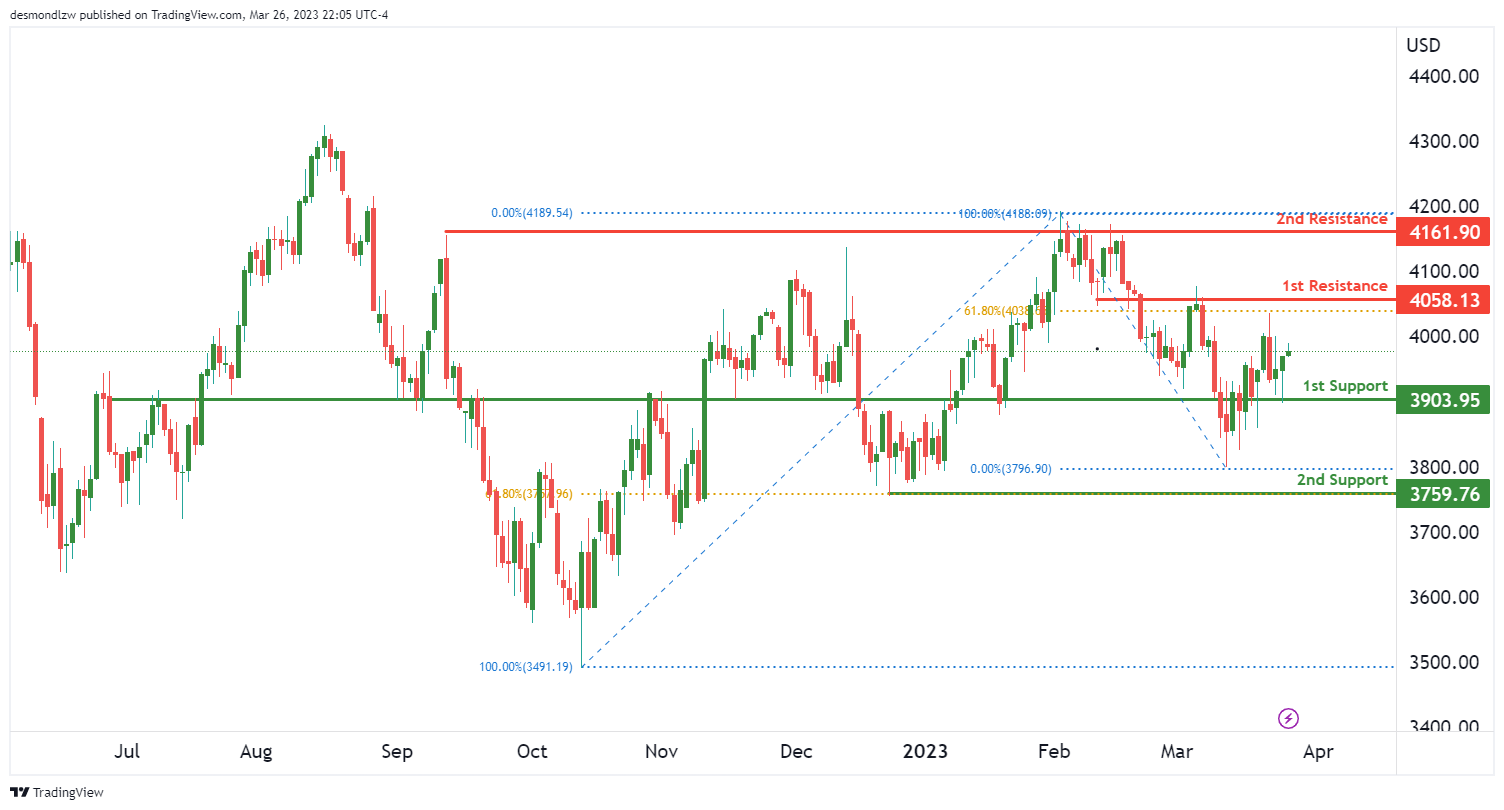
The US500 index is currently exhibiting bullish momentum, and it could potentially continue its upward trend towards the first resistance level. The first support level is at 3903.95 and it is a good level because it has acted as an overlap support in the past. The second support level at 3759.76 is also a good level because it is a swing low support and coincides with the 61.80% Fibonacci retracement level.
On the upside, the first resistance level at 4058.13 is a good level because it has acted as an overlap resistance in the past and coincides with the 61.80% Fibonacci retracement level. The second resistance level at 4161.00 is also a good level because it is a multi-swing high resistance level.
Traders should keep an eye on the price action around these levels to determine potential entry and exit points for trades. If the price breaks above the resistance levels, it could indicate further bullish momentum, while a drop below the support levels could indicate a shift to bearish momentum.
ETH/USD:
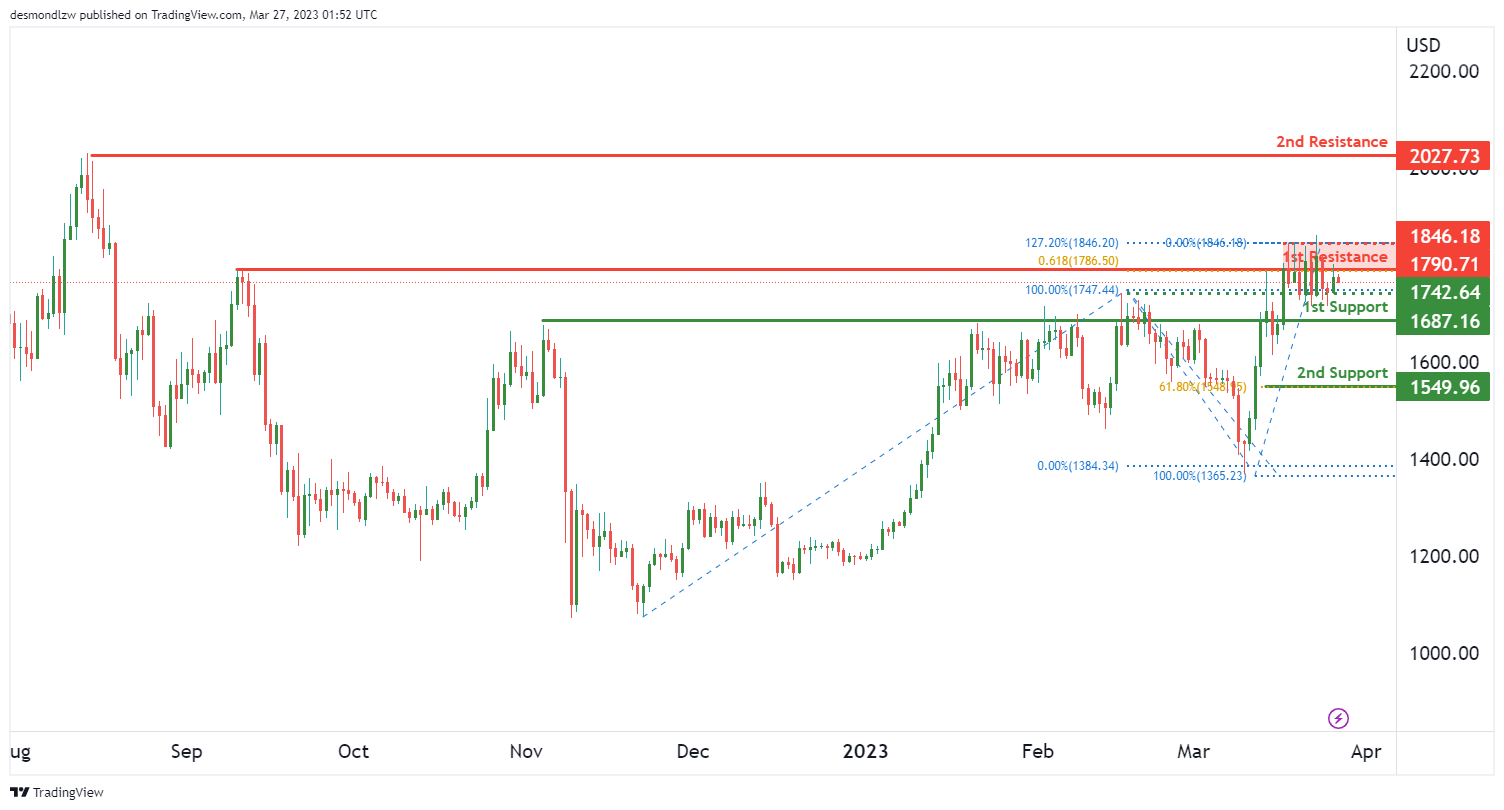
According to the analysis, the overall momentum of the ETH/USD chart is bearish. The price is expected to have a bearish reaction off the first resistance level and drop towards the first support level.
The first support level is at 1687.16 and is considered a good support level because it is an overlap support level. The second support level is at 1549.96 and is a swing low support level.
On the other hand, the first resistance level is at 1790.71 and is a swing high resistance level. The second resistance level is at 2027.73 and is a multi-swing high resistance level.
Additionally, there is an intermediate support level at 1742.64 which is an overlap support level.
WTI/USD:
WTI Oil Prices Fall Below Support as Momentum Turns Bearish
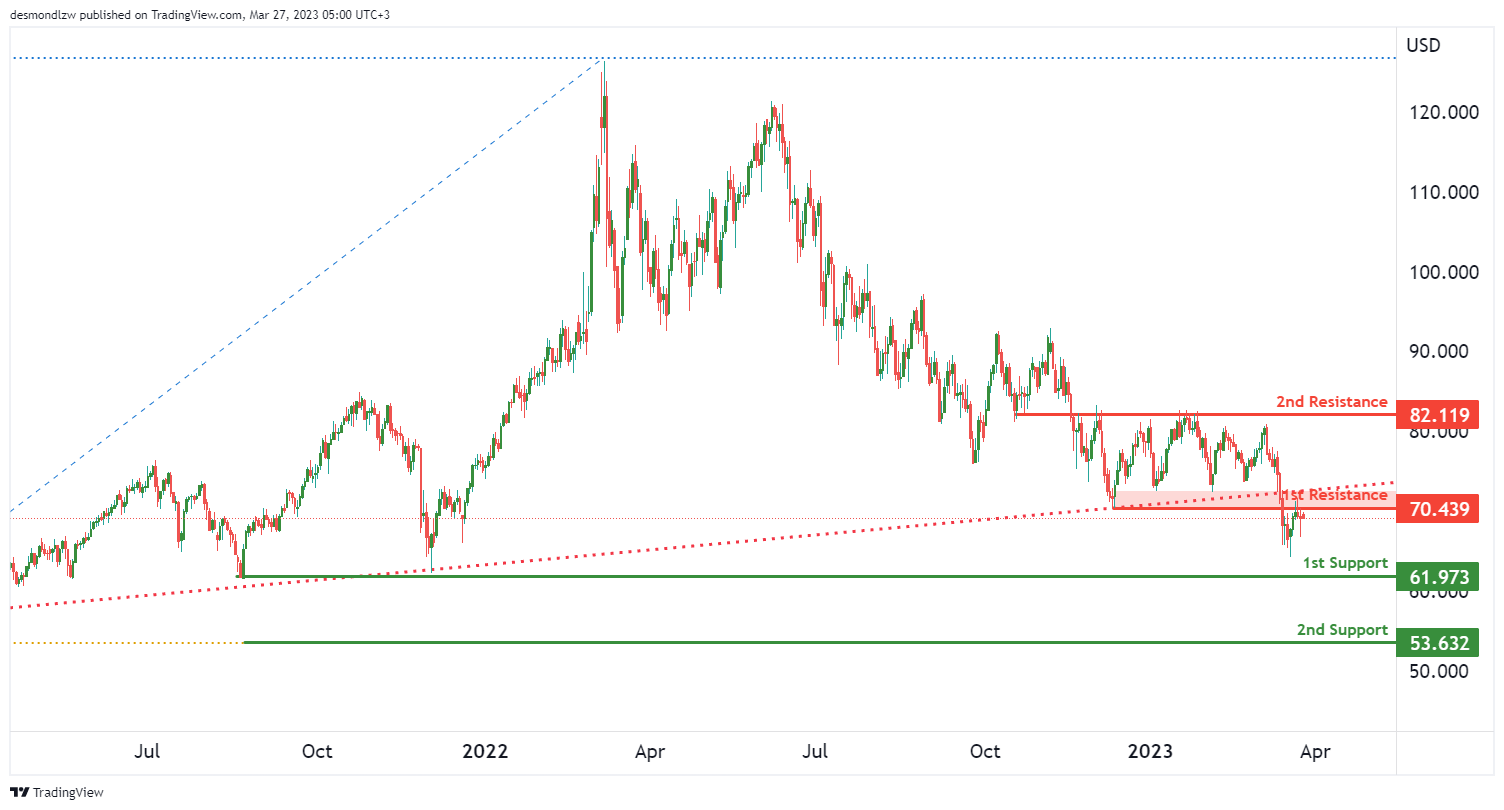
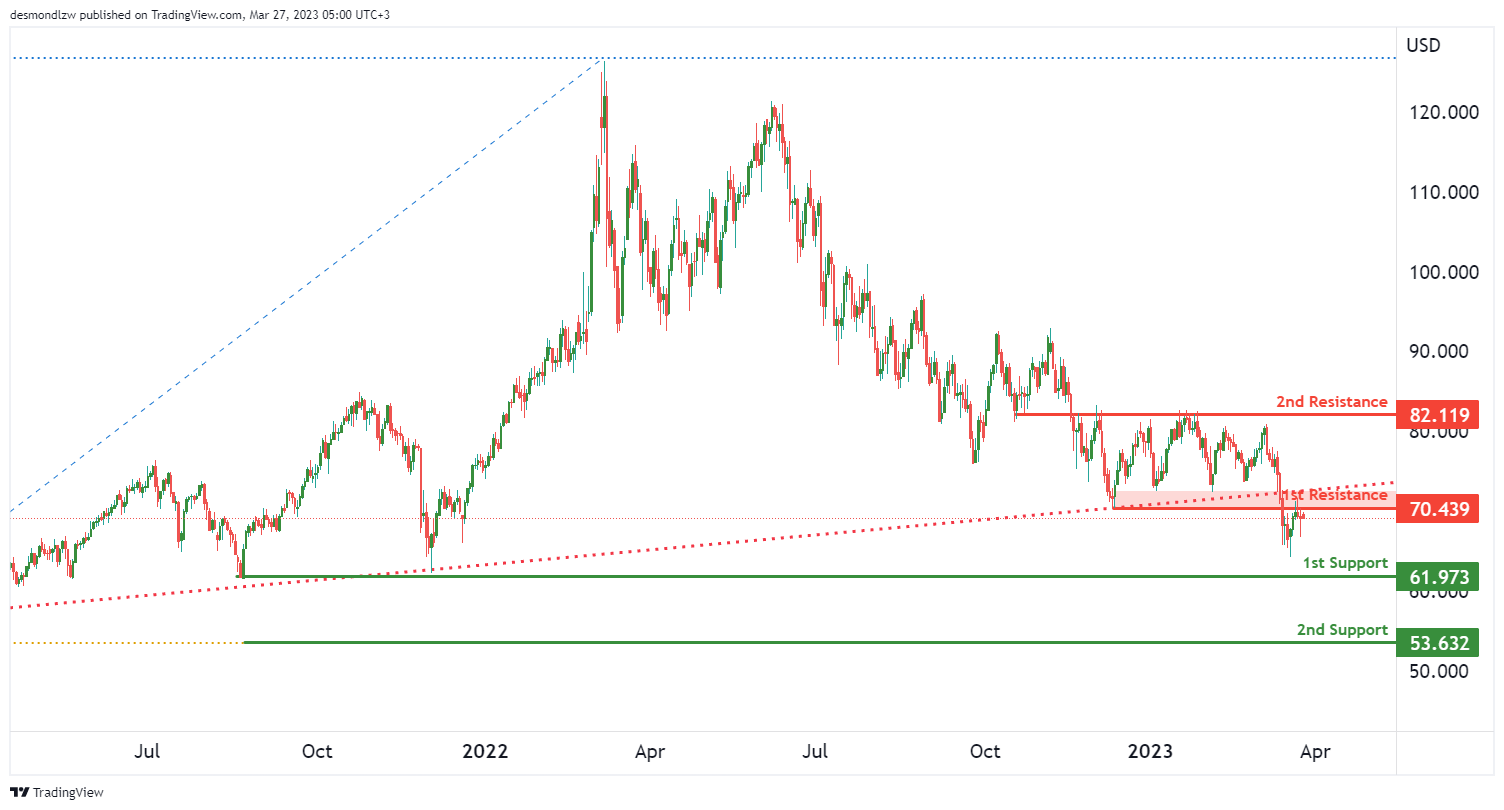
WTI oil prices have been facing bearish pressure recently, as they broke below an ascending support line on the chart. The momentum has turned negative, signalling a potential further decline in prices. The overall bias for WTI oil prices is now bearish.
Currently, prices could potentially make a bearish reaction off the first resistance level and drop to the first support level. The first support level is at 61.97, which is a swing low support. The second support level is at 53.63, which is another swing low support.
On the other hand, the first resistance level is at 70.43, which is an overlap resistance. The second resistance level is at 82.11, which is another overlap resistance.
It is important to note that the recent bearish momentum is due to the break below the ascending support line. This has triggered a potential bearish move
XAU/USD (GOLD):
The XAU/USD chart is currently showing bearish momentum, with potential for a continuation towards the first support level at 1948, which is an overlap support level. If prices were to drop further, they could reach the second support level at 1881, which is also an overlap support level and coincides with the 61.80% Fibonacci retracement level.
On the other hand, the first resistance level is at 2000, which is an overlap resistance level with a 127.20% Fibonacci extension. Breaking through this resistance could lead to a rise towards the second resistance level at 2070, which is a swing high resistance level.
It’s worth noting that the recent bearish momentum is contributing to the potential for a continuation towards the first support level.
EUR/USD Approaches Key Support, Dollar Could Resume Losses
Key Highlights
- EUR/USD started a downside correction from the 1.0930 level.
- It traded below a key bullish trend line with support at 1.0810 on the 4-hours chart.
- GBP/USD is consolidating gains above the 1.2200 support zone.
- USD/JPY extended losses below the 130.50 support zone.
EUR/USD Technical Analysis
The Euro started a major increase above the 1.0750 resistance against the US dollar. EUR/USD even climbed above 1.0900 before it started a downside correction.
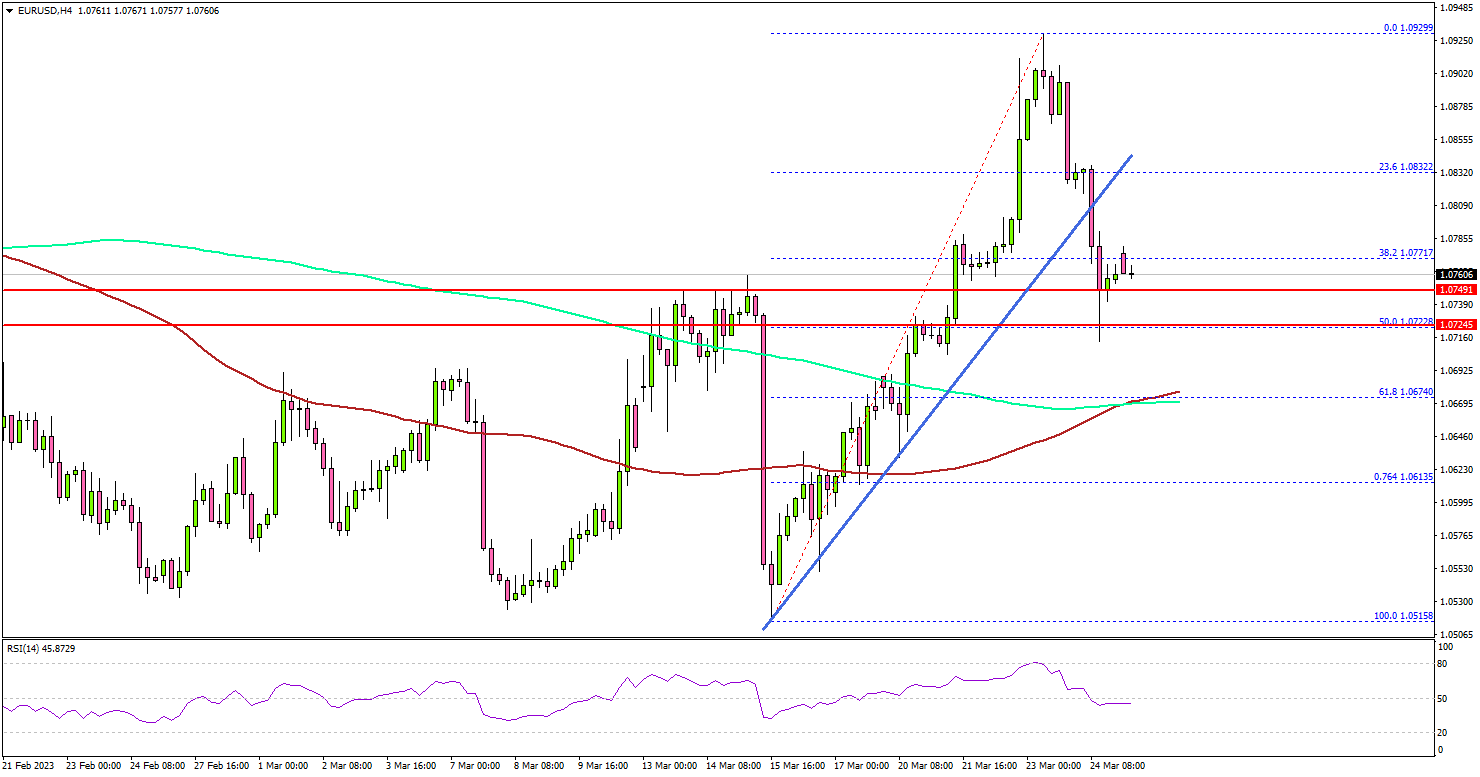
Looking at the 4-hours chart, the pair traded as high as 1.0929 before it faced sellers. There was a drop below the 1.0850 and 1.0820 support levels. The pair even traded below a key bullish trend line with support at 1.0810.
However, the pair is still above the 100 simple moving average (red, 4-hours) and the 200 simple moving average (green, 4-hours). On the downside, an immediate support is near the 1.0750.
The next major support is near the 1.0720 level, below which there is a risk of a move towards the 100 simple moving average (red, 4-hours). Any more losses might open the doors for a fresh decline towards the 1.0520 level.
An immediate resistance on the upside is near the 1.0820 level. The first major resistance is near the 1.0850 level. The next major resistance is near the 1.0865.
A clear move above the 1.0865 resistance might send the pair towards the 1.0920 zone. Any more gains might send the pair towards 1.0980 or even 1.1000.
Looking at GBP/USD, the pair is holding gains above the 1.2200 level and might attempt a fresh increase in the near term.
Economic Releases
- German IFO Business Climate Index for March 2023 – Forecast 90.9, versus 91.1 previous.
- German IFO Current Assessment Index for March 2023 - Forecast 94.1, versus 93.9 previous.
Overseas Buyers Scoop Up U.S. Shares (Bullish or Bearish)?
"No crowd buys stocks of other countries intelligently"
The fact that investors from other countries are feverishly buying U.S. stocks might seem like a bullish sign.
On the other hand, consider what Robert Prechter said in his book, Prechter's Perspective:
No crowd buys stocks of other countries intelligently. For decades, heavy foreign buying in the U.S. stock market has served as an excellent indicator of major tops.
Some of the heaviest foreign buying -- whether it's in the U.S. or another country -- tends to occur when a trend is near or at an end.
Looking at an example: In the late 1980s, after years on the sidelines, foreigners became net buyers of Japanese stocks. This coincided with the ending phase of one of the biggest bull markets in history.
Returning to the U.S. but sticking with roughly that same period of history, here’s what the Sept. 2000 Elliott Wave Financial Forecast, a monthly Elliott Wave International publication which covers 50-plus financial markets, had to say as it showed this chart:

This chart of the Dow and foreigners' net purchases of U.S. equities illustrates how beautifully the pattern has held through the U.S. bull market of the 1990s. The solid lines show the flood of foreign buyers within a month of each high, and the dotted lines show them rushing back out again on the months of the big lows. Early in the decade, when stocks were a bargain, foreigners were net sellers. They did not sustain net purchases until the Dow crossed 8000 in 1997.
By the way, overseas buyers also zealously bought U.S. shares right before the 2007 top.
As a quick reminder, the reason for mentioning all of this is what I said at the outset about feverish overseas buying of U.S. shares presently. Here are more details via this chart and commentary from our March Financial Forecast:

Foreigners are surging back into U.S. equities. At $42.9 billion in November, the latest reading of foreign purchases is higher than both the 2000 and 2007 buying extremes. It is shy of the December 2020 record of $78.6 billion, but if foreigners flocked to U.S. stocks the way retail investors did in January, we may find that when the latest readings are released, foreign purchases will be at a new record.
One way to utilize the foreign buying (or, selling) indicator is with the Elliott wave model.
If you’re unfamiliar with Elliott wave analysis, or simply need a refresher on the subject, check out EWI’s FreePass for a Changed World event – thru March 31.
FreePass for a Changed World will give you an in-depth look at the analysis you can use to anticipate changes in inflation, interest rates and every other major category of investment concern.
Subscribers gladly pay $97 per month to get the market forecasts you'll get for free in FreePass for a Changed World. But for FreePass, there's no credit card required and zero strings attached.
Risks have changed. Opportunities have changed. The world has changed, in very real ways.
Join FreePass for a Changed World now and find out what your new strategies must include.
This article was syndicated by Elliott Wave International and was originally published under the headline Overseas Buyers Scoop Up U.S. Shares (Bullish or Bearish)?. EWI is the world's largest market forecasting firm. Its staff of full-time analysts led by Chartered Market Technician Robert Prechter provides 24-hour-a-day market analysis to institutional and private investors around the world.
EUR/USD Weekly Outlook
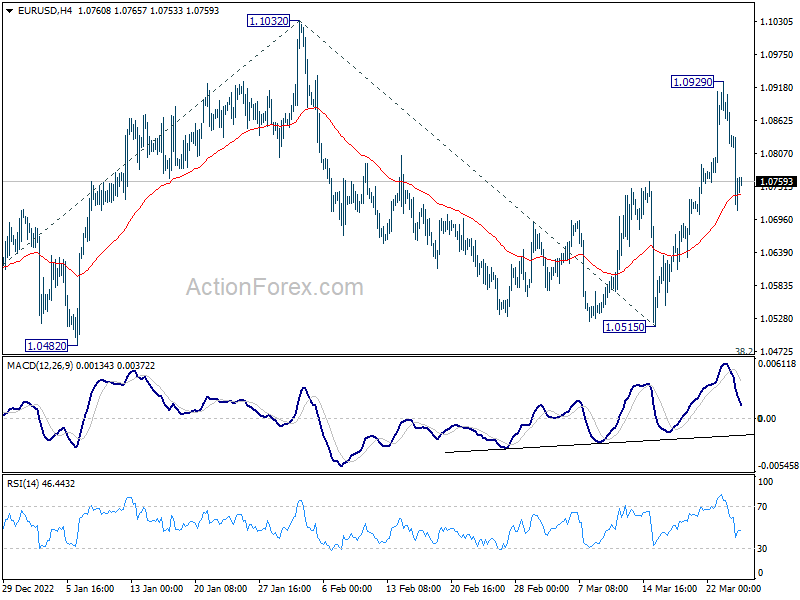
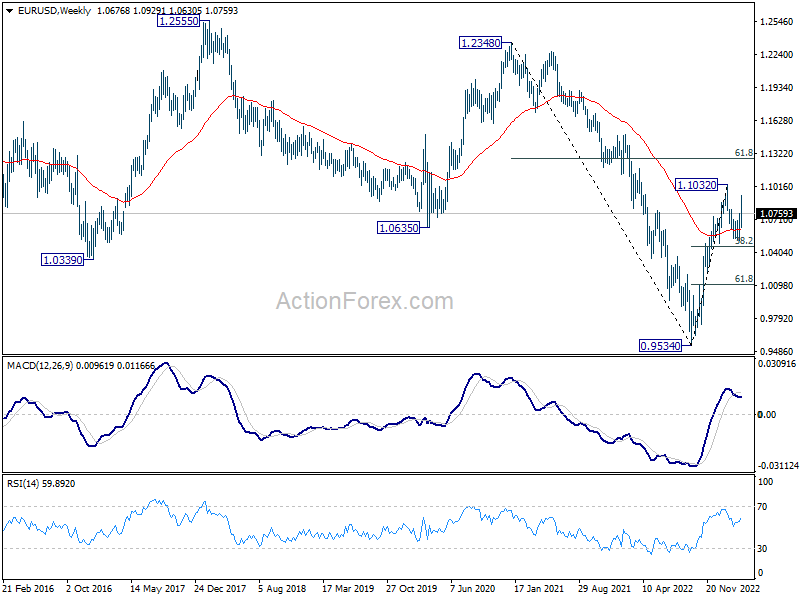
EUR/USD rebounded strongly to 1.0929 last week but retreated since then. Initial bias remains neutral this week first. On the upside, break of 1.0929 will target 1.1032 high. Firm break there will resume larger up trend from 0.9534 to 1.1273 fibonacci level next. However, firm break of 4 hour 55 EMA (now at 1.0738) will likely extend the corrective pattern from 1.1032 and bring deeper decline back towards 1.0515.
In the bigger picture, rise from 0.9534 (2022 low) is in progress with 38.2% retracement of 0.9534 to 1.1032 at 1.0460 intact. The strong support from 55 week EMA (now at 1.0623) was also a medium term bullish sign. Next target is 61.8% retracement of 1.2348 (2021 high) to 0.9534 at 1.1273. Sustained break there will solidity the case of bullish trend reversal and target 1.2348 resistance next (2021 high).
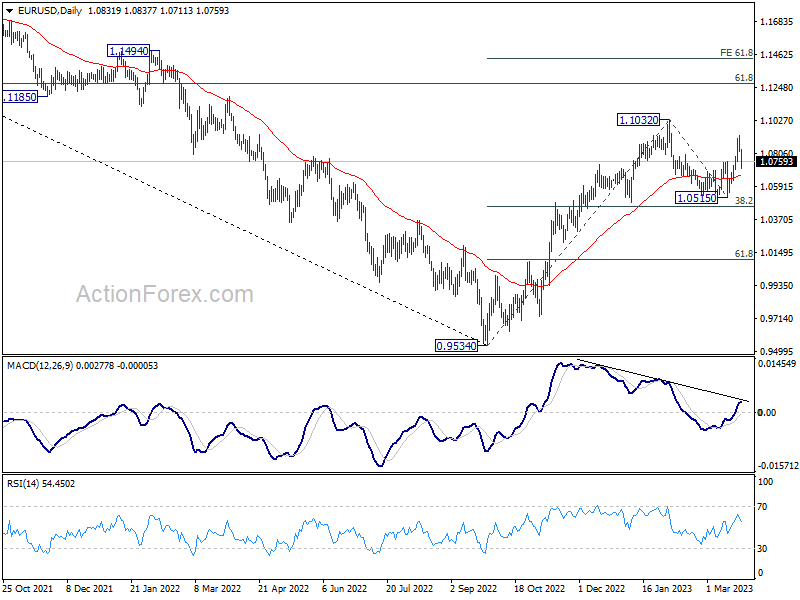
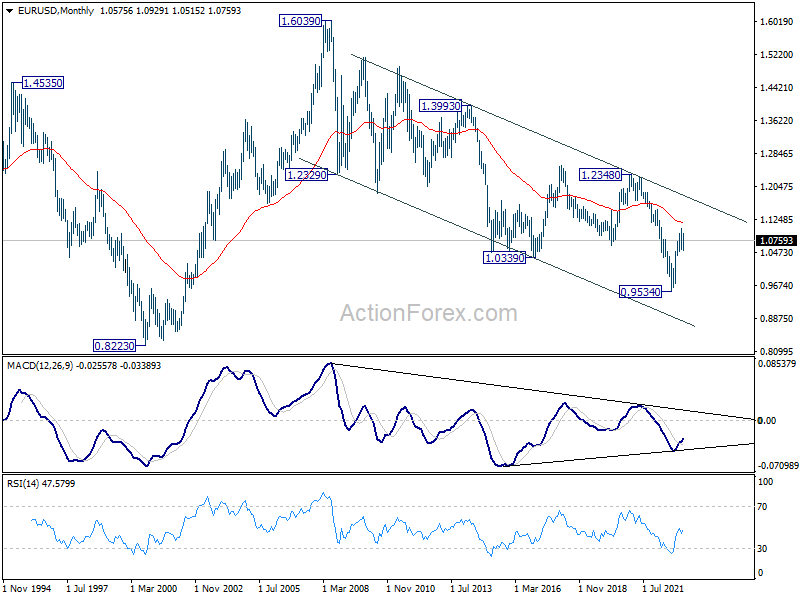
In the long term picture, while it's too early to call for long term trend reversal at this point, the strong break of 1.0635 support turned resistance (2020 low) should at least turn outlook neutral. Focus will turn to 55 month EMA (now at 1.1166). Rejection by this EMA will revive long term bearishness.
USD/JPY Weekly Outlook
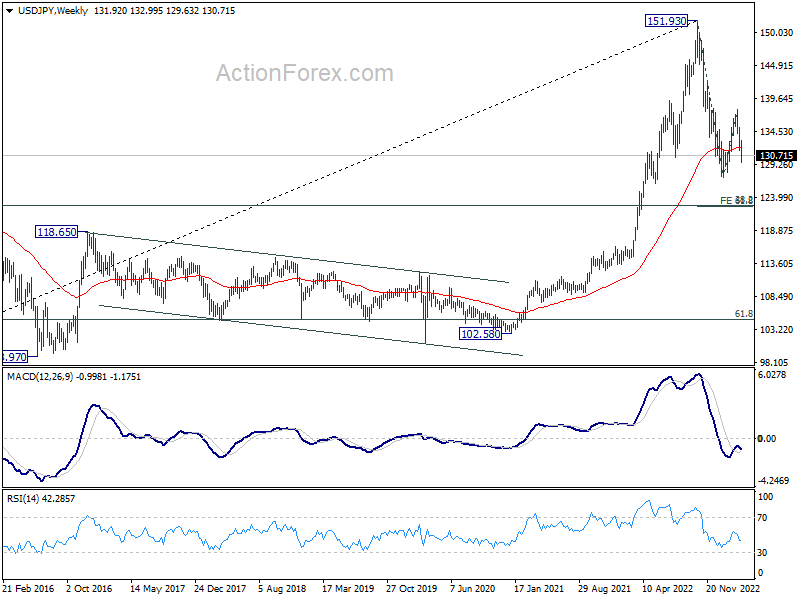
USD/JPY's fall from 137.90 continued last week and hit as low as 129.63. Further decline is expected this week as long as 132.99 resistance holds, for retesting 127.20 low. Decisive break there will resume larger decline from 151.93 to 61.8% projection of 151.93 to 127.20 from 137.90 at 122.61.
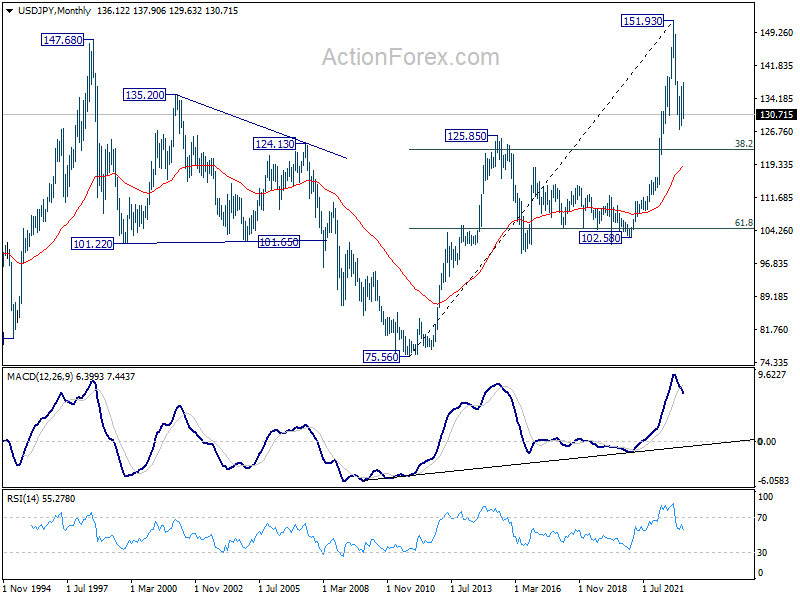
In the bigger picture, rebound from 127.20 should have completed at 137.90 as a corrective move. The down trend from 151.93 (2022 high) is still in progress. Break of 127.20 will resume this down trend and target 61.8% projection of 151.93 to 127.20 from 137.90 at 122.61. This will now be the favored case as long as 137.90 resistance holds.
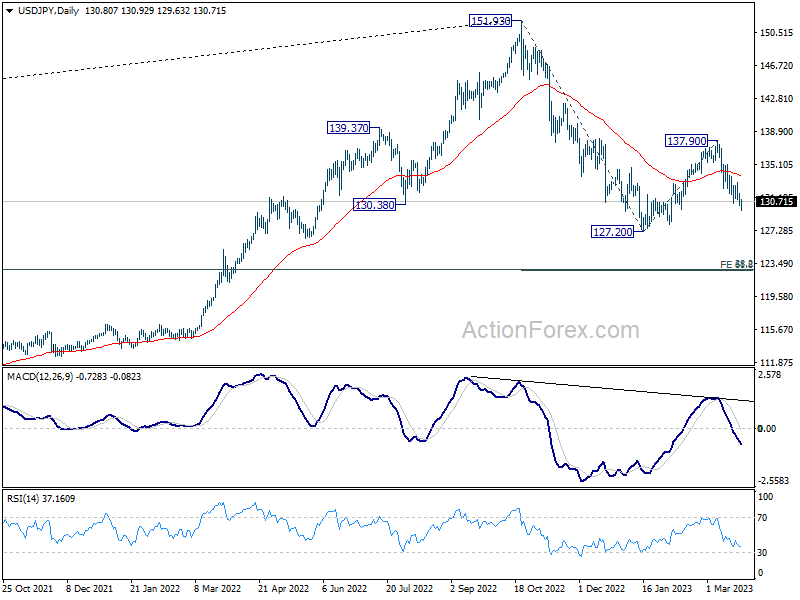
In the long term picture, price action from 151.93 is seen as developing into a corrective pattern to up trend from 75.56 (2011 low). While deeper decline cannot be ruled out, downside should be contained by 38.2% retracement of 75.56 to 151.93 at 122.75.