Sample Category Title
Japan PMI manufacturing dropped to 51 in Aug, services down to 49.2
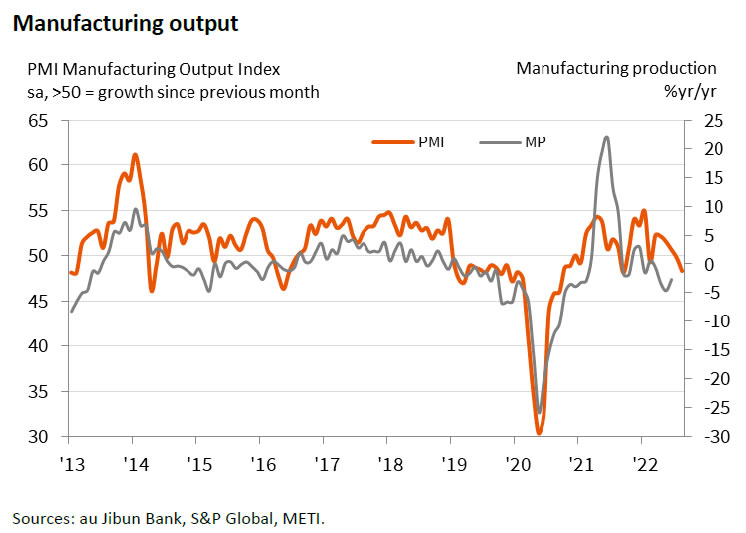
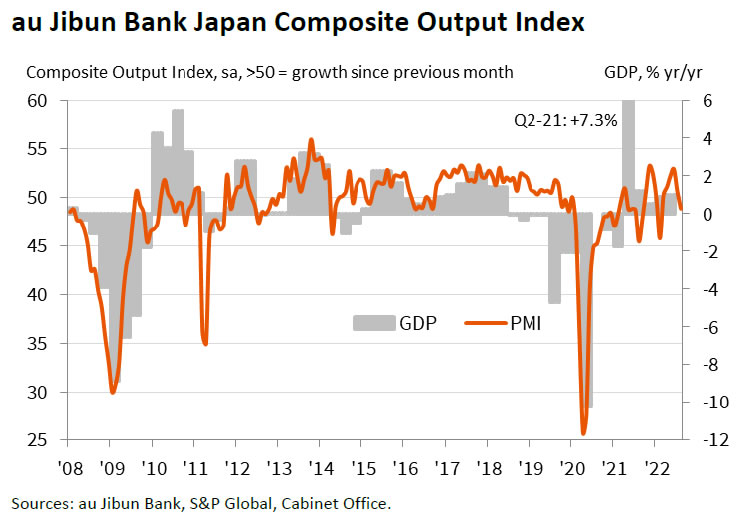
Japan PMI Manufacturing dropped from 52.1 to 51.0 in August, below expectation of 51.8. PMI Manufacturing Output dropped from 49.7 to 48.3. That's also the lowest level in 19 months. PMI Services dropped from 50.3 to 49.2, first contraction since March. PMI Composite dropped from 50.2 to 48.9, first contraction since February.
Usamah Bhatti, Economist at S&P Global Market Intelligence, said: "The latest Flash PMI data showed that Japanese private sector activity declined for the first time since February midway through the third quarter. Both manufacturing and services companies recorded a contraction in output in August, with the former falling at the fastest pace for 11 months.
"August data signalled the second-weakest reading in the composite index so far this year, though the rate of deterioration was only mild. Of concern was the amount of new business received by private sector firms, which reduced for the first time in six months and pointed to further weaknesses to come."
Australia PMI composite output dropped to 49.8, a renewed contraction
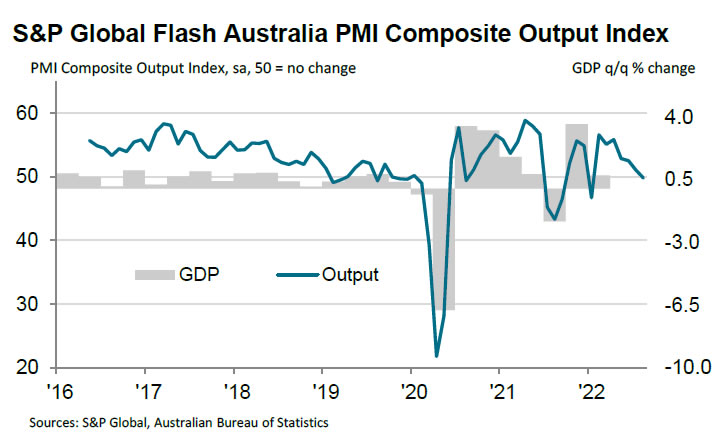
Australia PMI Manufacturing dropped from 55.7 to 54.5 in August, a 12-month low. PMI Services dropped from 50.9 to 49.6, a 7-month low. PMI Composite Output dropped from 51.1. to 49.8, a 7-month low.
Laura Denman, Economist at S&P Global Market Intelligence said: "A renewed contraction in Australia's private sector economy indicates that recent interest rate hikes made by the RBA, as well as sustained inflationary pressures, have begun to take a toll on overall demand levels.
"Should new order growth remain subdued, this may help reduce demand-pull inflation factors, but survey data continue to highlight the supply issues that remain prevalent globally, which will continue to keep price levels elevated for the foreseeable.
"As such, the RBA will likely continue along its rate-hiking path, which bodes ill for the wider economy given the latest survey data highlight clear signs of underlying weakness."
Technical Outlook and Review
USD/JPY:
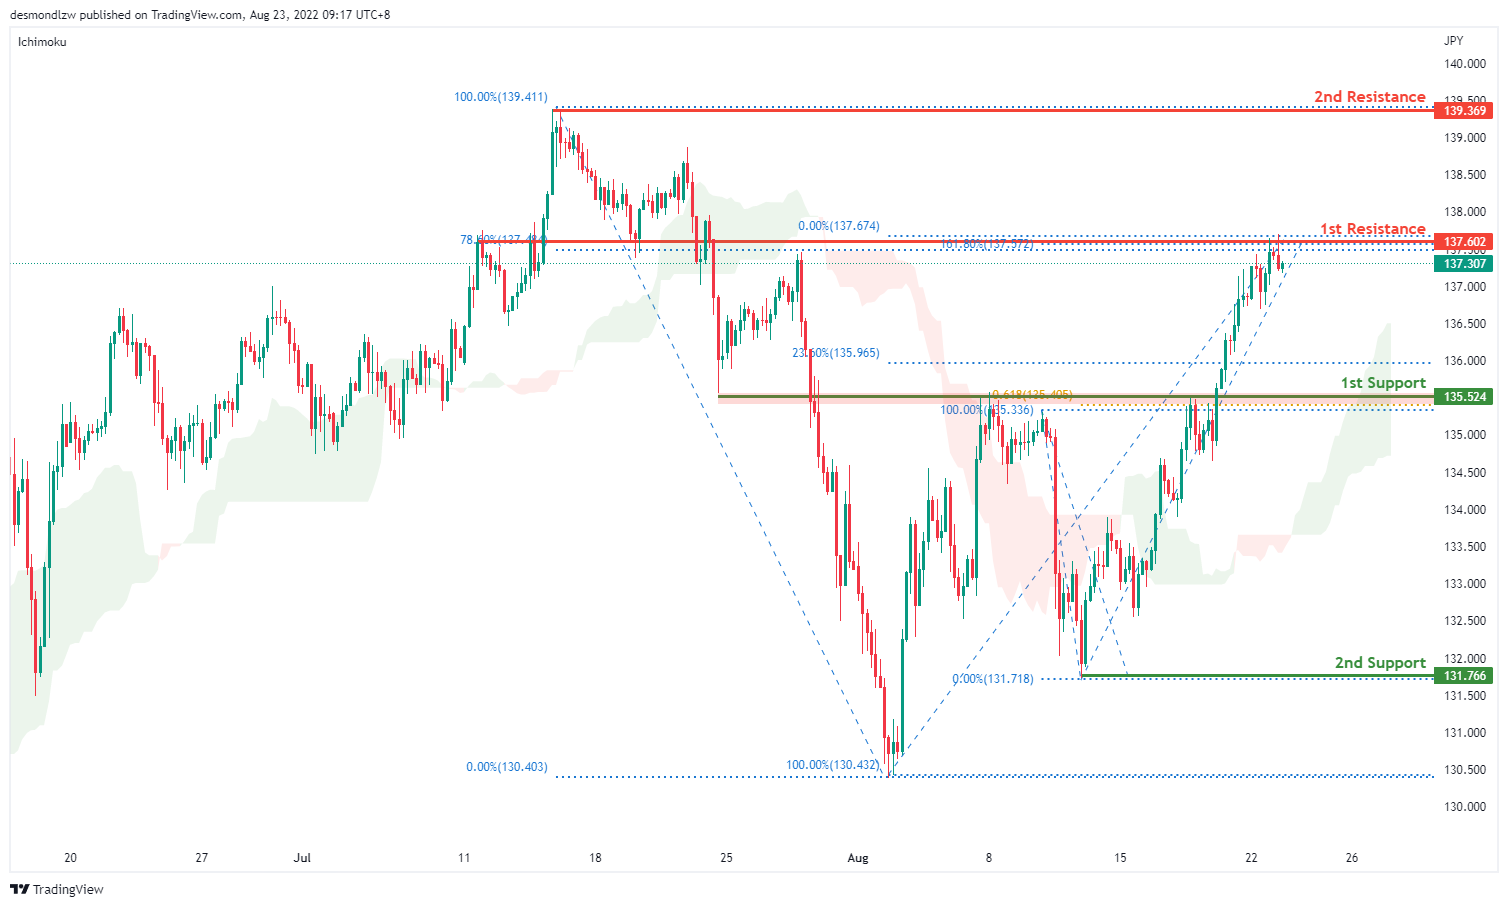
On the H4 chart, price has confirmed a bullish momentum breaking the previous high and testing the first resistance at 137.602 where the 78.6% fibonacci retracement and 161.8% extension sits. If bullish momentum continues, it will bring the price to 139.369 where the swing high sits. Alternatively if price pulls back, it should test the first support at 135.524 and the second support at 131.766
Areas of consideration:
- H4 time frame, 1st resistance at 137.602
- H4 time frame, 1st support at 131.766
DXY:
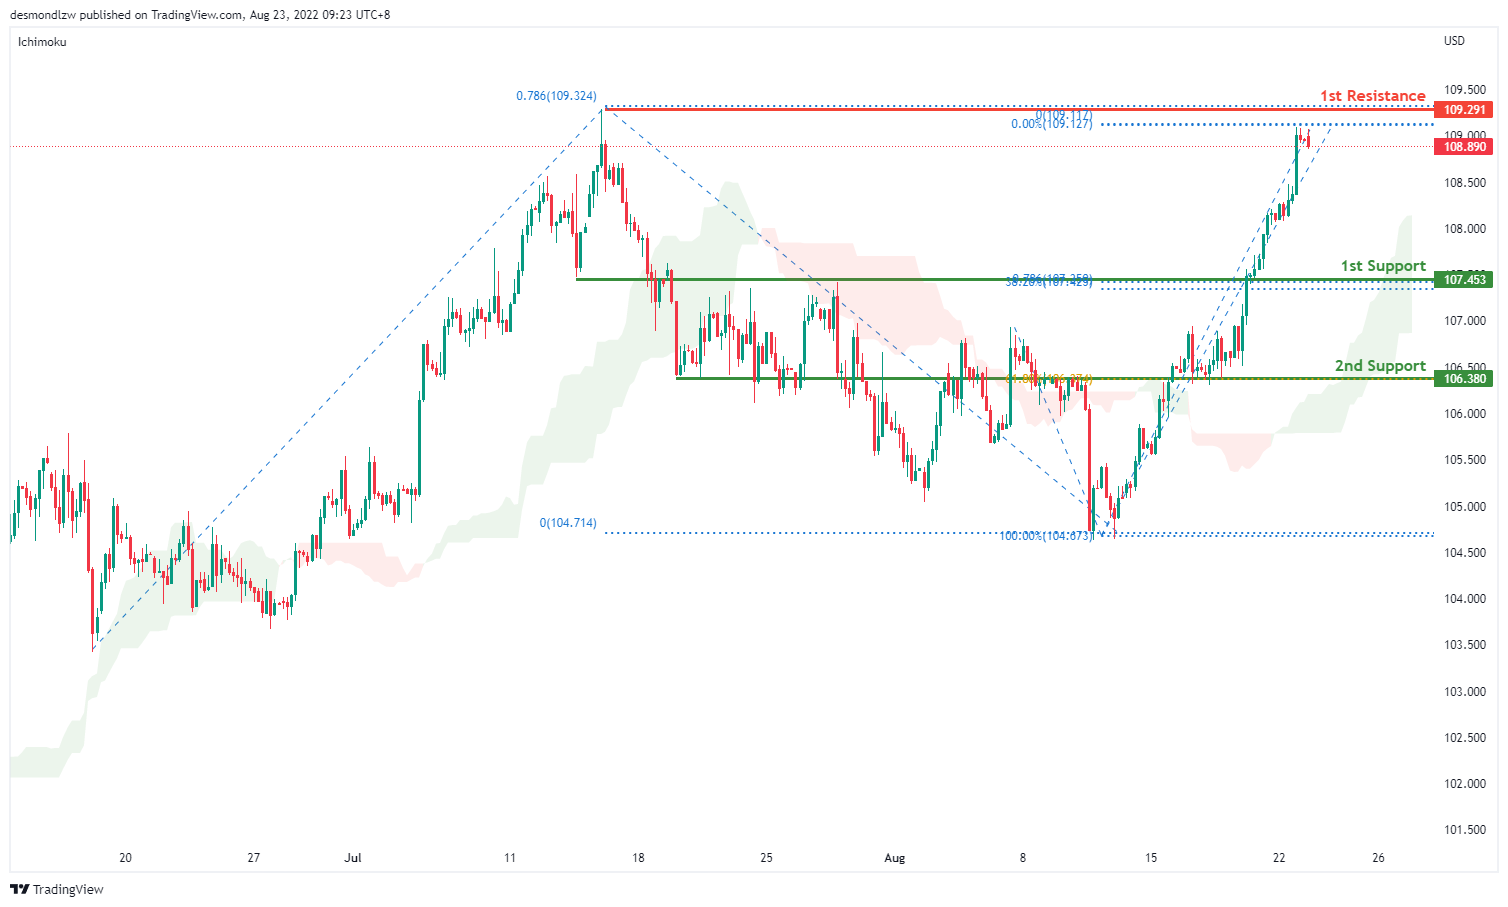
On the H4, prices seem to be moving in an ascending trend and is in a bullish momentum. Price is moving toward first resistance at 109.291 where the 78.6% Fibonacci projection and the previous swing high sits. If price fails to break the first resistance, it will pull back to test the first support at 107.453 where the 38.2% retracement and 78.6% projection sits and subsequently the second support at 106.380 where the 61.8% retracement sits
Areas of consideration:
- H4 time frame, 1st resistance at 109.291
- H4 time frame, 1st support at 107.453
EUR/USD :
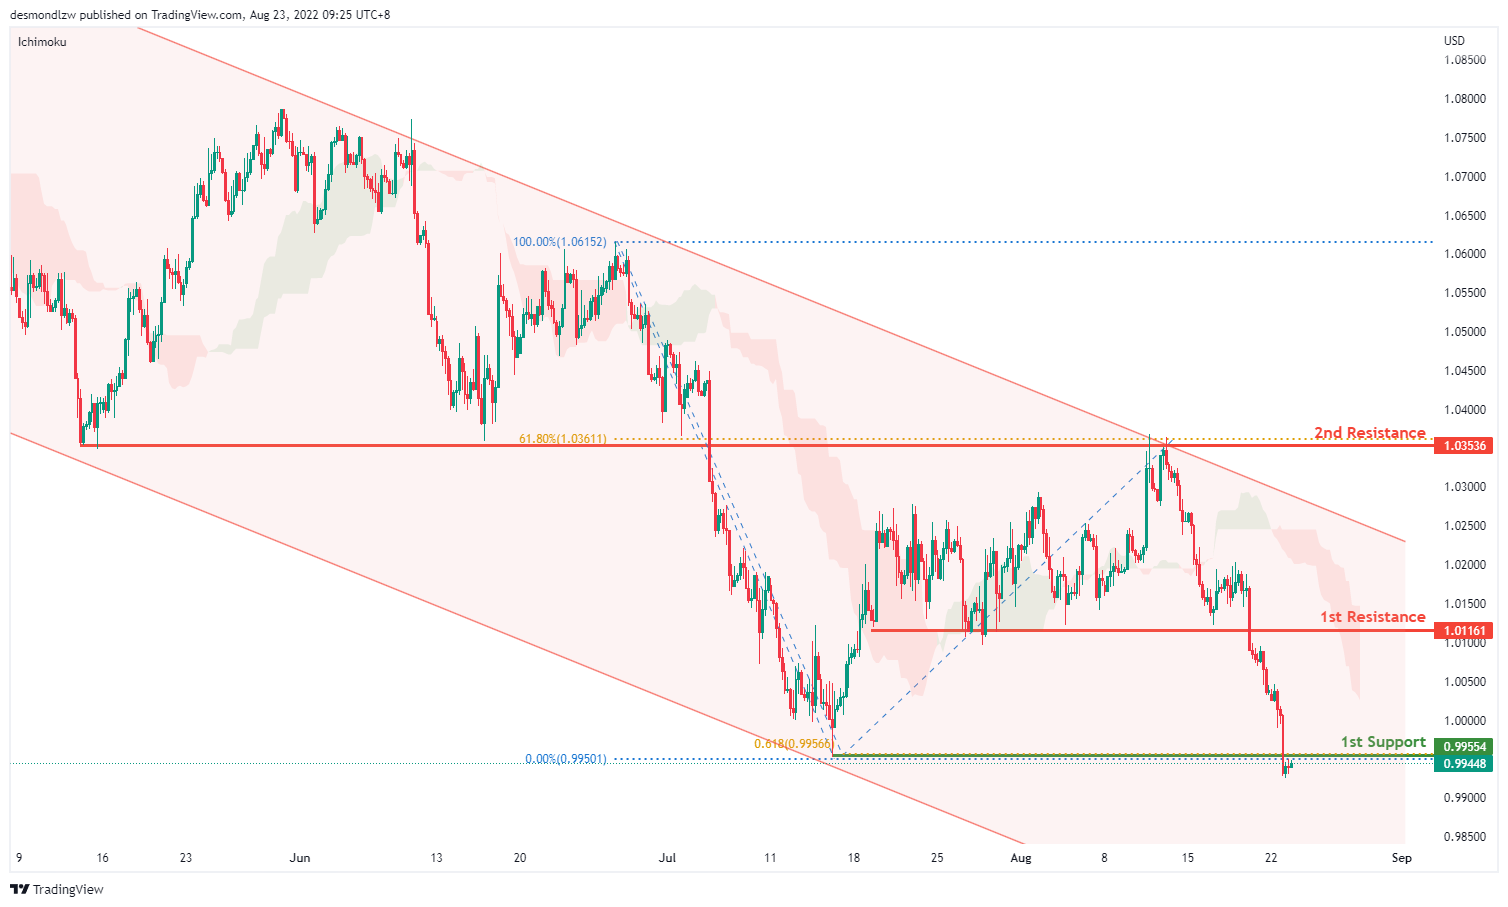
On the H4, prices have broken the ascending trend and are below the ichimoku indicator, we are bearish bias. Prices are testing the first support at 0.9955 where the 61.8% projection sits. Alternatively, prices could pull back to test the first resistance at 1.0116 where the previous swing low sits and subsequently the second resistance at 1.0353 where the 61.8% retracement and swing high sits
Areas of consideration :
- H4 1st resistance at 1.0116
- H4 1st support at 0.9955
GBP/USD:
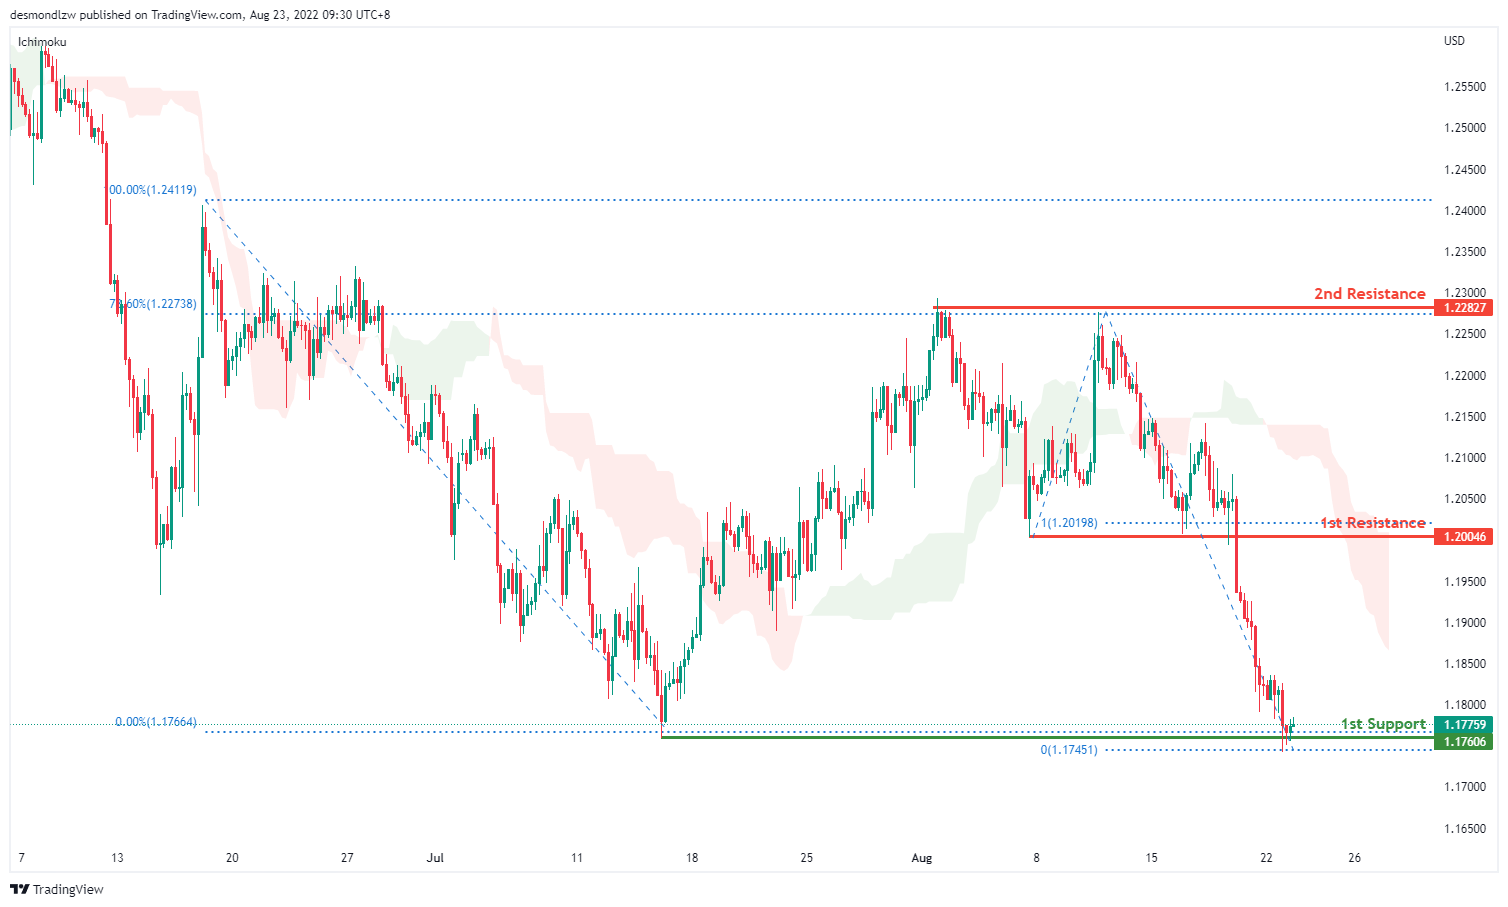
On the H4, prices seem to be in a bearish momentum. It is currently testing the first support at 1.1760 where the swing low sits. Alternatively, price can pull back to test the first resistance at 1.2004 where the 50% retracement and 100% projection sits. Subsequently testing the second resistance at 1.2282 where 78.6% retracement and the swing high sits
Areas of consideration:
- H4 1st resistance at 1.2004
- H4 1st support at 1.1760
USD/CHF:
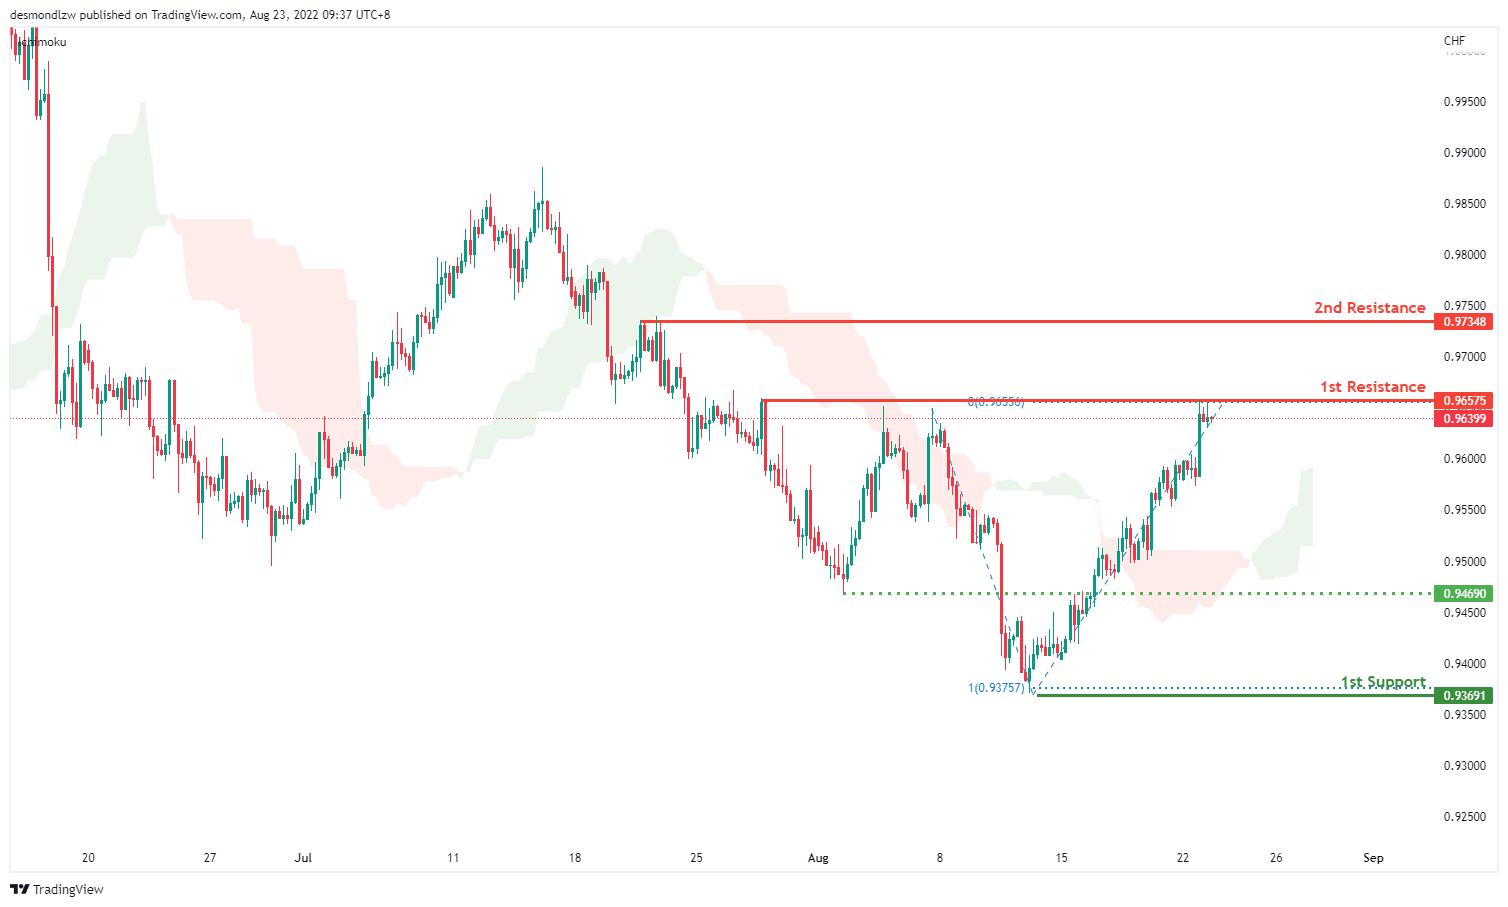
On the H4, with prices moving above the ichimoku cloud and breaking the descending trend, we are bullish bias. Price seems like it’s rising toward the first resistance at 0.9657 where the 61.8% fibonacci retracement sits. If price continues with the bullish momentum it will test the second resistance at 0.9737. Alternatively, prices could test the intermediate support at 0.9469 where the swing low sits and then the first support at 0.9369 where the 78.6% fibonacci retracement sits
Areas of consideration
- H4 1st support at 0.9369
- H4 1st resistance at 0.9657
XAU/USD (GOLD):
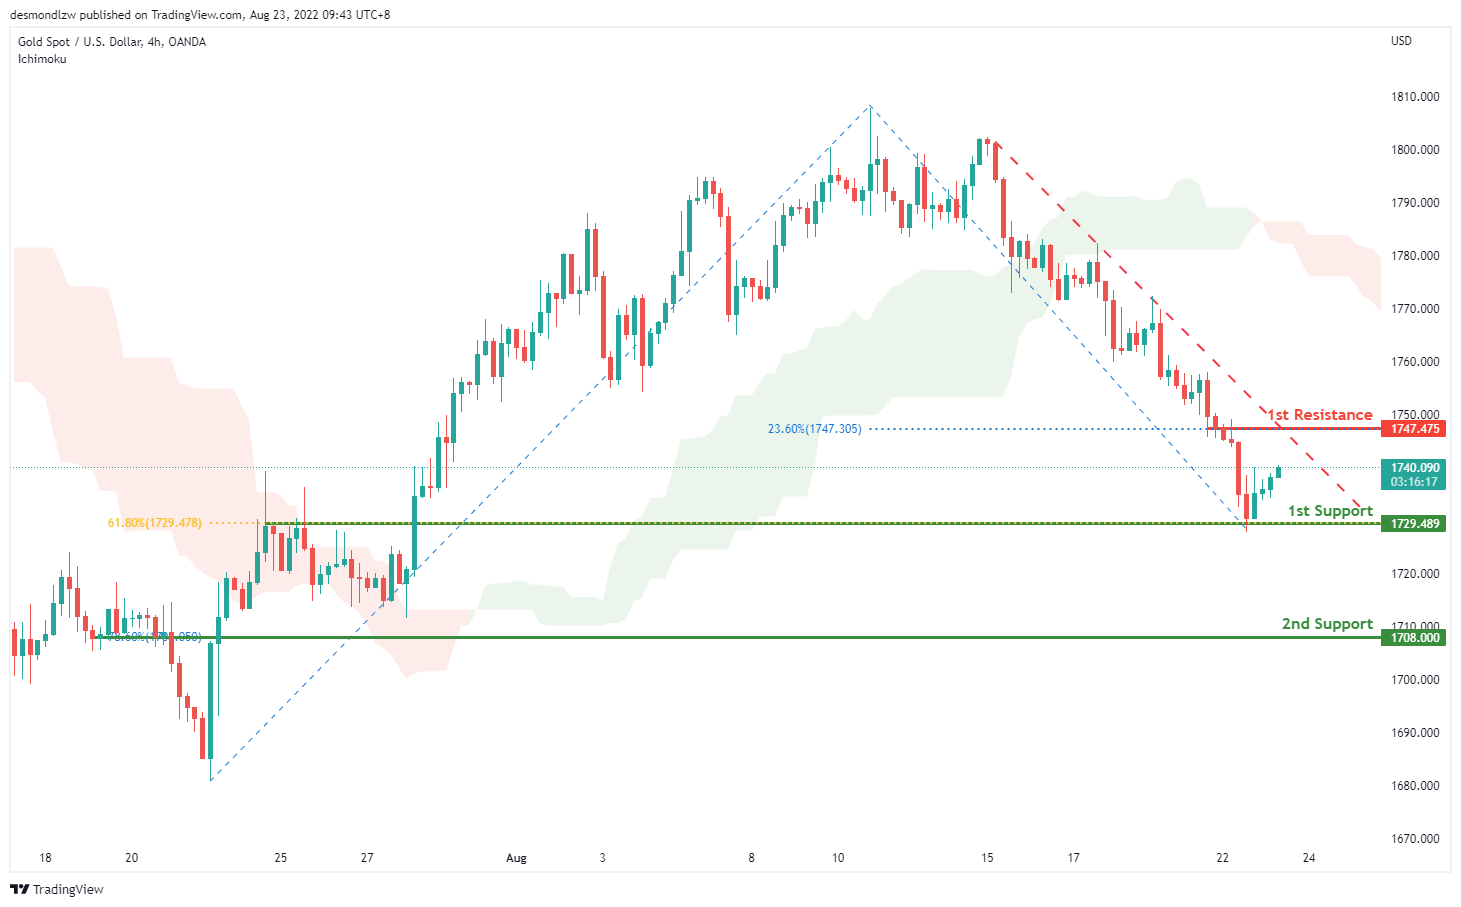
On the H4, with prices moving within the descending trendline, below ichimoku cloud, we have a bearish bias that the price may drop from the 1st support at 1729.489, which is in line with the 61.8% fibonacci retracement to the 2nd support at 1708.000, where the 78.6% fibonacci retracement is. Alternatively, the price may pullback and rise to the 1st resistance at 1747.475, where the 23.6% fibonacci retracement is.
Areas of consideration:
- H4 time frame, 1st support at 1729.489
- H4 time frame, 2nd support at 1708.000
AUD/USD:
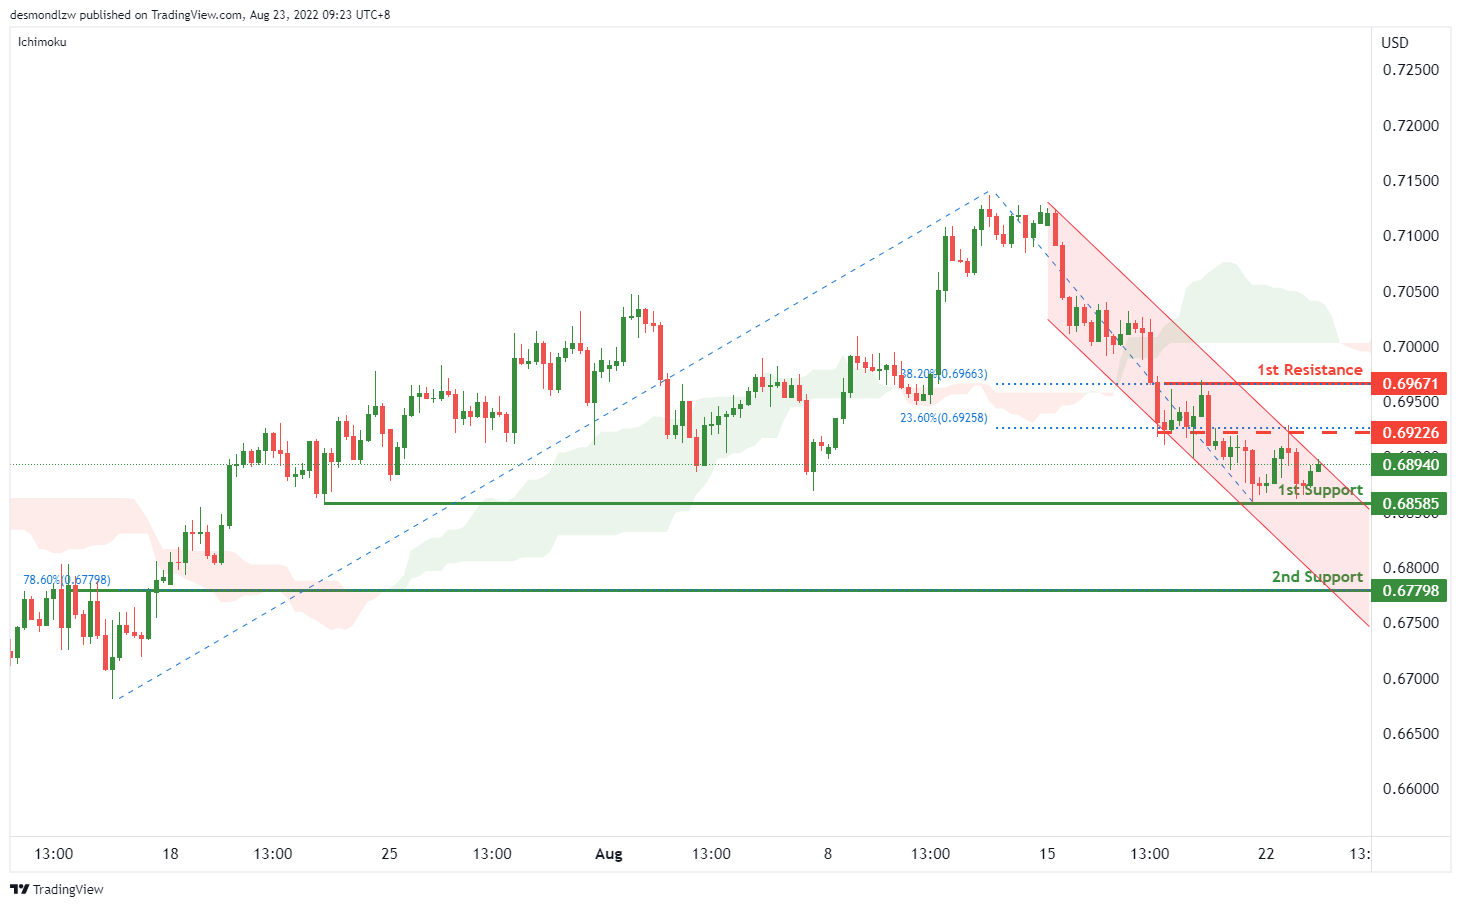
On the H4, with the price going within the descending channel and below ichimoku cloud, we have a bearish bias that the price may drop to the 1st support at 0.68585, which is in line with the previous swing low. If the price breaks the 1st support, we can expect it to drop to the 2nd support at 0.67798, where the 78.6% fibonacci retracement is. Alternatively, the price may break the descending channel and rise to the 1st resistance at 0.69671, where the swing high and 38.2% fibonacci retracement are. Take note the price of 0.69226 could be our intermediate resistance, which is in line with the 23.6% fibonacci retracement.
Areas of consideration
- H4 1st support at 0.68585
- H4 2nd support at 0.67798
NZD/USD:
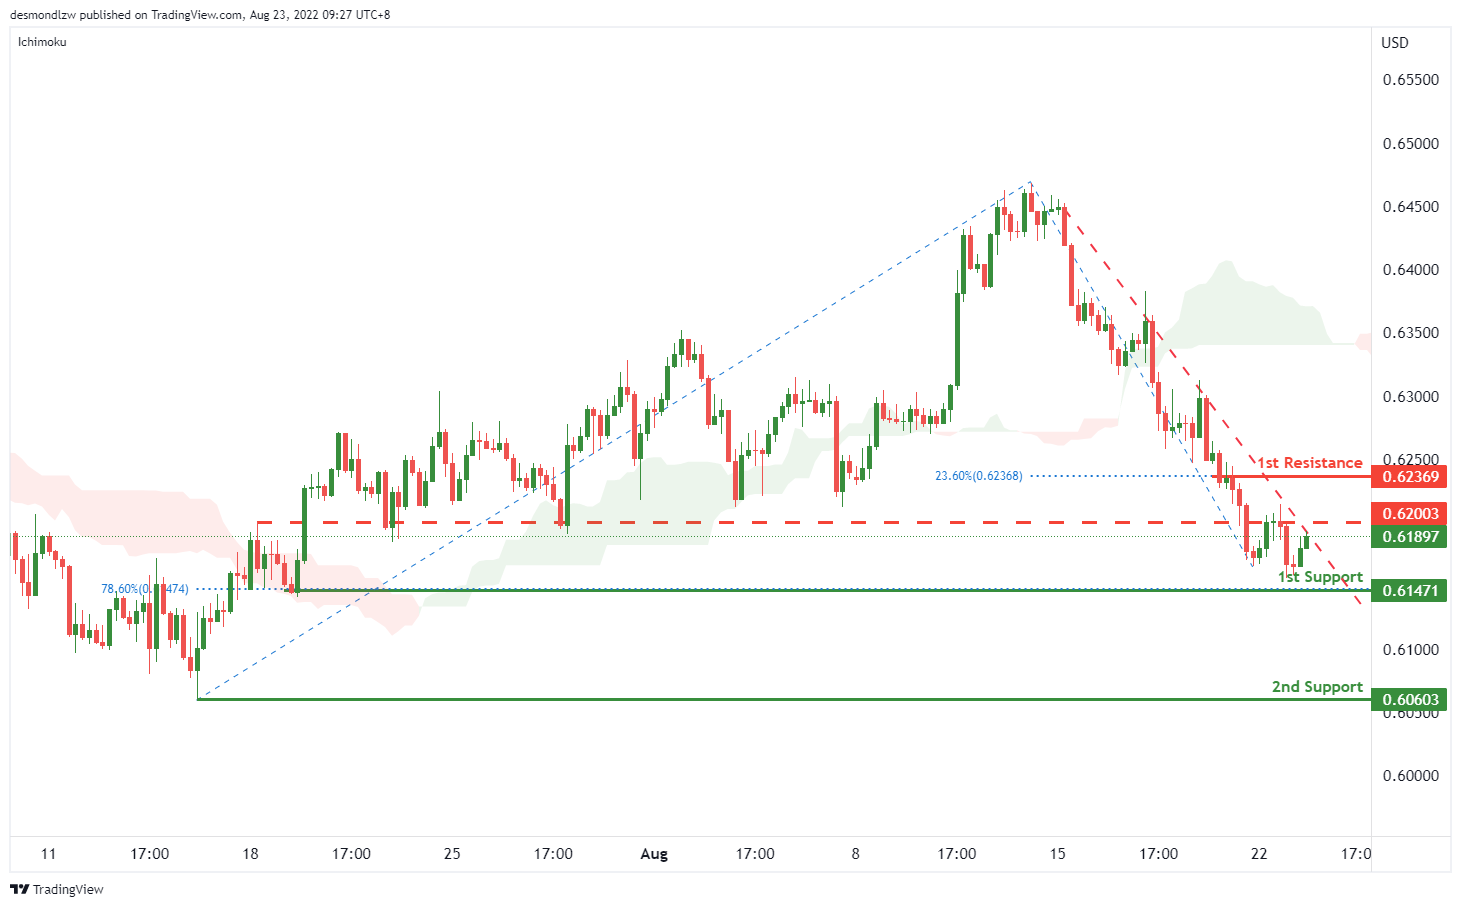
On the H4, with the price moving within the descending trendline, below ichimoku cloud and MACD indicators are below zero, we have a bearish bias that the price may drop to the 1st support at 0.61471, which is in line with the 78.6% fibonacci retracement and pervious swing low, if the price continue dropping, the price may drop to the 2nd support at 0.60603, which is in line with the swing low. Alternatively, the price may rise to the 1st resistance at 0.62369, where the 23.6% fibonacci retracement is. Take note the price of 0.62003 could be the intermediate resistance, which is the overlap resistance.
Areas of consideration:
- H4 time frame, 1st support at 0.61471
- H4 time frame, 2nd support at 0.60603
USD/CAD:
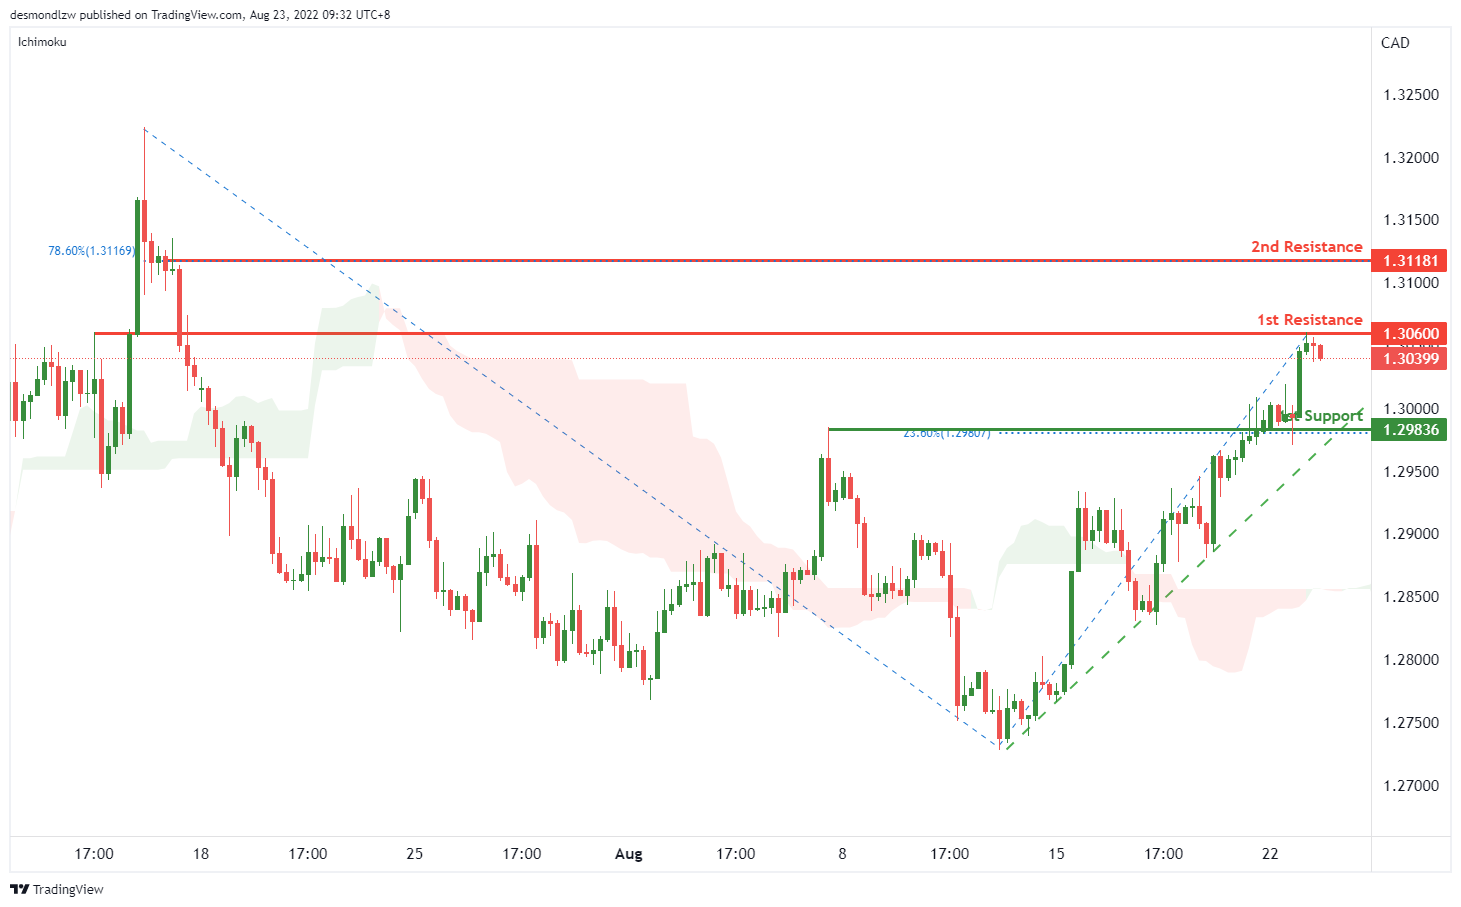
On the H4, with the price above the ichimoku cloud and moving within the ascending trendline, we have a bullish bias that if the price break the 1st resistance at 1.30600, which is the current swing high, the price may rise to the 2nd resistance at 1.31181, which is in line with 78.6% fibonacci retracement. Alternatively, the price may drop to the 1st support at 1.29836, where the 23.6% fibonacci retracement is.
Areas of consideration:
- H4 time frame, 1st resistance at 1.30600
- H4 time frame, 2nd resistance at 1.31181
OIL:
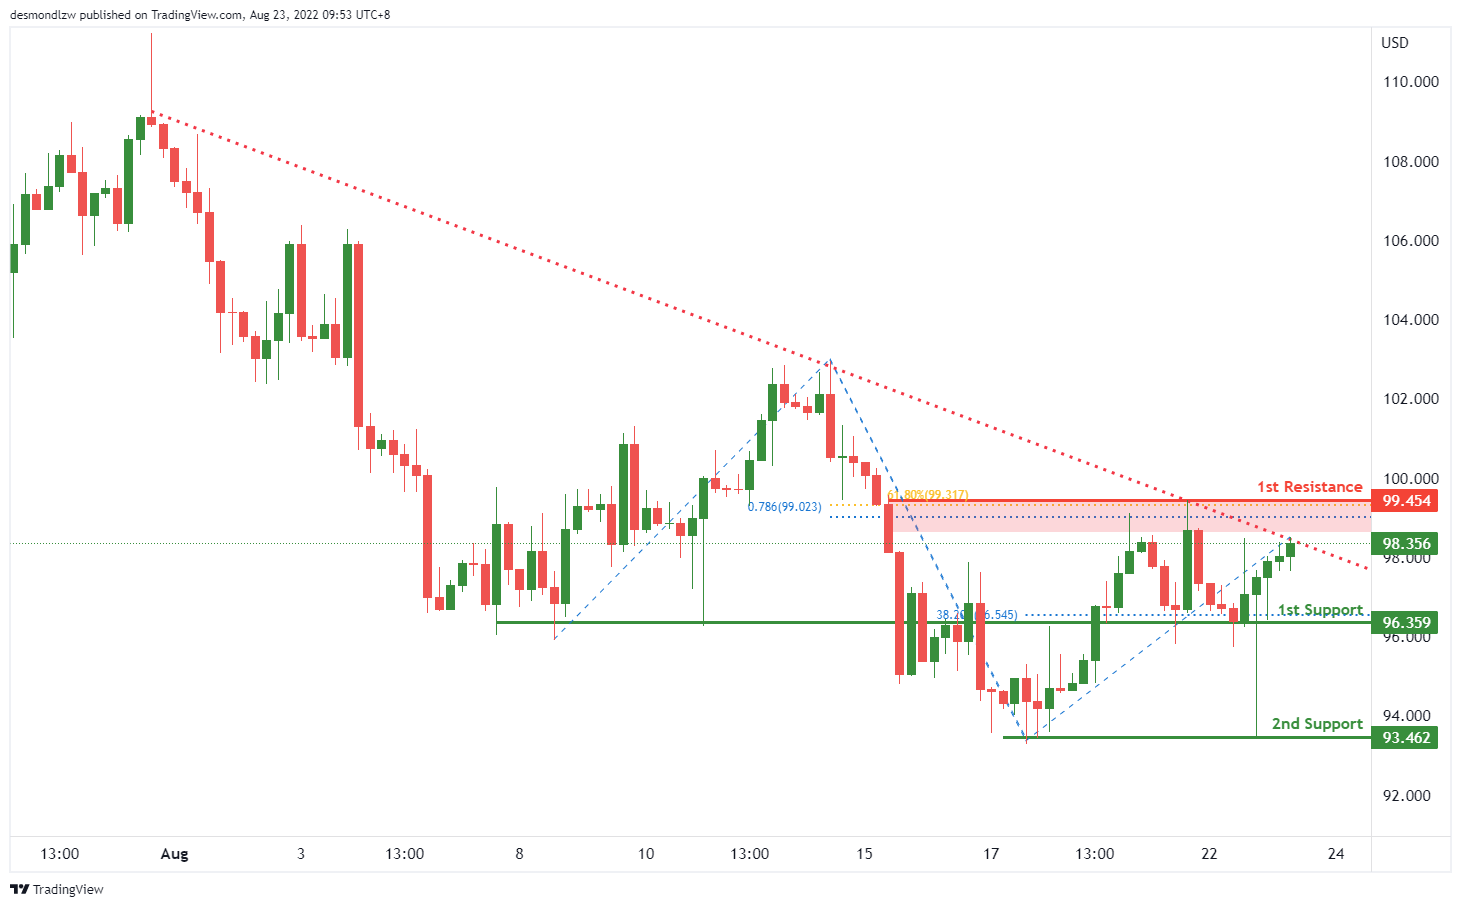
On the H4, with price moving within the descending trendline, we have a bearish bias that the price may drop to our 1st support at 96.359, which is in line with the overlap support and 38.2% fibonacci retracement, if the price break the 1st support, the price may drop to the 2nd support at 93.462, which is in line with the swing low. Otherwise, the price may rise to the 1st resistance at 99.454, where the 78.6% fibonacci projection, 61.8% fibonacci retracement and swing high are.
Areas of consideration:
- H4 time frame, 1st support at 96.359
- H4 time frame, 2nd support at 93.462
Dow Jones Industrial Average:
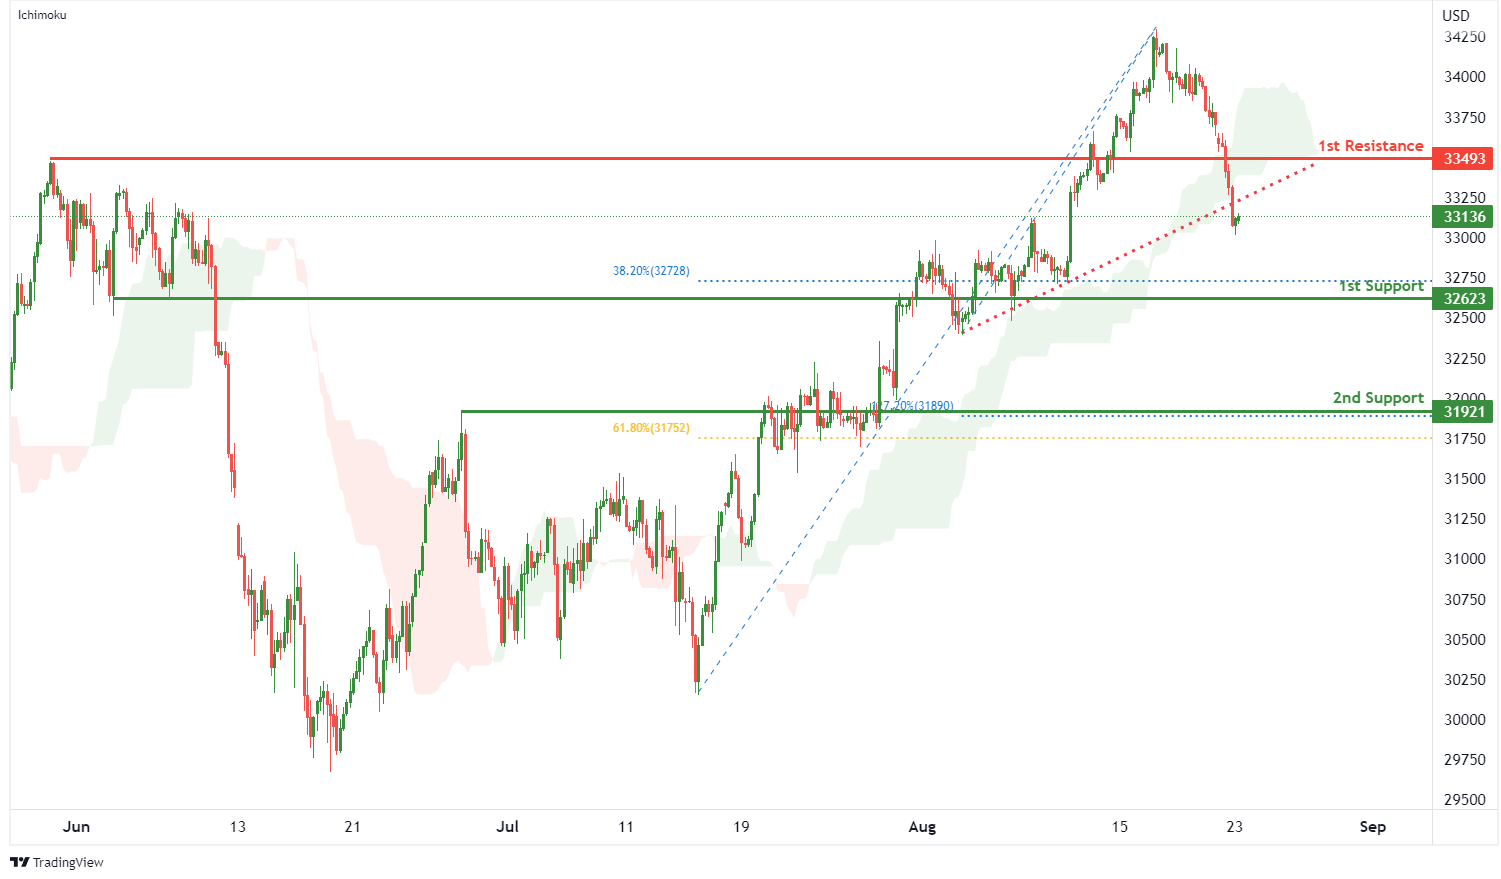
On the H4, with price breaking out of the ascending trendline and moving below the ichimoku indicator, we have a bearish bias that price will drop to 1st support at 32623 where the pullback support and 38.2% fibonacci retracement are. Once there is downside confirmation of price breaking 1st support, we would expect bearish momentum to carry price to 2nd support at 31921 where the pullback support, 61.8% fibonacci retracement and 127.2% fibonacci extension are. Alternatively, price could rise to 1st resistance at 33494 where the pullback resistance is.
Areas of consideration:
- H4 time frame, 1st resistance of 33494
- H4 time frame, 1st support at 32623
DAX:
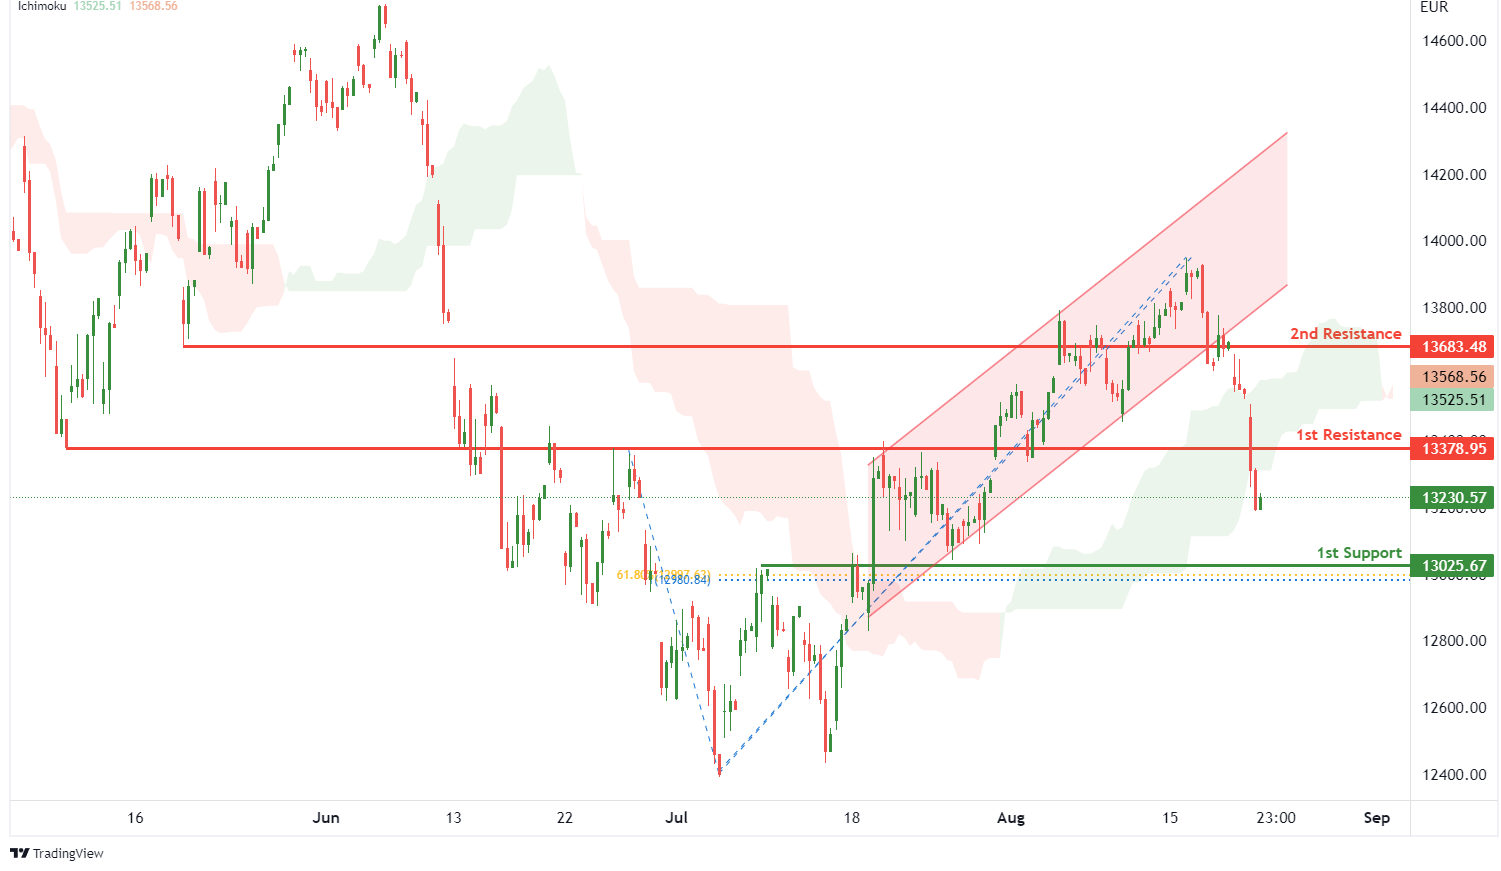
On the H4, with price breaking out of an ascending channel and moving below the ichimoku indicator, we have a bearish bias that price will drop from 1st resistance at 13378.95 where the overlap resistance is to the 1st support at 13025.67 where the pullback support, 61.8% fibonacci retracement and 100% fibonacci projection are. Alternatively, price could break 1st resistance and rise to 2nd resistance at 13683.48 where the pullback resistance is.
Areas of consideration:
- H4 time frame, 1st resistance of 13378.95
- H4 time frame, 1st support at 13025.67
ETHUSD:
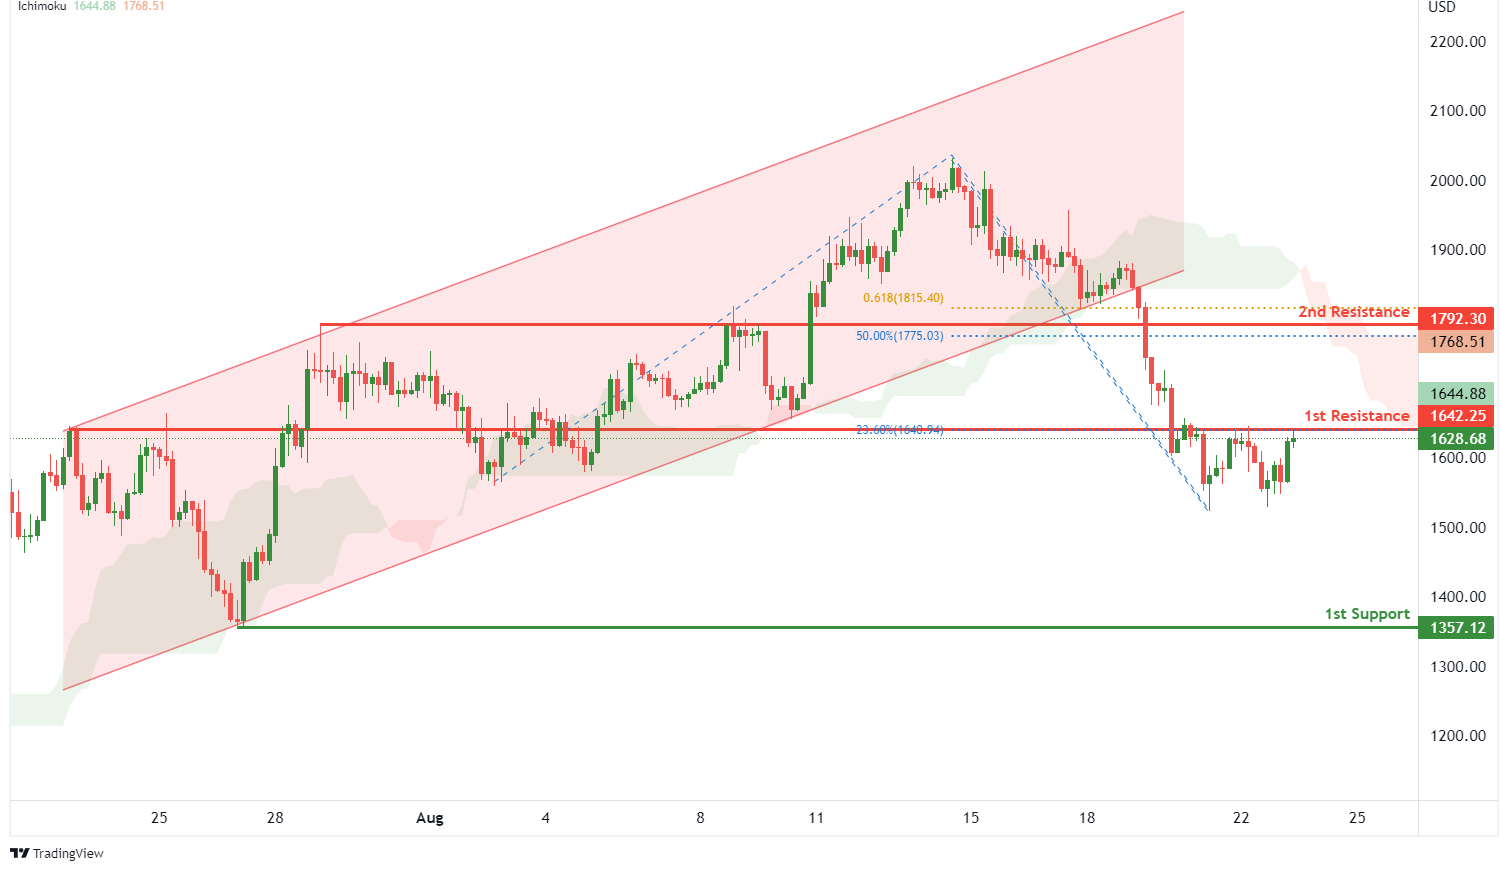
On the H4, with price breaking out of an ascending channel and moving below the ichimoku indicator, we have a bearish bias that price will drop from the 1st resistance at 1642.25 where the pullback support and 23.6% fibonacci retracement are to the 1st support at 1357.12 where the swing low support is. Alternatively, price could break 1st resistance and rise to 2nd resistance at 1792.30 where the overlap resistance, 50% fibonacci retracement and 61.8% fibonacci projection are.
Areas of consideration:
- H4 time frame, 1st resistance of 1642.25
- H4 time frame, 1st support at 1357.12
BTCUSD:
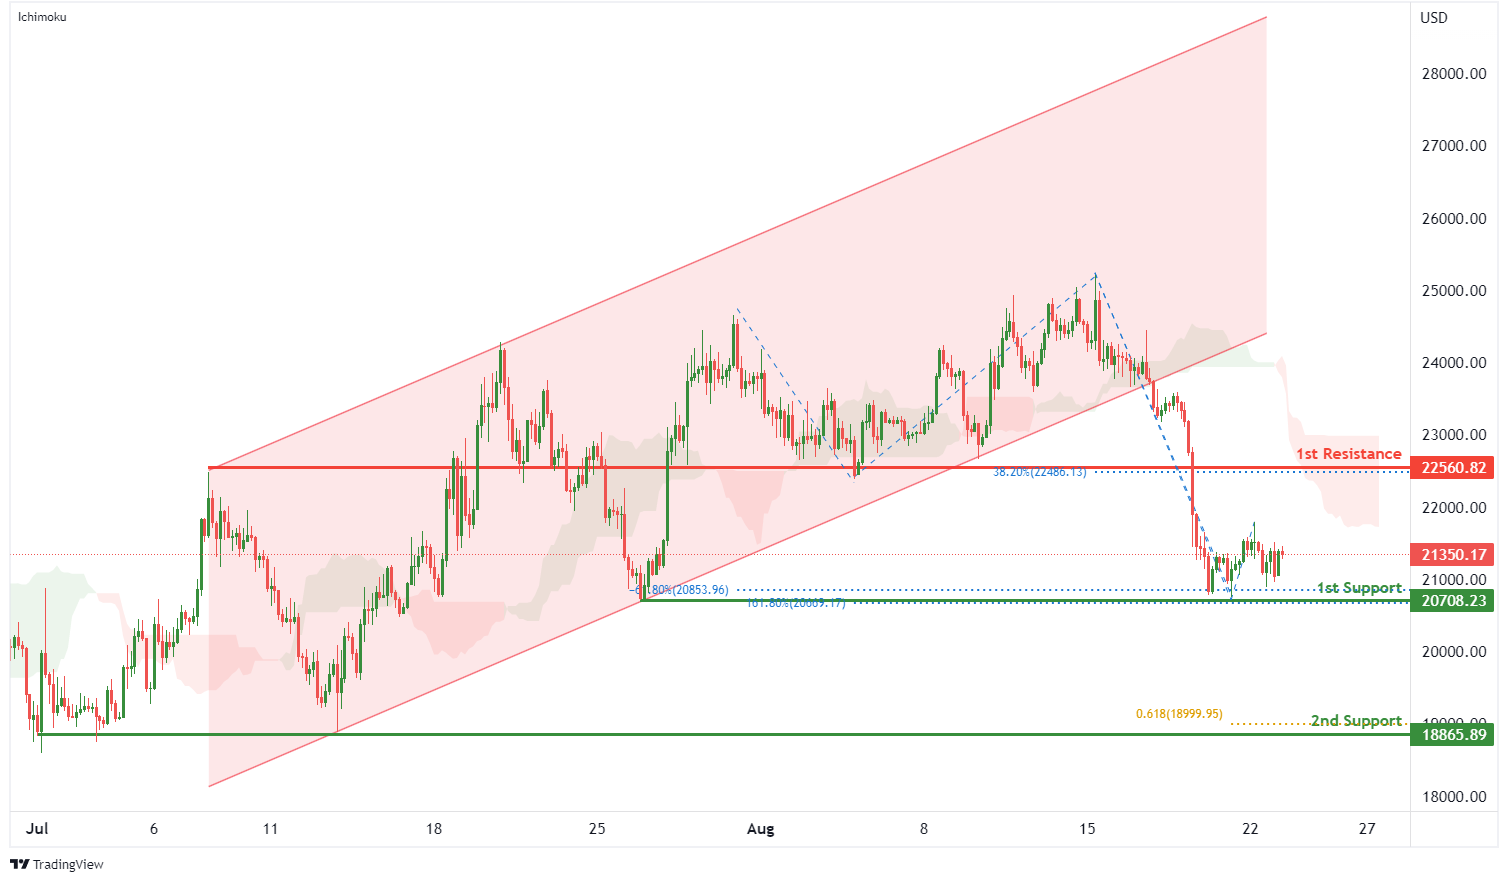
On the H4, with price breaking out of a bullish channel and moving below the ichimoku indicator, we have a bearish bias that price will drop to 1st support at 20708.23 where the -61.8% fibonacci expansion, 161.8% fibonacci extension and swing low support are. Once we have downside confirmation of price breaking 1st support structure,we would expect bearish momentum to carry price to 2nd support at 18865.89 where the swing low support and 61.8% fibonacci projection are. Alternatively, price could rise to 1st resistance at 22560.82 where the pullback resistance and 38.2% fibonacci retracement are.
Areas of consideration:
- H4 time frame, 1st resistance of 22560.82
- H4 time frame, 1st support at 20708.23
S&P 500:
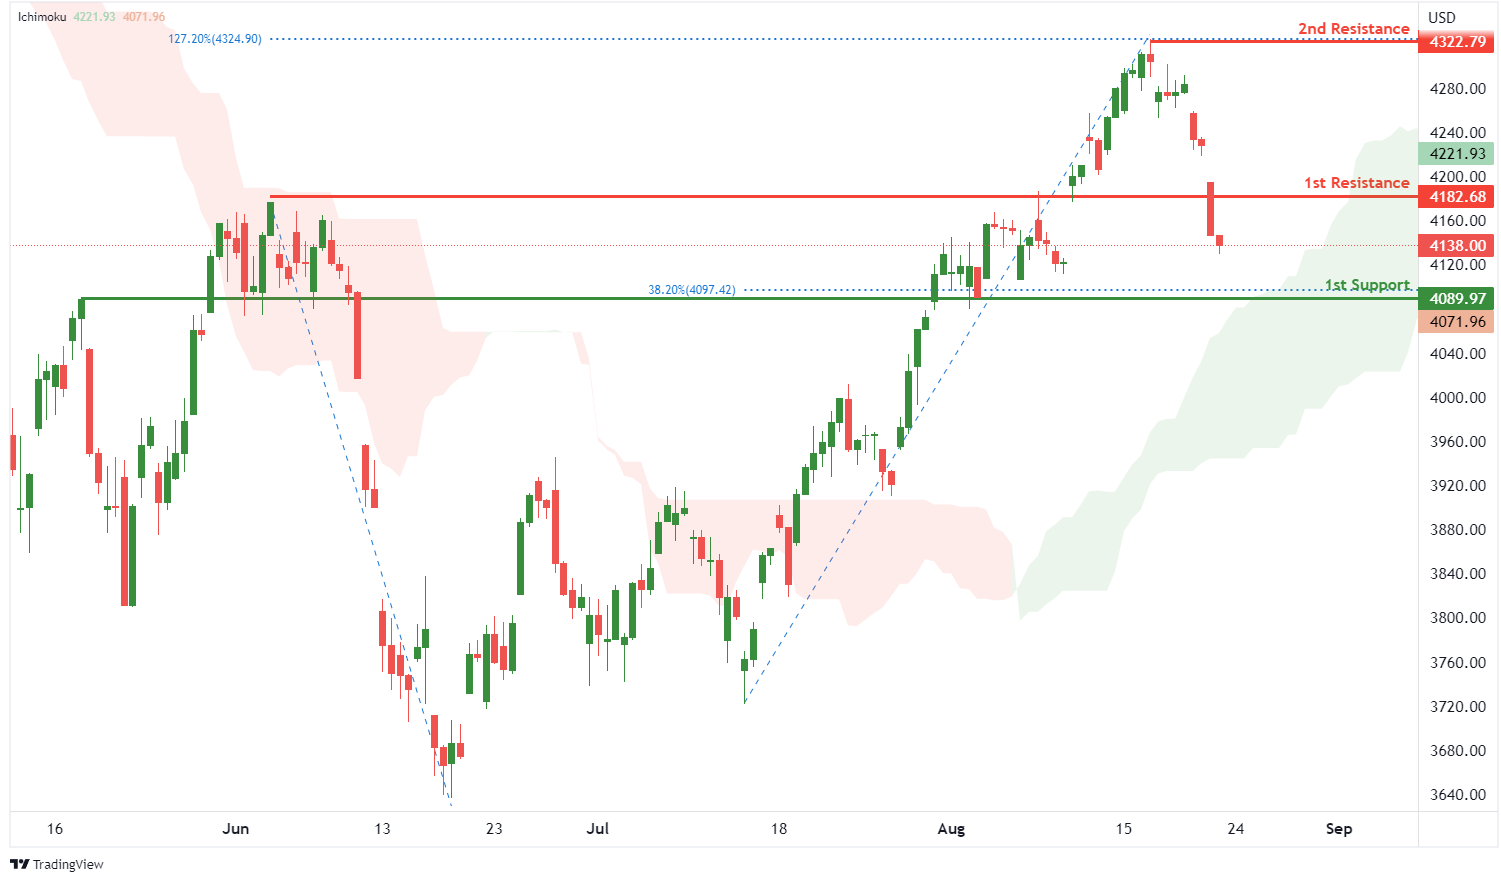
On the H4, with prices moving above the ichimoku indicator, we have a bullish bias that the price will rise to 1st resistance at 4182.68 where the pullback support is. Once there is upside confirmation of price breaking 1st resistance structure, we would expect bullish momentum to carry price to 2nd resistance at 4322.79 where the swing high resistance and 127.2% fibonacci extension are. Alternatively, price could drop to 1st support at 4089.97 where the pullback support and 38.2% fibonacci retracement are.
Areas of consideration:
- H4 time frame, 1st resistance of 4182.68
- H4 time frame, 1st support at 4089.97
GBP/USD Accelerates Lower, Euro Dives Below Parity
Key Highlights
- GBP/USD declined heavily below 1.2000 and 1.1850.
- Many hurdles are forming near 1.1900 and 1.2000 on the 4-hours chart.
- EUR/USD declined heavily below the parity level.
- The US Manufacturing PMI could decline from 52.2 to 51.5 in August 2022 (Preliminary).
GBP/USD Technical Analysis
The British Pound failed to clear the 1.2250 resistance zone against the US Dollar. GBP/USD started a major decline and traded below the key 1.2000 support zone.
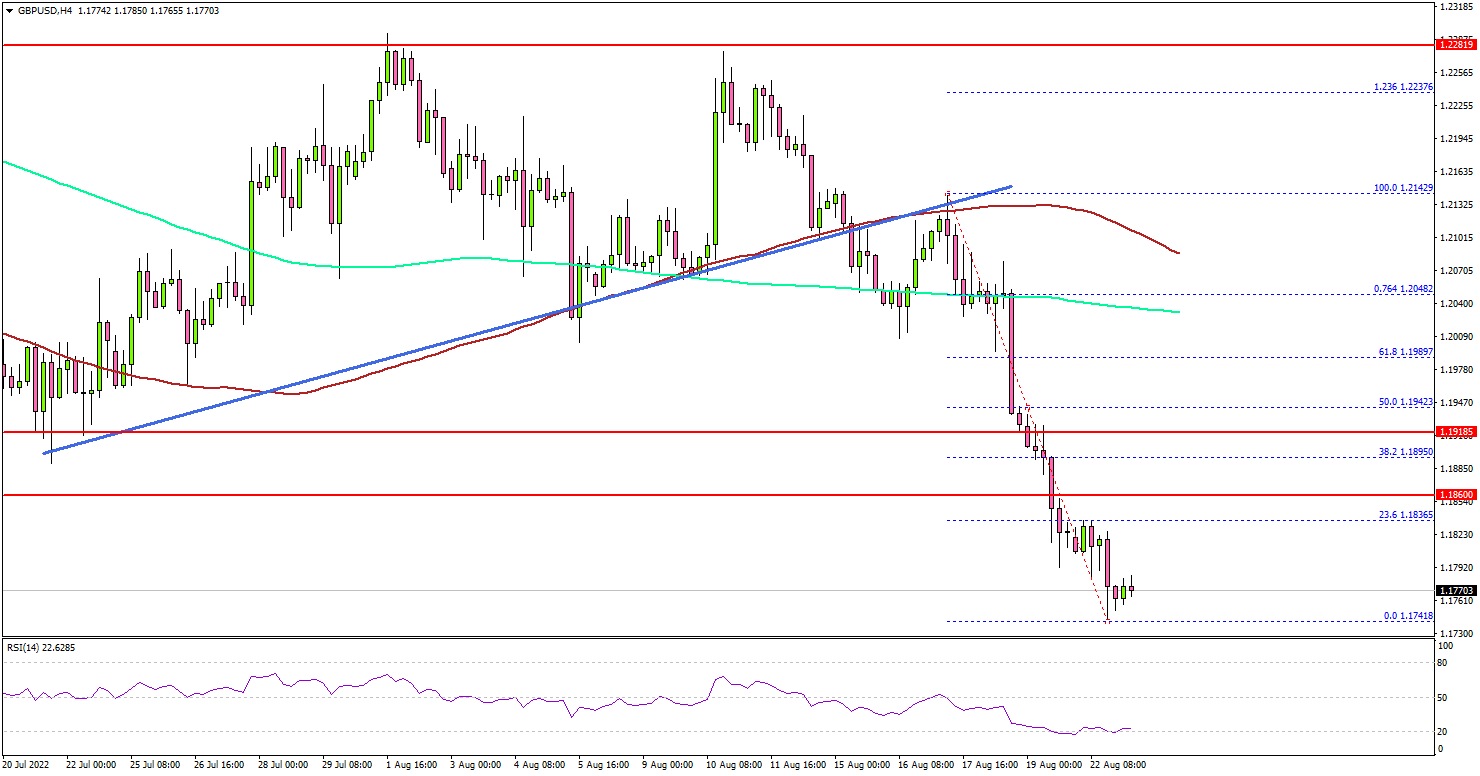
Looking at the 4-hours chart, the pair settled below the key 1.2000 support, the 100 simple moving average (red, 4-hours), and the 200 simple moving average (green, 4-hours). There was also a break below a major bullish trend line with support near 1.2100.
The decline gained pace below the 1.1850 support level. If the bears remain in action, the pair could dive further below 1.1750.
The next major support is near the 1.1700 zone, below which the bears may even aim a move towards the 1.1500 level in the coming days.
On the upside, the pair is facing resistance near the 1.1850 level. The next major resistance is near the 1.1910 level. A clear move above the 1.1910 resistance might send the pair higher towards the 1.2000 level.
Looking at EUR/USD, the pair declined heavily below the 1.0000 support zone and there is a risk of more losses in the near term.
Economic Releases
- Germany’s Manufacturing PMI for August 2022 (Preliminary) - Forecast 48.3, versus 49.3 previous.
- Germany’s Services PMI for August 2022 (Preliminary) - Forecast 49.0, versus 49.7 previous.
- Euro Zone Manufacturing PMI for August 2022 (Preliminary) – Forecast 49.0, versus 49.8 previous.
- Euro Zone Services PMI for August 2022 (Preliminary) – Forecast 50.5, versus 51.2 previous.
- UK Manufacturing PMI for August 2022 (Preliminary) – Forecast 51.3, versus 52.1 previous.
- UK Services PMI for August 2022 (Preliminary) – Forecast 52.0, versus 52.6 previous.
- US Manufacturing PMI for August 2022 (Preliminary) – Forecast 51.5, versus 52.2 previous.
- US Services PMI for August 2022 (Preliminary) – Forecast 49.1, versus 47.3 previous.
EURUSD Wave Analysis
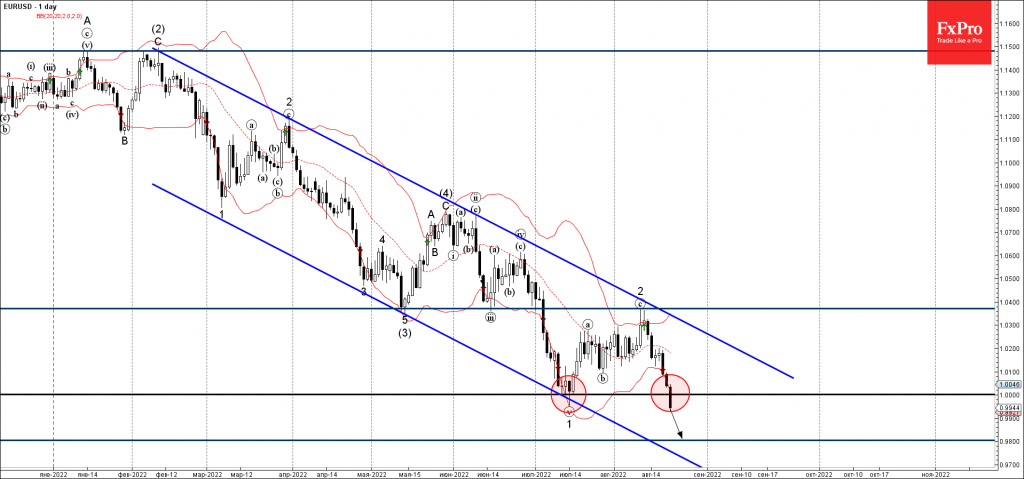
- EURUSD broke below the parity 1.0000
- Likely to fall to support level 0.9800
EURUSD today broke strongly below the parity 1.0000 (which stopped the previous sharp downward impulse wave 1 from the start of June).
The breakout of the parity 1.0000 should accelerate the active short-term downward impulse wave 3.
Given the overriding daily downtrend, EURUSD can be expected to fall further toward the next support level 0.9800 (low of the earlier wave (ii) from the start of August).
Eco Data 8/23/22
[php_everywhere instance="1"]
How will Jackson Hole Meeting Affect Markets?
What will happen?
Federal Reserve Chair Jerome Powell will give a speech during the Jackson Hole Symposium on August 26 at 18:00 GMT+3. Analysts expect to hear statements about the future of interest rates and get hints regarding quantitative tightening (QT) in the United States. Therefore, the Federal Reserve Chair has all the chances to set the September market trend.
Moreover, European Central Bank Executive Board member Isabel Schnabel will give her speech on Saturday, but ECB President Christine Lagarde doesn't plan to attend.
Why is it important?
US stocks have rallied since the Fed's last policy meeting in late July as investors saw signs that inflationary pressure decreased and thought that the central bank will begin slowing the pace of tightening.
However, experts are not so optimistic. A year ago, inflation had risen well above the Fed's 2% target, but Powell emphasized that those pressures would probably be transitory.
Now inflation is near the highest level in four decades. Powell has confirmed that the Fed's analysis was incorrect, and policymakers should have begun raising interest rates sooner.
Therefore, despite the latest monthly report on consumer prices causing some optimism that inflation may have peaked, Powell might sound hawkish.
"They are so focused on doing this partly just because they screwed up last year with the whole 'transitory' thing, and they realize that the one thing they can do now is tightening policy, and that will slow inflation," said Kevin Cummins, the chief US economist at NatWest Markets in Stamford, Connecticut.
The Fed raised its benchmark interest rate by 75 basis points at the July policy meeting, following an increase of the same size the month before.
What about Europe?
In Europe, policymakers are also concerned about the size of the next rate hike. Following last month's half-point increase, the ECB can make another 50-basis-point step in September or a more minor, 25-basis-point move due to recession risks.
As the only Executive Board member attending the conference, Isabel Schnabel might provide insights into the ECB's plans to deal with high price pressure and a weakening economy.
The bottom line
Analysts and experts expect to hear some highly hawkish speeches from the central bank's leaders at the end of this week, especially from Jerome Powell. Therefore, the US dollar has strengthened against the other currencies during the previous week. We believe that the markets might overestimate central bankers' intentions.
If Jerome Powell doesn't make any hawkish statements, the US dollar will get under heavy pressure, and it will probably be the end of its rally this year.
Technical analysis
US dollar index, daily chart

US dollar index might come to 110.00 resistance by the end of the week. Currently, the price is trading under the resistance of 108.55. Nothing will stop buyers from reaching the primary target if they break through this support. However, after such a solid growth, a correction is highly expected, and as a famous saying says, “buy the rumors – sell the news.” We expect the US dollar index to reverse at the beginning of the next week towards the resistance range of 104.10 – 105.20, pushing the basket of currencies versus the USD.
EURUSD, H4 chart
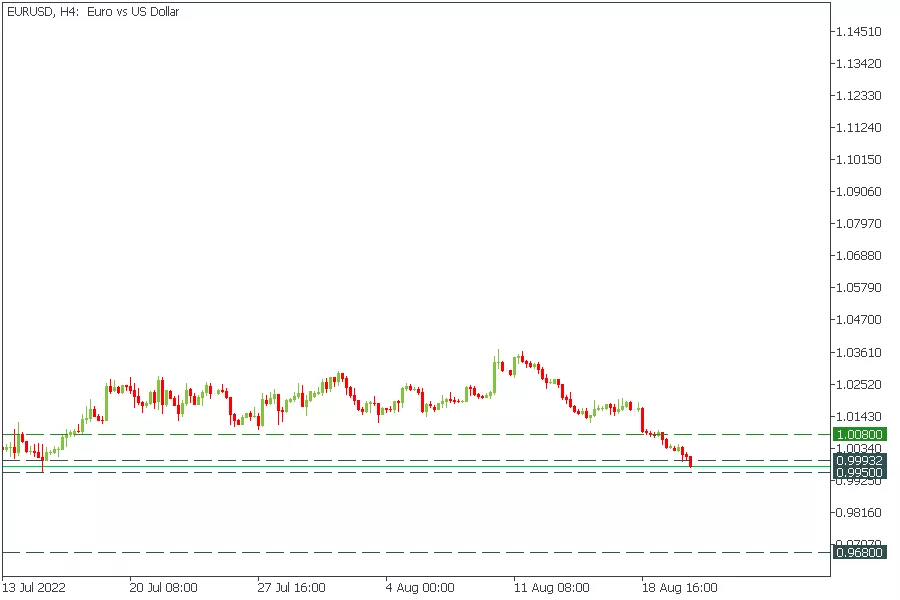
EURUSD is moving right above the 0.9950 – 0.99932 support range. If the pair loses this support, I might plunge towards 0.9680, a support level from 2001. However, if buyers hold this support, it would be a strong signal to buy towards 1.0080.
Is GBPCAD Headed for the 2010 Low?
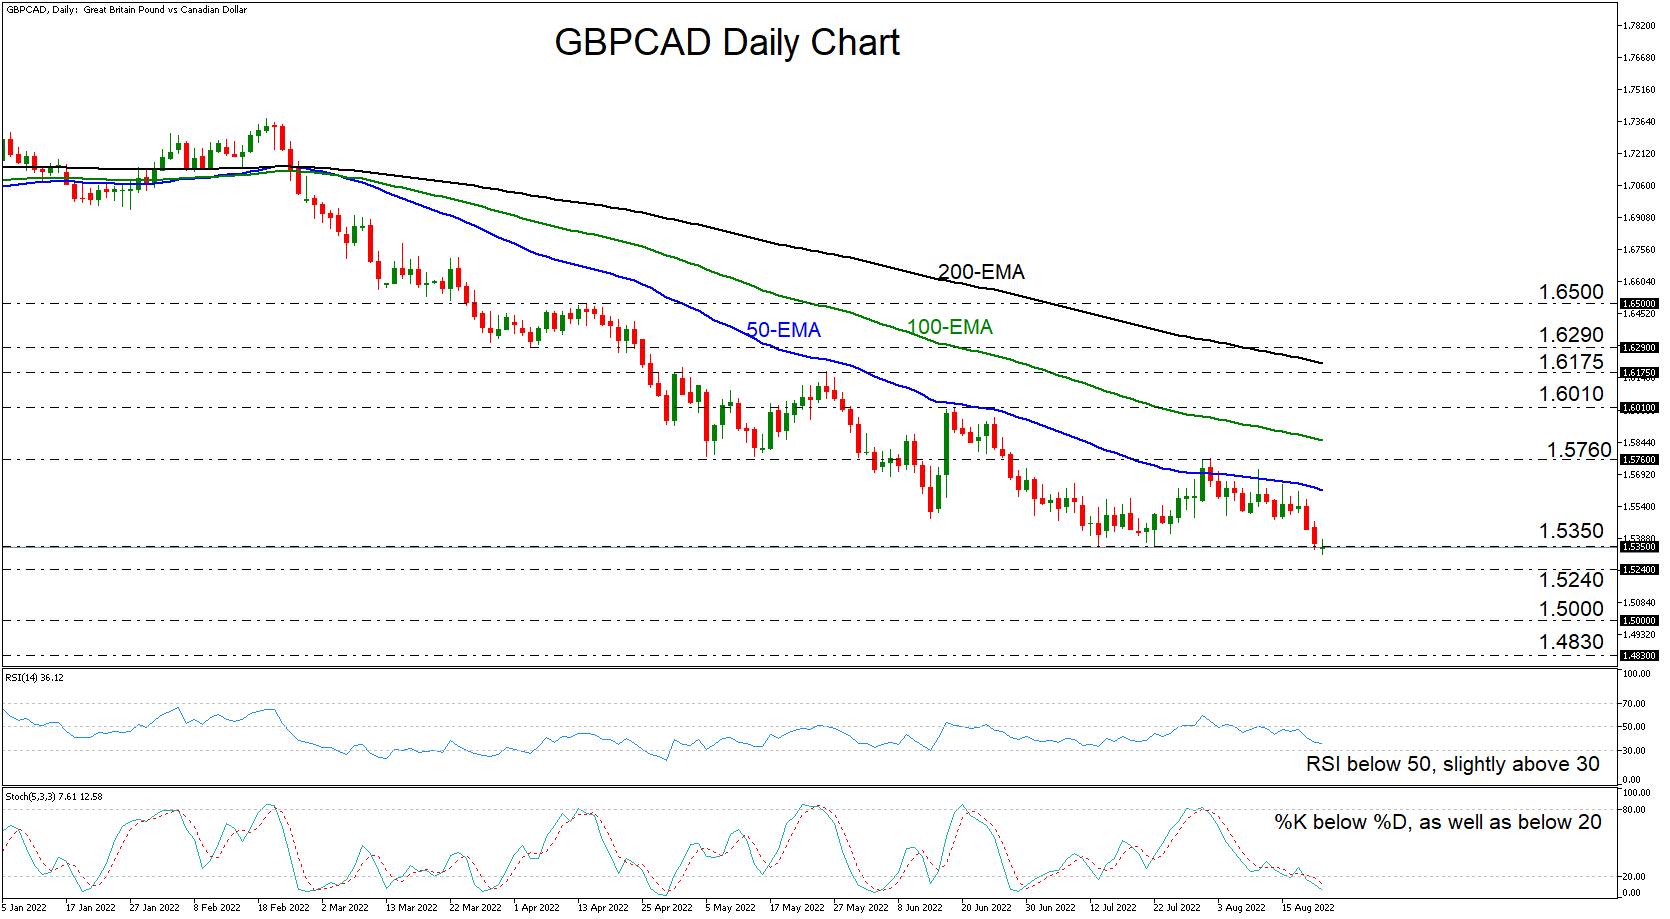
GBPCAD has been drifting south since August 2, when it hit resistance near 1.5760. That said, it has yet to clearly overcome the key support of 1.5350, a move which would not only confirm a forthcoming lower low, but also take the pair into territories last seen back in April 2013. Overall, the trend appears to be to the downside, a narrative supported by the fact that GBPCAD remains below all three of the plotted moving averages.
Our oscillators detect negative momentum, enhancing the case for another lower low very soon. The RSI runs slightly above 30 and points down, while in the stochastic, the %K lies below the %D, as well as below 20.
A clear close below 1.5350 may encourage the bears to flirt with the 1.5240 barrier, which attracted the buyers back in July 2011 and March 2013. If that zone fails to hold this time around, the trend could get extended towards the round figure of 1.5000, or even towards the 1.4830 zone, defined as a support by the lowest point of 2010.
The outlook could brighten upon a break above the 1.5760 barrier, marked by the peak of August 2. This could signal the completion of a double bottom formation on the daily chart, and may encourage advances towards the June 17 peak, at around 1.6010. Should the bulls surpass that obstacle as well, they could then climb towards the peak of May 26, at around 1.6175.
In brief, the broader path of GBPCAD remains to the downside, but before a trend continuation is examined, a clear dip below the key support zone of 1.5350 may be needed.
Euro Slides to 20-Year Low
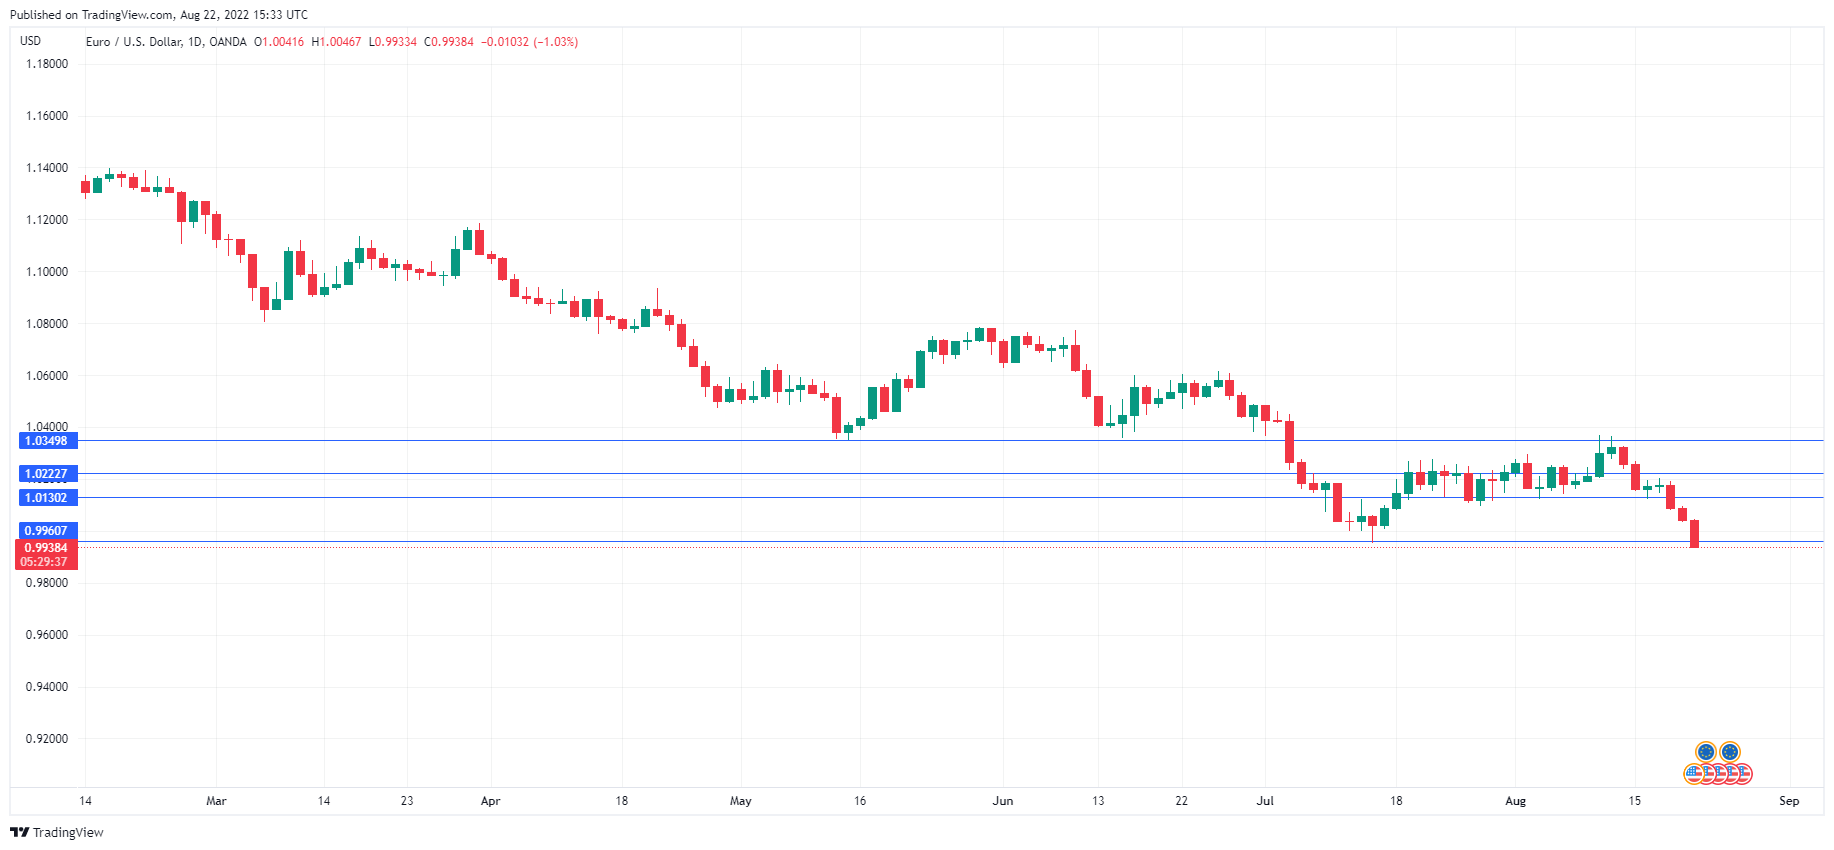
It was a case of the Monday morning blues for the euro. The week started with EUR/USD falling below parity, a psychologically significant line. EUR/USD is currently trading at 0.9951, its lowest level since December 2002.
The US dollar posted gains against all of the major currencies last week and pummelled the euro, which fell by 2.12%. The dollar has found support from market sentiment, as investors are rethinking their views about where the Fed is headed. After the surprise US inflation report for July, which showed a drop in inflation, speculation increased that the Fed would take a dovish pivot after months of aggressive tightening. This boosted the equity markets and sent the US dollar sharply lower. The Fed has insisted that the battle with inflation is far over and that the rate hikes will continue.
We’ll get another chance to hear the Fed’s stance when Jerome Powell addresses the Jackson Hole conference on Friday. The Wyoming resort is often the platform for significant announcements, and Powell’s remarks will be under close scrutiny. Powell may want to sprinkle some dovish comments so as not to sound too pessimistic about the economic outlook, and it’s possible that investors could seize on those comments and ignore the hawkish parts, which would likely boost the equity markets and weigh on the dollar.
The eurozone economy continues to stumble. European energy prices have been soaring, due to a scorching hot summer and concerns that Russia will weaponise energy exports against the bloc. Germany, the largest economy in the eurozone has not been immune to these problems. The services and manufacturing PMIs both indicated contraction in June, and the July numbers are expected to fall further, with estimates of 48.3 for manufacturing and 49.0 for services.
EUR/USD Technical
- EUR/USD is testing support at 0.9959. Below, there is support at 0.9877
- There is resistance at 1.0113 and 1.0223
Crude Oil is Depressed Again
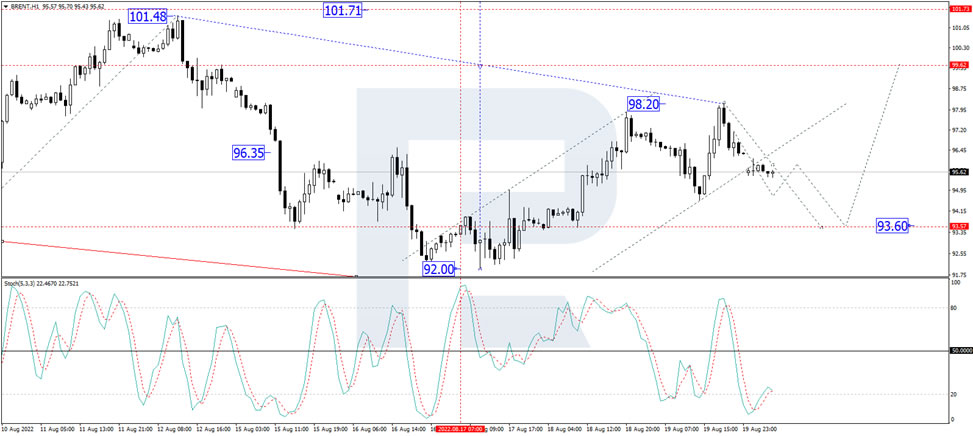
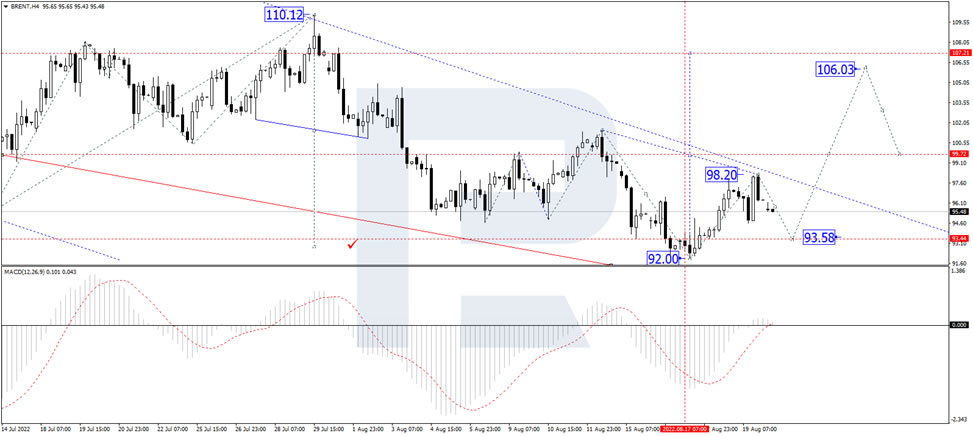
The commodity market remains under bearish control on Monday; Brent is falling to reach $95.45.
Oil is being pressured by the expensive “greenback”, as well as public concerns about a global recession around the world. Today’s economic slump might reduce interest in energies, having a negative impact on prices.
Investors are still waiting for the news on the nuclear deal between the US and Iran. Of course, no rash decisions are expected, but any positive progress would have a positive influence on market sentiment.
According to the CFTC, last week, big-time investors, including hedge funds, decreased their long positions to 290,388 contracts. It’s the lowest number in more than two years. The total long position in futures and options on Brent and WTI dropped to 9-year lows.
On the H4 chart, having completed the first ascending wave at 98.20, Brent is expected to correct down to 93.60 and may later form one more ascending structure with the short-term target at 106.00. After that, the instrument may start another correction towards 99.60 and then resume trading upwards to reach 107.20. From the technical point of view, this scenario is confirmed by the MACD Oscillator: its signal line is moving close to 0 and may yet continue falling. Later, it may grow to break 0 and continue moving to reach new highs.
As we can see in the H1 chart, after finishing the ascending structure at 98.20 and breaking the ascending channel at 95.90, Brent is consolidating around the latter level. Possibly, the asset may extend this correction down to 93.60 and then start another growth with the target at 99.60. And it’s just half of the third ascending wave. From the technical point of view, this idea is confirmed by the Stochastic Oscillator: its signal line is moving near the lows below 20. Later, the line may grow to rebound from 50 and resume falling to return to 20. After that, it may reverse and move to reach new highs.