

Sample Category Title
USD/JPY: Bulls Taking a Breather after Last Week’s 2.6% Rally
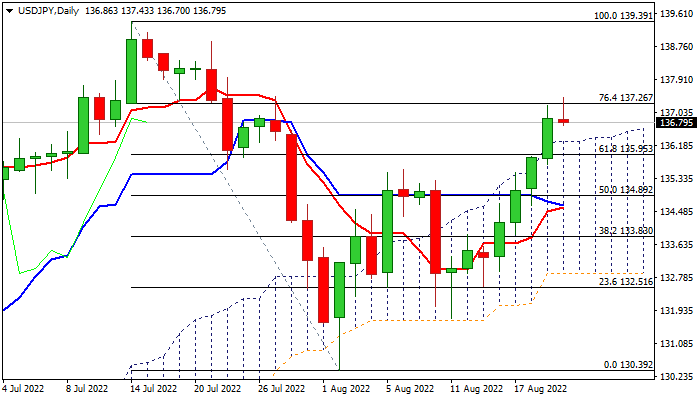
Bulls are consolidating at pivotal Fibo barrier at 137.26 (76.4% of 139.39/130.39 corrective leg) following last week’s 2.6% advance (the biggest weekly advance since the last week of May).
Dollar remains firm in risk aversion environment and looks for retest of 2022 high (139.39, posted on July 14), with shallow consolidation likely to precede final push towards 139.39 target.
Bullish daily studies support the notion, with last Friday’s break and close above thick ascending daily cloud and weekly bullish engulfing pattern, adding to positive signals.
Dips should be ideally contained by cloud top (136.30) and broken Fibo 61.8% (135.95) to keep bulls in play.
Res: 137.43; 137.95; 138.87; 139.39.
Sup: 136.30; 135.93; 135.36; 134.89.
GBP/USD: Violation of Key 1.1760 Support to Risk Test of Pandemic Low at 1.1410
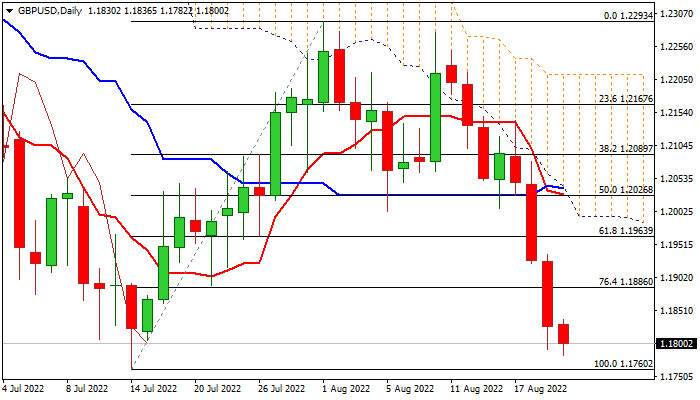
Cable remains firmly in red for the fourth straight day and hits five-week low on probe through 1.18 handle in European trading on Monday.
Bears look for retest of 2022 low at 1.1760, break of which would risk fresh extension towards pandemic low at 1.1410 (Mar 2020).
Firmly bearish techs on daily and weekly chart add weak to sentiment on negative fundamentals and darkened economic outlook, though bears may struggle to clear 1.1760 pivot, as daily studies are oversold.
Consolidation should be ideally capped by broken Fibo 76.4% at 1.1886, with stronger bounce to stall under pivotal 1.20 resistance zone (psychological / base of thick daily cloud) and keep bears in play.
Res: 1.1836; 1.1886; 1.1963; 1.2000.
Sup: 1.1782; 1.1760; 1.1700; 1.1634.
Nervously Awaiting Jackson Hole
Stock markets are off to a bad start on Monday as investors question whether the recovery trade has gone too far.
Last week brought an end to the late summer winning streak that saw stock markets recover a significant - and some would argue overly so - portion of the losses endured this year. And it seems that has set the tone going into this week, with Asia and Europe posting losses of more than 1% and US futures pointing to a similar open.
Naturally, all eyes are on Jackson Hole later in the week and in particular, the appearance of Fed Chair Jerome Powell. This platform has in the past been used to make significant announcements and so every year, traders are left on the edge of their seats in case of another this time around.
This year could be an anticlimax on that front as the Fed's message has been clear since it pivoted to a data-driven approach in July. The markets viewed this as a dovish pivot and policymakers have since pushed back, not helped by the softer inflation data that further fueled the speculation.
With that in mind, the expectation is still that Powell will reaffirm what he and his colleagues have been saying in public recently, without giving too much away ahead of the September meeting, before which we'll get another inflation and jobs report. The risk is that he says something dovish - intentionally or otherwise - after investors position for the opposite and triggers another risk-on rally in the markets.
European gas surges amid new maintenance plans
Further knocking sentiment in the markets this morning are reports of Nord Stream 1 being shut down again for maintenance later this month. The three-day pause will once again raise fears that the Kremlin will weaponise gas supplies and use the maintenance as an excuse not to resume flows. With storage still below where the EU wants going into the winter, that means a greater risk of shortages and much higher prices, as we're already seeing this morning with European gas trading up more than 15%.
China rate cut targeted but likely not enough
Meanwhile, China cut its one and five-year loan prime rates on Monday, a move that was expected given the cuts to the reverse repo and MLF rates last week. The composition of the cuts was not quite as expected though, with the one-year cut by only five basis points to 3.65% and the five-year cut by 15bps to 4.3%. This suggests it was very much a move targeted at the ailing property market amid developer struggles and mortgage boycotts.
The problem is that the damage to the property market on top of Covid lockdowns has hit confidence and this cut is unlikely to stimulate demand. Whether the PBOC is up to doing more given the global inflation backdrop isn't clear.
Oil choppy as traders await JCPOA decision
Oil prices are off more than 1% this morning as choppy trade continues. There remain many factors influencing the oil price right now from a tight market to a diminishing growth outlook and a potential Iran nuclear deal. The prospects for the latter could become clearer over the course of this week although that has been suggested many times this year and yet here we are. We could see WTI remain choppy around $90 and Brent hover above $92 for a little while longer yet.
Gold pushed back further but faces a big test of support
Gold remains on the backfoot amid a resurgent dollar as 10-year Treasuries continue to creep back towards 3% and the two-year hovers around its June highs. Traders are naturally looking for clarity from Powell's Jackson Hole appearance later this week and seem to think it's going to come in the form of hawkish warnings. That has dampened sentiment in the yellow metal which has been further pushed back from its recent peak above $1,800 and now trades around the 61.8% retracement level from its July lows to August highs. A good test for overall sentiment in gold.
Bitcoin vulnerable ahead of Powell's appearance
Bitcoin had a terrible end to last week, falling almost 10% before almost reaching $20,000 over the weekend. Sentiment was looking fragile going into the session, with rallies seeing weakening momentum on approach to $25,000 but a sudden sharp drop of that magnitude still came as quite the surprise. The fact that it's struggled to recoup much of those losses doesn't bode well either. The crypto community may well be hoping for a favour from Jerome Powell later this week, with bitcoin looking vulnerable around $20,000 once more.
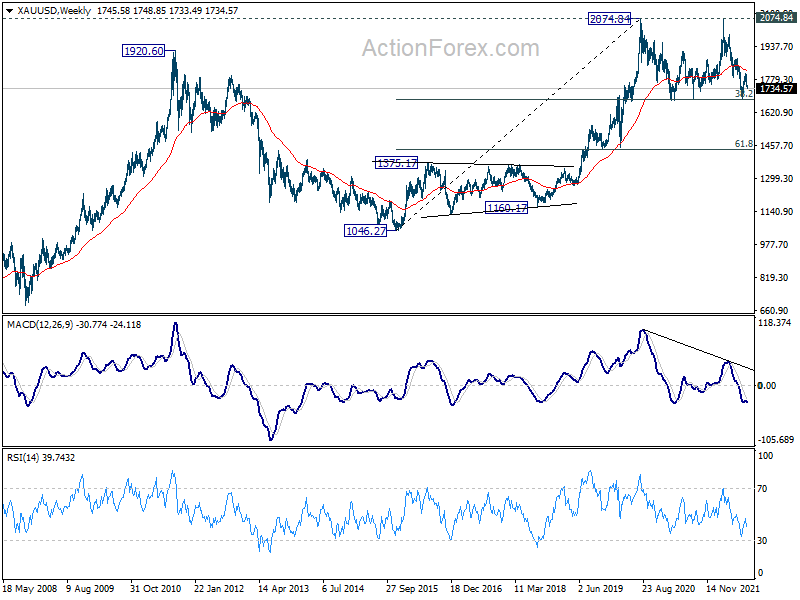
Gold’s accelerates down, 1700 vulnerable
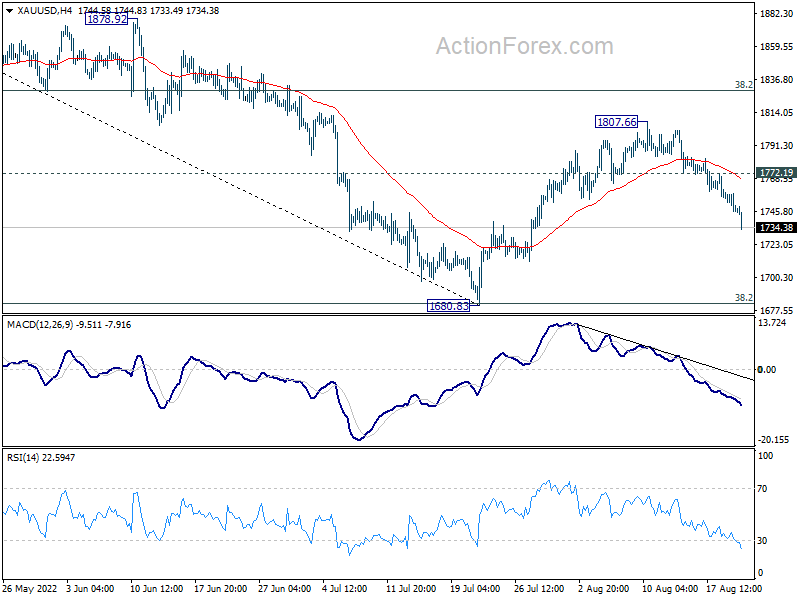
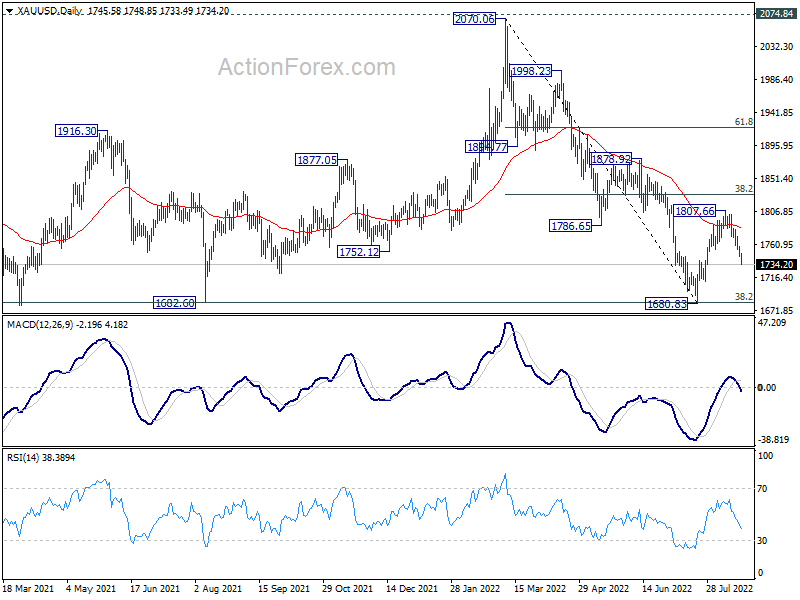
Gold's decline from 1807.66 extends further today, on the back on broad based strength in Dollar. The downside accelerations argue that rebound from 1680.83 has completed at 1806.66 already. Deeper fall is likely through 1700 handle.
Nevertheless, strong support is still mildly in favor at around 1680.83 low to contain downside. Above 1772.19 minor resistance should resume the rebound through 1807.66.
However, the rejections by 55 day EMA, and below 55 week EMA are both rather bearish signal. Firm break of 1680.83 cluster support will complete a medium term double top pattern (2074.84, 2070.06). That could prompt deeper selloff to 61.8% retracement of 1046.27 to 2074.84 at 1439.18.
USD/CNH: Cycle Correction Completion Coming Up
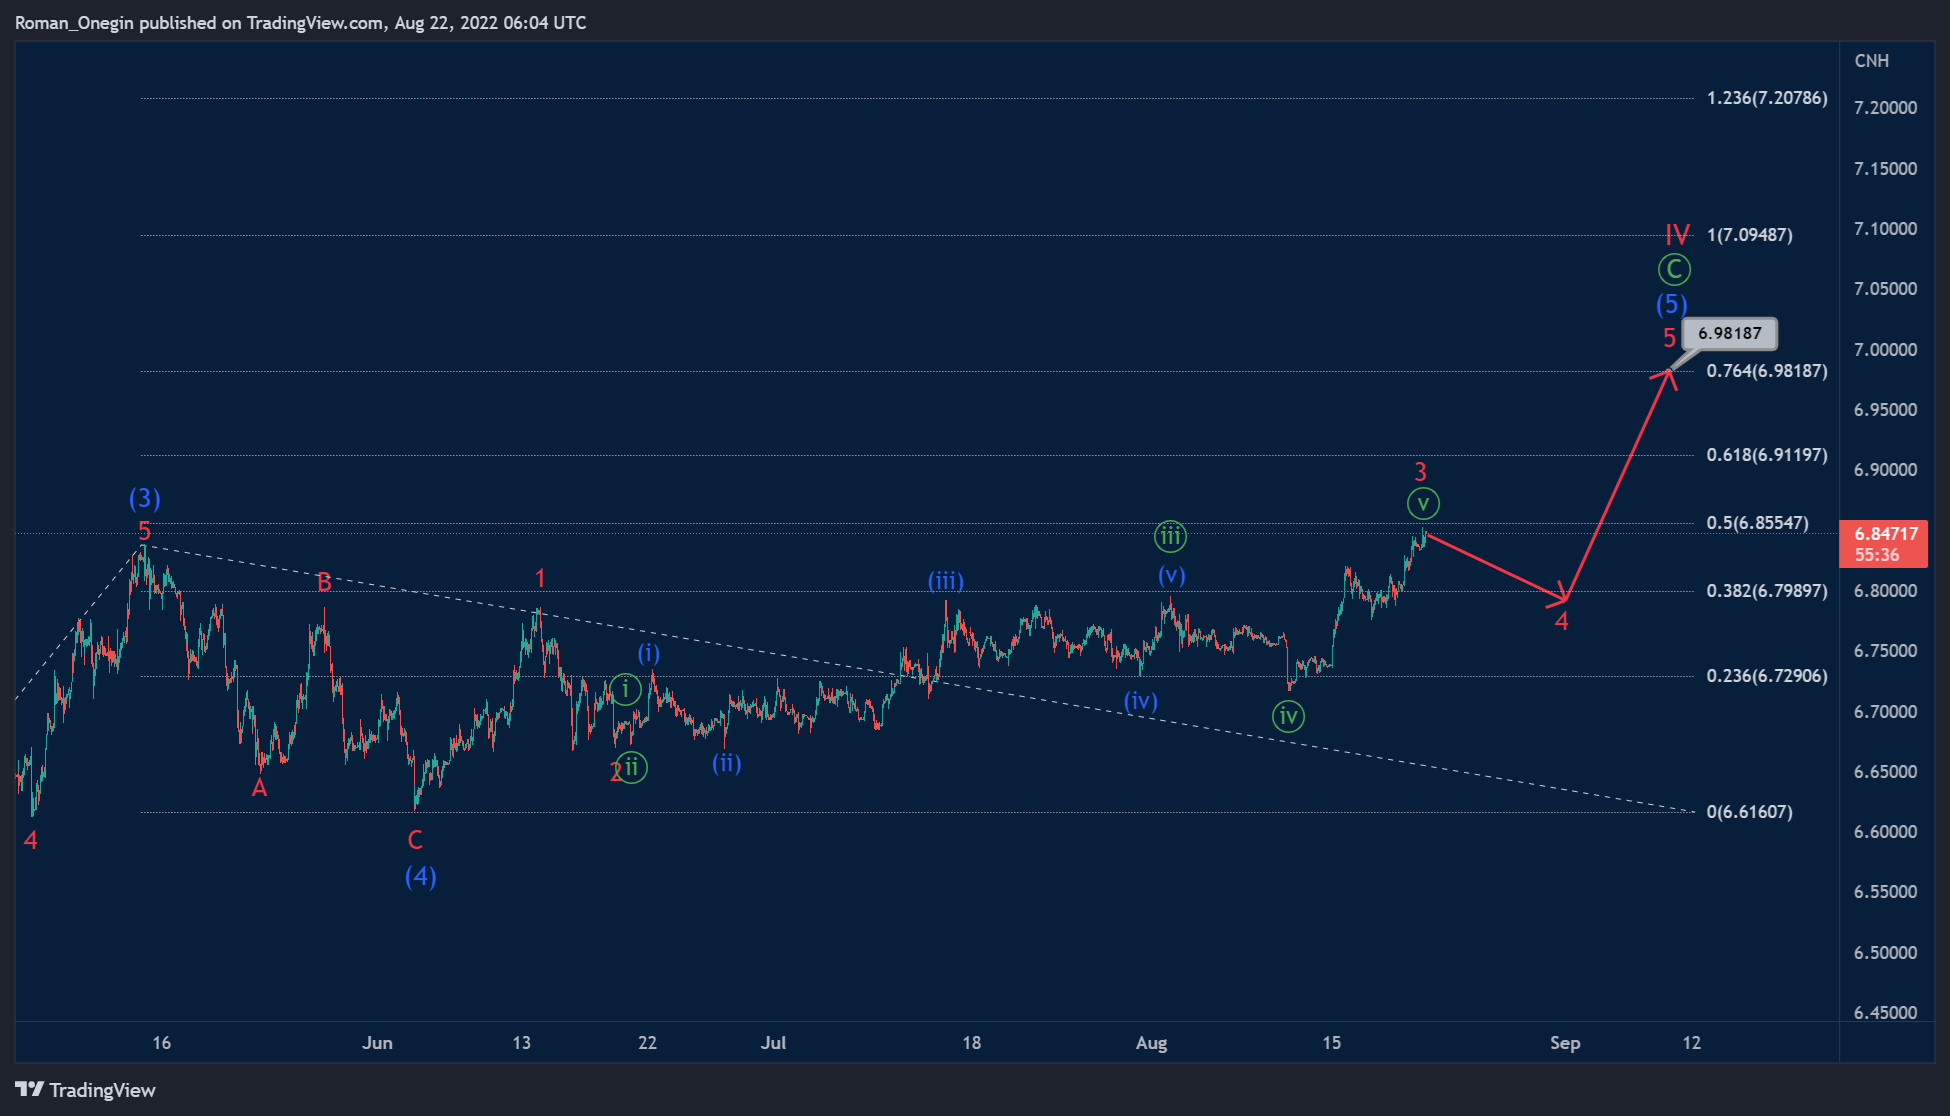
The USDCNH formation shows the primary zigzag pattern Ⓐ-Ⓑ-Ⓒ, which in the long term seems to be forming a cycle correction IV. This pattern today looks completed in two parts out of three.
The last primary wave Ⓒ takes the form of an intermediate 5-wave impulse (1)-(2)-(3)-(4)-(5).
Perhaps the last intermediate wave (5) is currently under development. It is assumed that it will take the form of a minor impulse 1-2-3-4-5. For its full completion, two parts are needed – sub-waves 4 and 5. Growth in these parts is possible to the level of 6.981.
At that level, sub-wave (5) will be at 76.4% of wave (3).
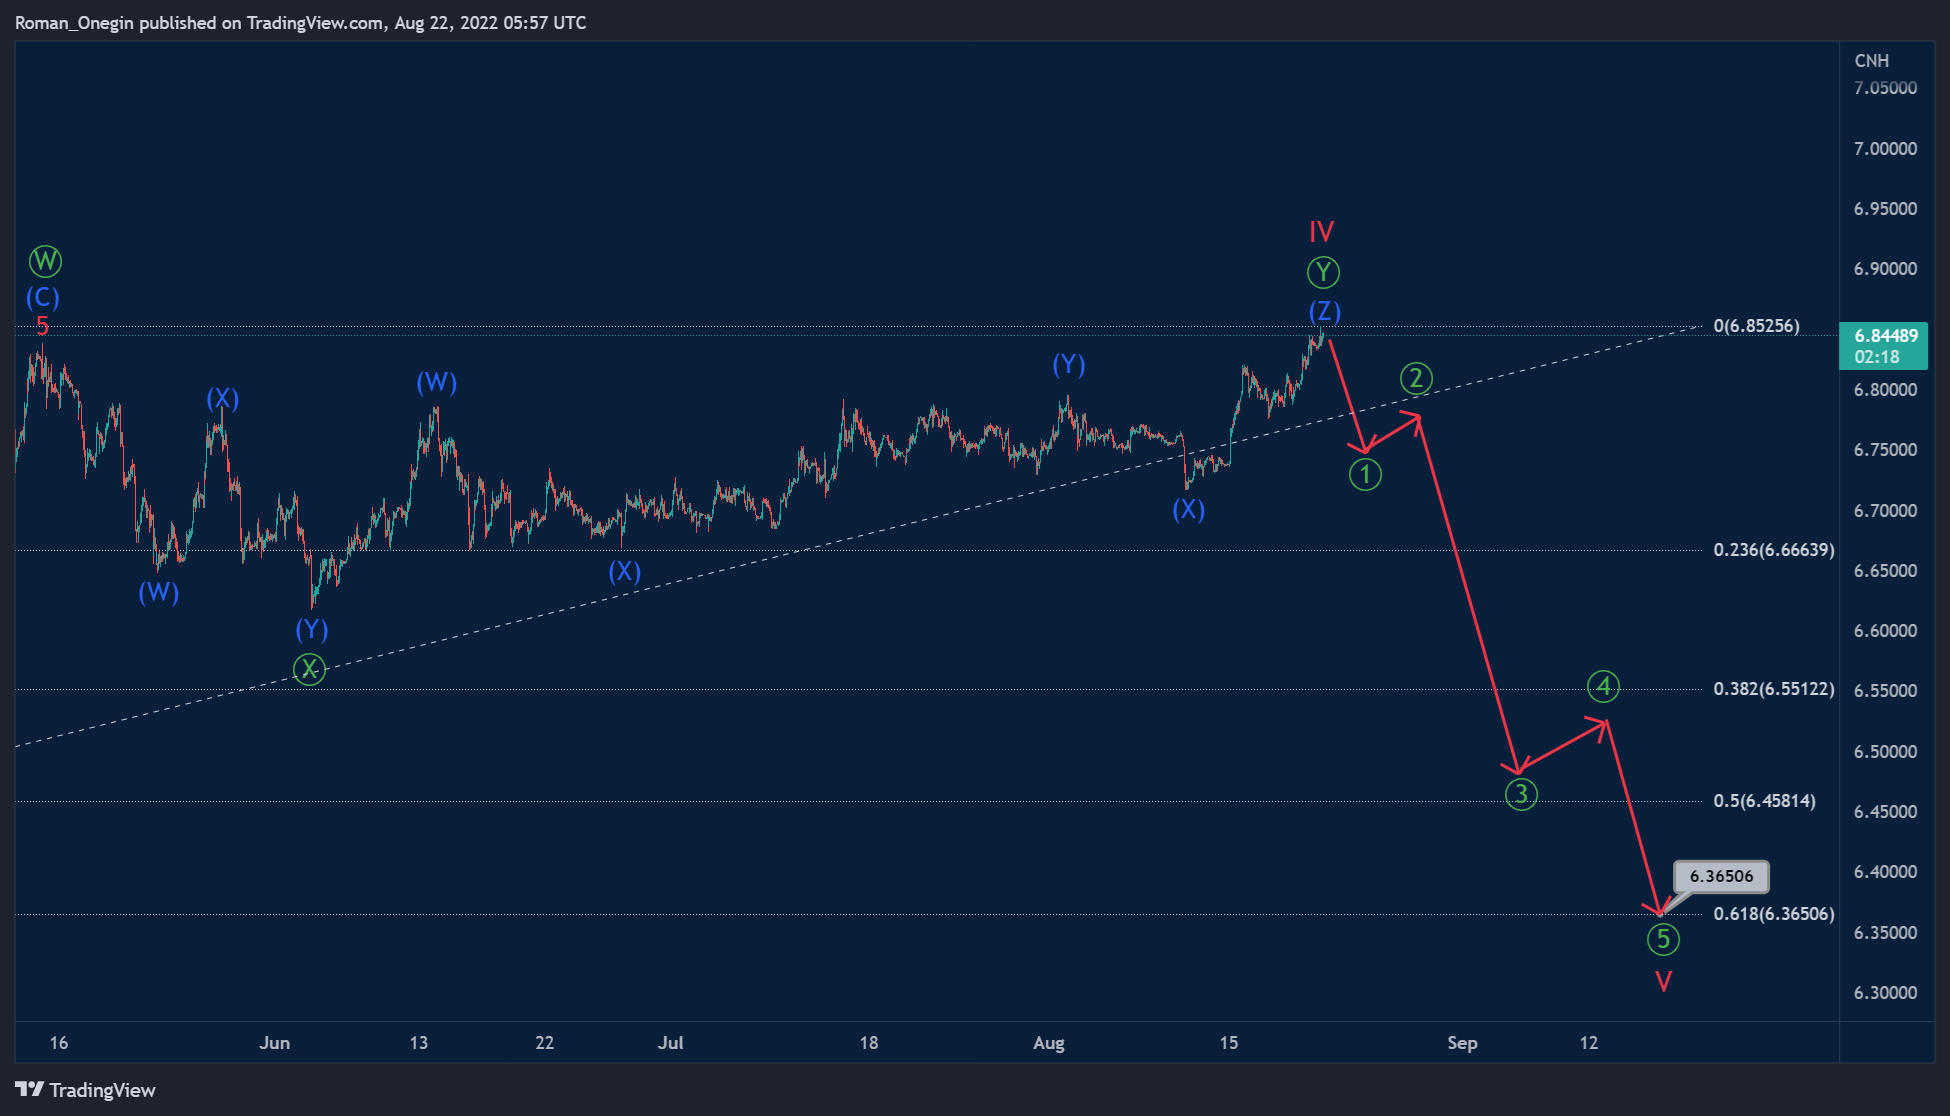
An alternative option shows that the construction of the entire cycle correction IV has already been completed. It took the form not of a simple zigzag, but of a double zigzag consisting of primary sub-waves Ⓦ-Ⓧ-Ⓨ.
Thus, if this assumption is correct, the market may begin to move in a downward direction, forming the final cycle wave V.
Most likely, wave V will have the form of a primary impulse, as shown in the chart. And it will complete its pattern near 6.365. At that level, sub-wave V will be at 61.8% of impulse III (it is not visible on the chart).
Gold Retreats Back Near Falling Trend Line; Maintains Bearish Bias
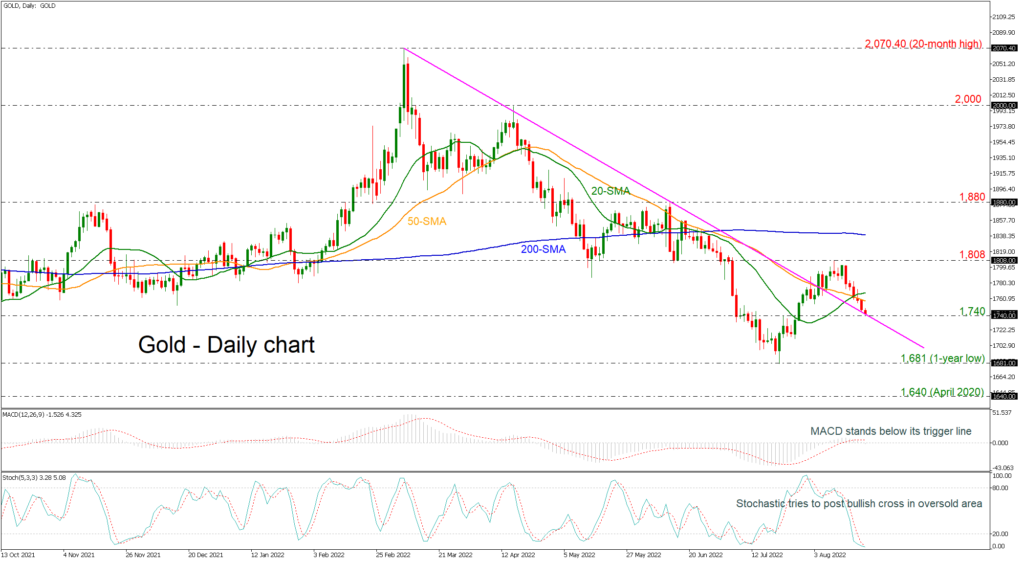
Gold prices remain under pressure and risk is still to the downside as prices continue to drift lower from the 1,808 level. The commodity is re-testing the downtrend line that broke at the beginning of the month, signifying a continuation of the descending movement.
The short-term technical indicators are in bearish territory, with the MACD standing below its trigger line; however, the stochastic oscillator is suggesting an oversold market as it is ready to post a bullish cross within its %K and %D lines. Prices are looking capped by the 20 and 40-day simple moving averages (SMAs) which are negatively aligned after a bullish crossover that took place on August 17.
The next target to the downside is the one-year low of 1,681 if there is a move below the downtrend line. At this stage the market would likely see a resumption of the descending view from the 2,070.40 peak and put in place a lower low at 1,640, registered in April 2020.
Upside moves are likely to find resistance at 1,808 but first needs to surpass the SMAs. There is an important resistance zone between the 200-day SMA at 1,840 ahead of the 1,880 resistance.
In the short-term, the bearish phase remains in play especially if gold prices continue to trade below the SMAs.
US 500 Retreats after Hitting 200-Day SMA
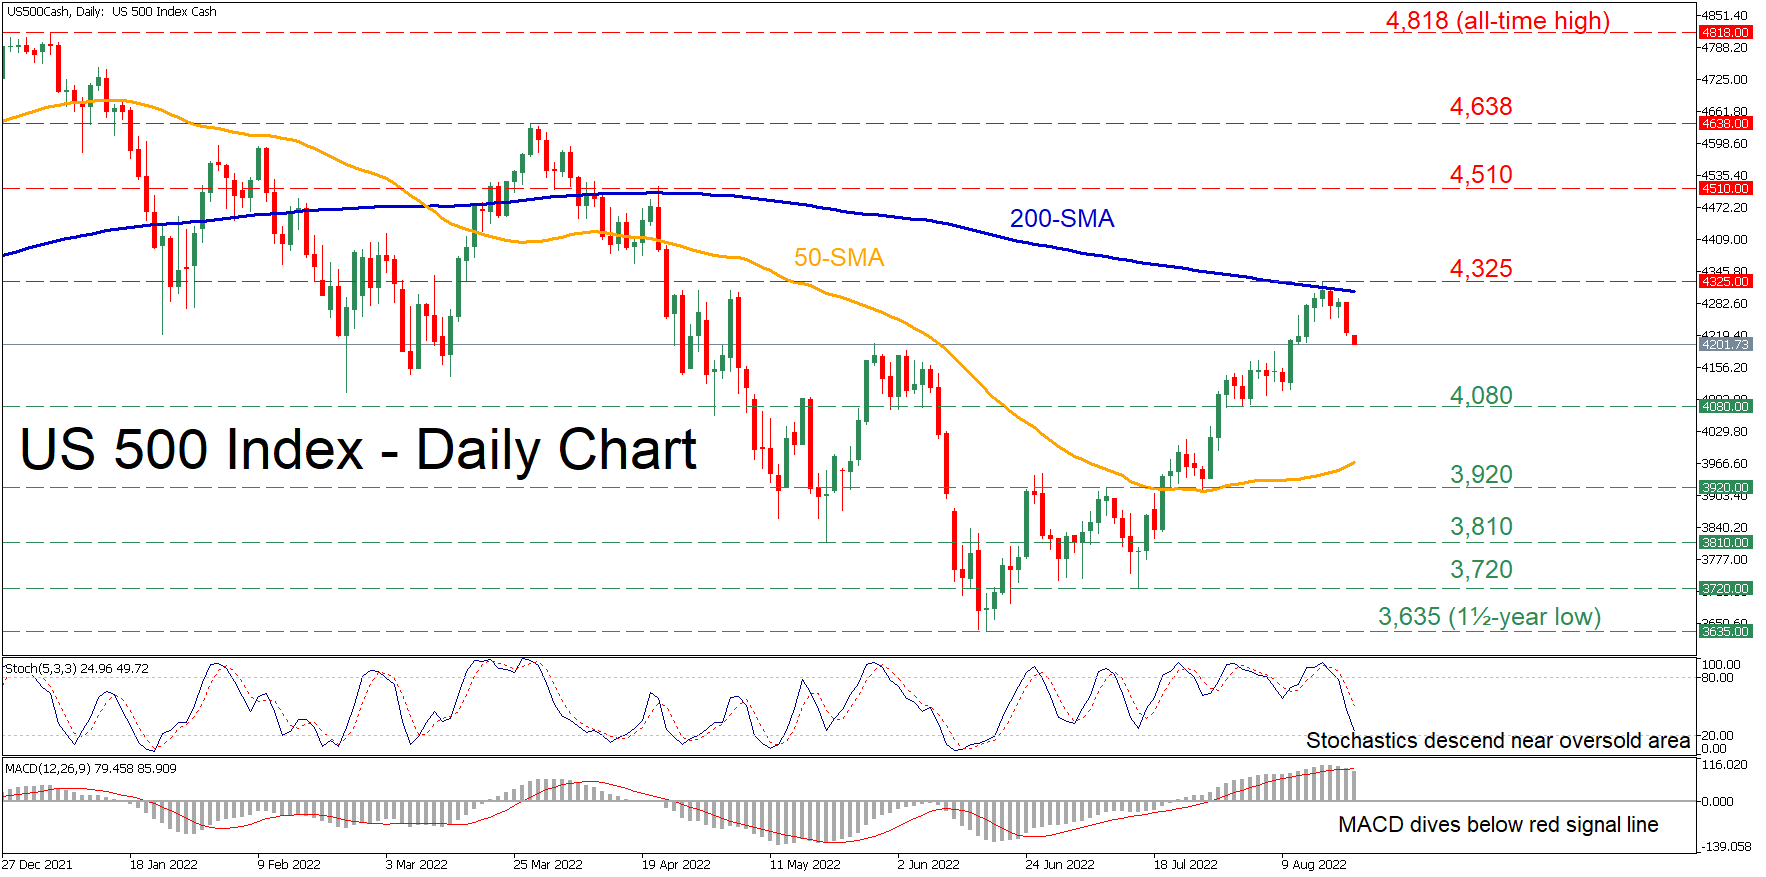
The US 500 stock index (cash) has been in a sustained uptrend after finding its feet at the 1½ -year low of 3,635. However, the price has exhibited a downside correction since it failed to cross above the 200-day simple moving average (SMA) and is currently hovering around the May peak levels.
The momentum indicators are endorsing the recent retracement. Specifically, the stochastic oscillator is descending close to the oversold zone, while the MACD histogram has crossed beneath its red signal line.
To the downside, should the weakness persist, immediate support could be encountered at the recent low of 4,080. Sliding beneath that floor, the index could descend towards 3,920 or lower to test the May low of 3,810. Any further declines may then cease at the July support of 3,720.
On the flipside, if negative momentum wanes and the price drifts higher, the recent reversal point of 4,325 might act as the first line of defence. Piercing through this region, the bulls could aim for 4,510 before the March peak of 4,638 appears on the radar. A violation of the latter could open the door for the all-time high of 4,818.
Overall, even though the US 500 index’s rebound appears to be running out of steam, it is still too early to call for a reversal of the short-term uptrend. Hence, a profound close above the 200-day SMA could signal the resumption of the recovery.
EURUSD Looks Unfortunate as Sell-off Nears Parity Again
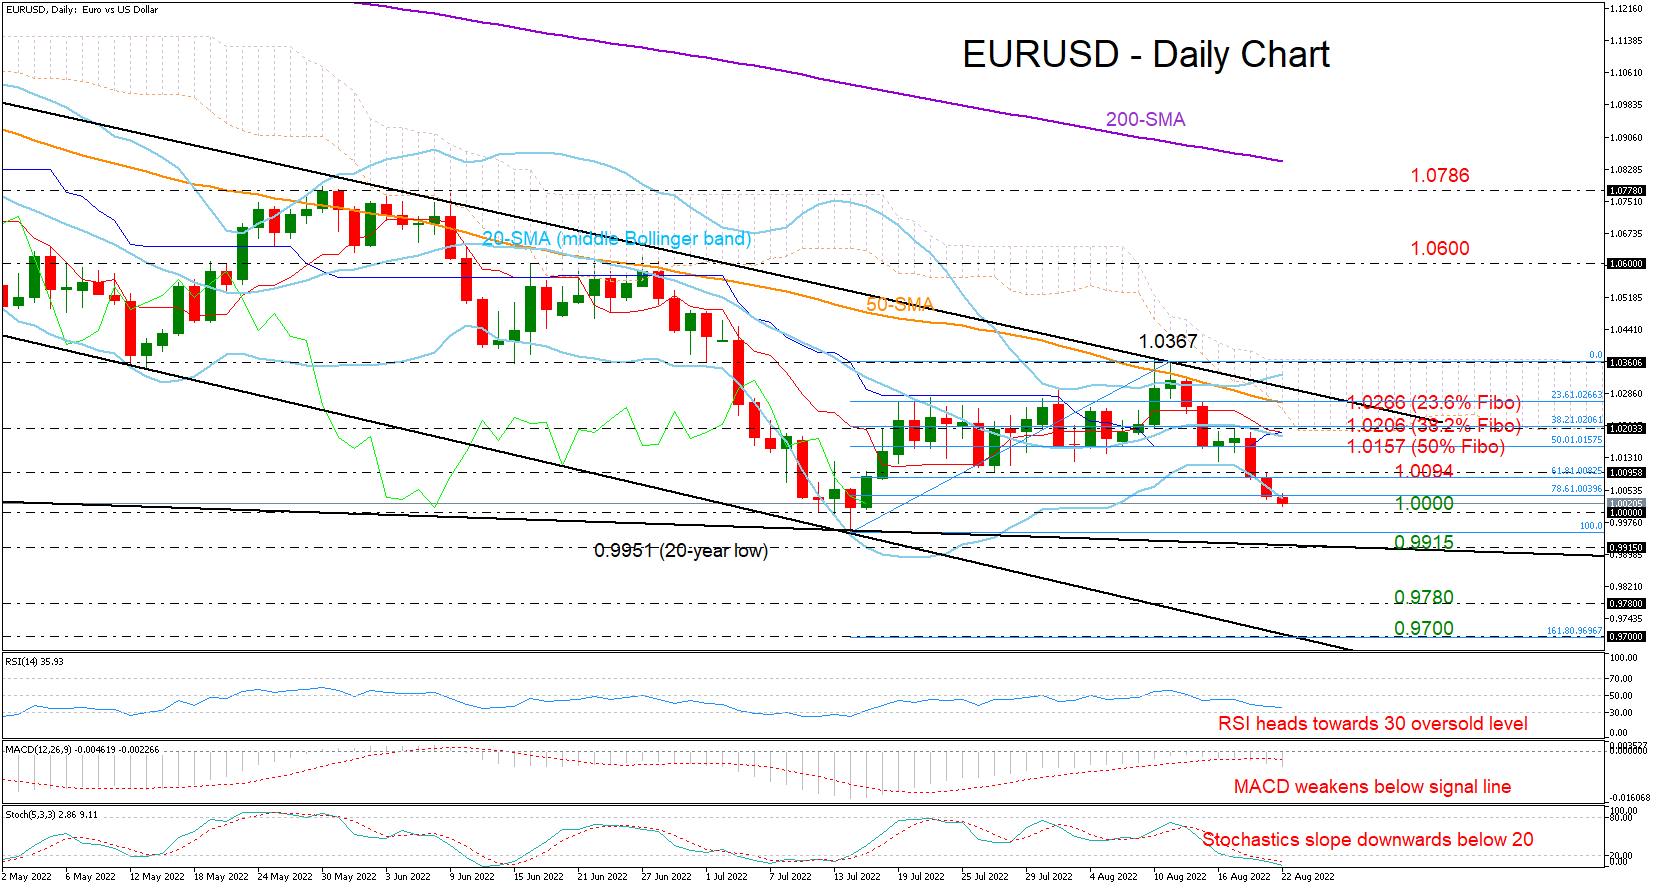
EURUSD was sliding towards the critical 1.0000 level during Monday’s early European trading hours, which the bears could not successfully claim in mid-July. The move comes after the failure to climb above the 20-day simple moving average (SMA) and the 1.0200 number last week.
Previously, the pair could not find enough buyers to exit the 2022 downward-sloping channel either, with the momentum indicators currently foreseeing more bearish episodes ahead. Although the price closed marginally below the lower Bollinger band on Friday, signaling oversold conditions, the stochastics have yet to post a bearish cross below 20, while the RSI has some distance to run till the 30 mark. The MACD also seems to be starting a new bearish wave below its red signal line.
If sellers manage to dominate below parity, violating the support line at 0.9915 too, which connects all the lows from August 2018, the downtrend could gain significant momentum towards the 0.9780 – 0.9700 constraining zone last active during the 2000-2002 period. The channel’s bottom line is also in the neighborhood, adding extra importance to the region. Should the negative outlook further worsen from here, the spotlight will immediately shift to the September 2002 trough of 0.9600.
Otherwise, another bounce on 1.0000 may initially push for a close above Friday’s resistance at 1.0094 with scope to reach the 1.0157 – 1.0206 border, formed by the 50% and 38.2% Fibonacci levels of the latest upleg. The area also encapsulates the 20-day SMA and the lower limit of the Ichimoku cloud. Hence, any violation of this territory could send the pair directly up to the 50-day SMA currently lying around the 23.6% Fibonacci of 1.0266 and the channel’s upper limit at 1.0294.
In brief, the ongoing bearish wave in EURUSD is expected to persist in the short term, with traders likely waiting for a clear break below the 1.0000 – 0.9915 area to further reduce exposure in the market.
Daily Technical Analysis
EUR/USD
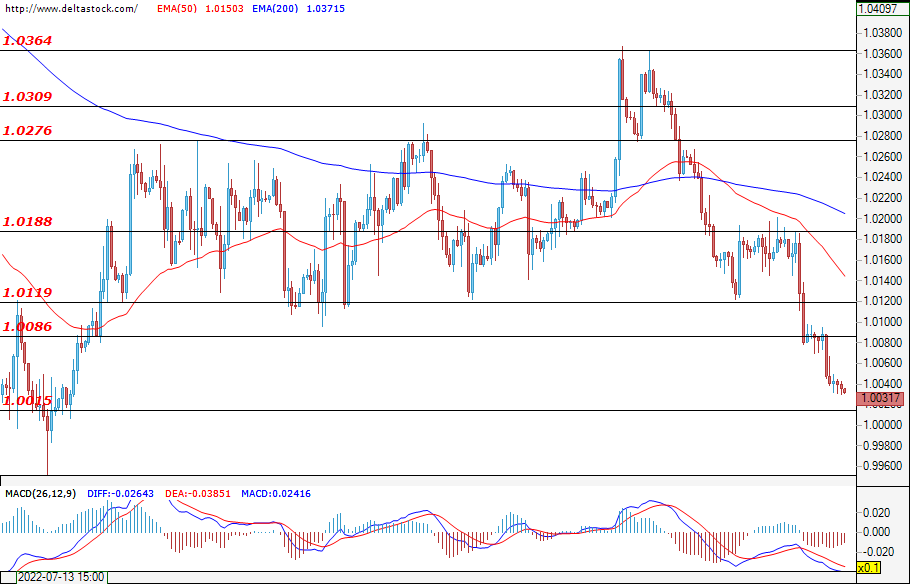
After the successful breach of the zone at 1.0086, the European common currency continued to depreciate against the dollar, and during the early hours of today`s trading, the pair is looking to test the important support at 1.0015. A successful violation of the mentioned level could easily lead to new losses and would strengthen the negative expectations for the future path of the pair. If the bulls enter the market, then their first target for them could be found at the level at 1.0086, which is currently acting as resistance. A breach of the next zone at 1.0119 could start a larger correction towards the major resistance at 1.0188. Among the most anticipated news will be the release of the data for the U.S. GDP and the initial jobless claims (Thursday; 12:30 GMT), as well as the Jackson Hole symposium (25-27 August).
GBP/USD
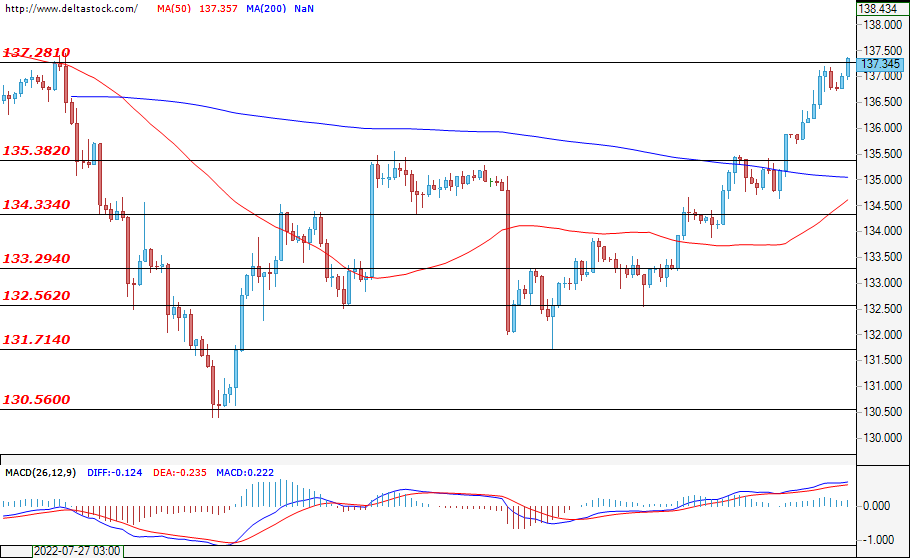
The U.S. dollar recovered most of its losses against the yen from the end of last month, and at the time of writing, the pair is testing the local high at 137.28. If the bullish attack continues, then a confirmation of the breach for the buyers could lead to a rally and could easily lead to a rally towards the levels at around 138.00. If the bears prevail, then the expectations are for a correction and test of the support at 135.38. A successful violation of the zone at 134.33, followed by a breach of the lower level at 133.29, could lead to a change in the current sentiment of the market participants.
USD/JPY
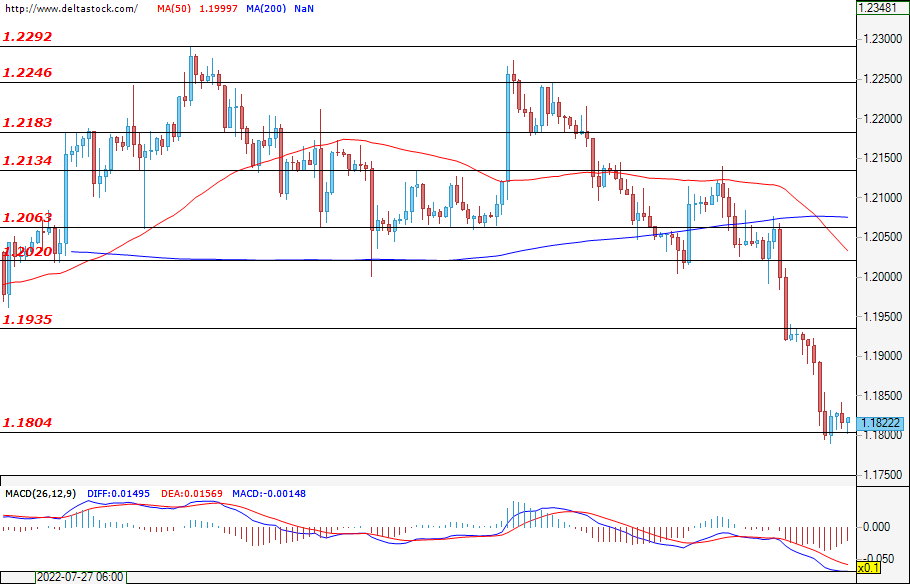
The appreciation of the dollar against most of the world's major currencies led to new losses for the Cable, and after the test of the support at 1.1804, the pair consolidated above the mentioned zone. If the bears gain enough momentum, then a successful violation here could easily continue the depreciation and could lead to a move towards the lows from July at around 1.1760. If the bulls prevail, then the first resistance for them would be the level at 1.1935, followed by the upper target at 1.2020.
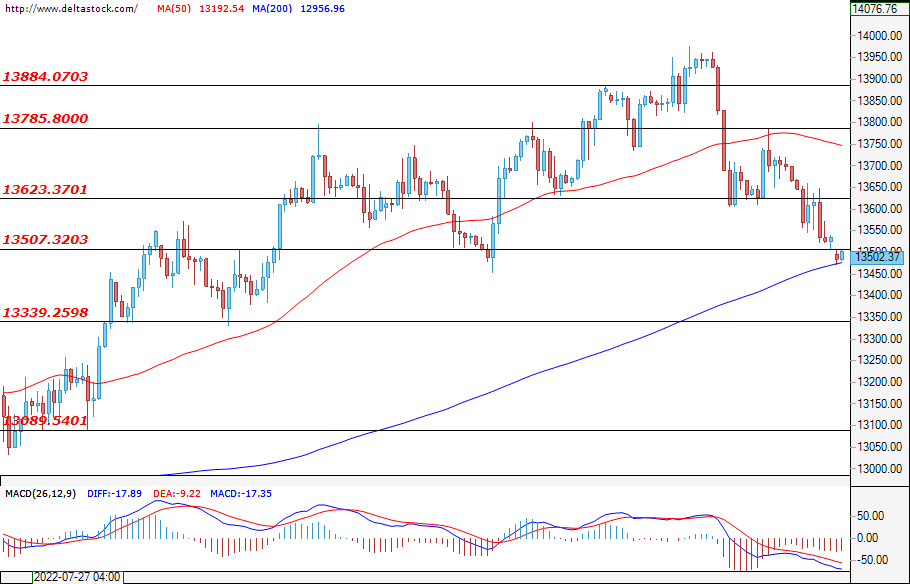
EUGERMANY40
The test of the support at 13507 was not successful, and after the negative start of the trading week for the German index, the price held above the mentioned zone. If the bulls prevail, then an attempt for a breach of the resistance zone at 13623 is a highly probable scenario. However, only a violation of the zone at 13785, followed by a breach of the upper one at 13884, could form the current move as corrective and could spark a new rally towards 14000. If the bears enter the market, then a successful test of the support at 13339 could easily deepen the depreciation and lead to a decline towards 13089.
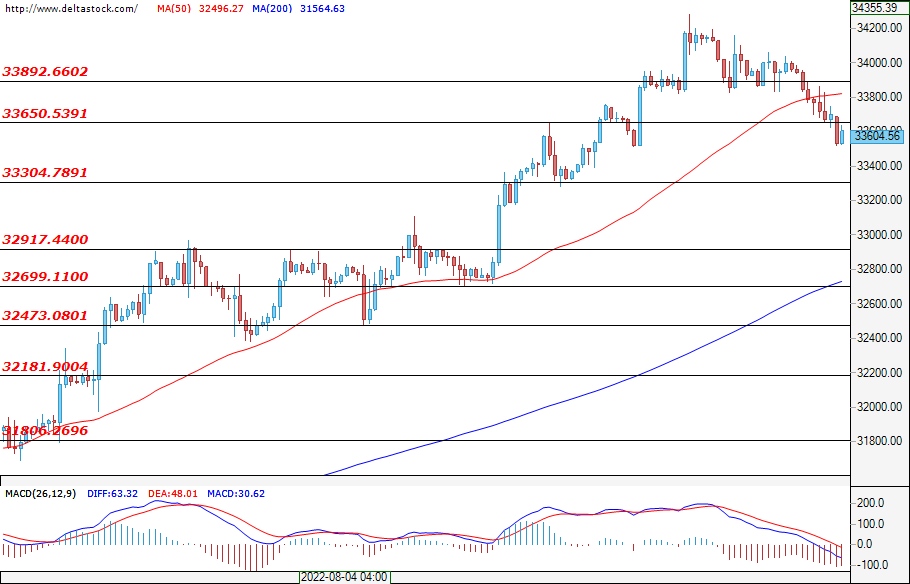
US30
The U.S. blue-chip index continued to decline, and after the breach of the support zone at 33650, the price consolidated at around the current level at 33604. If the bearish attack continues, then a successful test of the zone at 33304 could easily deepen the sell-off towards the important support at 32917. Better-than-expected GDP data for the U.S. and a positive initial jobless claims report (Thursday; 12:30 GMT) could help the bulls prevail. Their first target is the zone at 33650, which is now acting as resistance. A violation of the upper level at 33892 could strengthen the positive expectations and could easily lead the price towards the highs from April at around 35315.
Preliminary Global Manufacturing PMIs for July
For traders looking to see where the markets might be headed for the rest of the month, tomorrow's data might be the sentiment catalyst. PMIs are the freshest data, and they are especially relevant now as investors grade the impact of central bank policy on the economy.
If we get a rash of good PMI data, it could propel risk sentiment higher, depress the dollar and support emerging markets. If flash PMIs were to disappoint, then the downturn in the markets seen at the end of last week could accelerate. Keep in mind this is preliminary data, and at the start of next month there could be revisions.
What to look out for:
Australia:
The consensus is for a mixed bag down under, but in general staying in expansion. Commodity prices have been on the back foot, but the major exporter to China appears to continue to outperform its global peers. Australian Manufacturing PMI is expected to slip a bit to 55.0 from 55.7, while services PMI is expected to advance by the minimum to 51.0 from 50.9 prior.
France:
As usual, being the first to report out of the shared economy, it could set the tone for Europe. With energy prices increasing faster in France than in Germany, worries about industrial performance through the winter have been rising. French Manufacturing PMI is expected to slip further into contraction down to 48.9 from 49.5 previously. Services PMI is expected to remain in positive but decline as well to 52.5 from 53.2.
Germany:
If the largest economy in the EuroZone has a different result than France's, it could shift market sentiment. However, growing concerns over energy supply is expected to keep optimism under pressure. Just this morning it was announced that Nord Stream 1 would be shut again for 3 days, after German officials confirmed nuclear power plants wouldn't be extended. German Manufacturing PMI is expected to fall lower than France's to 48.3 compared to 49.3 prior. Services is also expected to fall further into contraction at 49.0 from 49.7 prior.
EuroZone:
Likely won't impact markets unless other countries manage to substantially differ from the two largest economies. Manufacturing PMI is expected to be further in contraction to 49.0 from 49.9, while Services PMI is expected to stay in expansion by barely at 50.5 compared to 51.2.
UK:
Britain is expected to keep challenging the trend in Europe and stay substantially in expansion despite officials worried that a recession is imminent. While the UK is expected to face cost of living pressure from energy supply issues, there is yet no expected need to plan for industrial shutdowns as is the case on the Continent. Nevertheless, optimism is expected to wane a bit. Manufacturing PMI is forecast to come in at 51.3 compared to 52.1 prior and Services PMI is forecast to slip to 52.0 from 52.6 prior.
US:
The US is expected to buck the trend, with manufacturing staying in expansion while services improves but stays in contraction. American industries might be expected to pick up some of the potential impact from energy issues in Europe. But tighter Fed policy and potential NBER might officially declare a recession, it could weigh on consumer sentiment, even as retail sales continue to slide. Manufacturing PMI is forecast at 51.9 compared to 52.2 prior, a minor reduction in optimism. Services PMI is expected to advance substantially to 49.1 compared to 47.3 prior.