Sample Category Title
USD/CAD Daily Outlook
Daily Pivots: (S1) 1.2896; (P) 1.2932; (R1) 1.2982; More...
Intraday bias in USD/CAD remains mildly on the upside at this point. Corrective decline from 1.3222 should have completed with three waves down to 1.2726. Further rally would be seen back to retest 1.3222 high. On the downside, break of 1.2879 minor support will mix up the outlook and turn intraday bias neutral again.
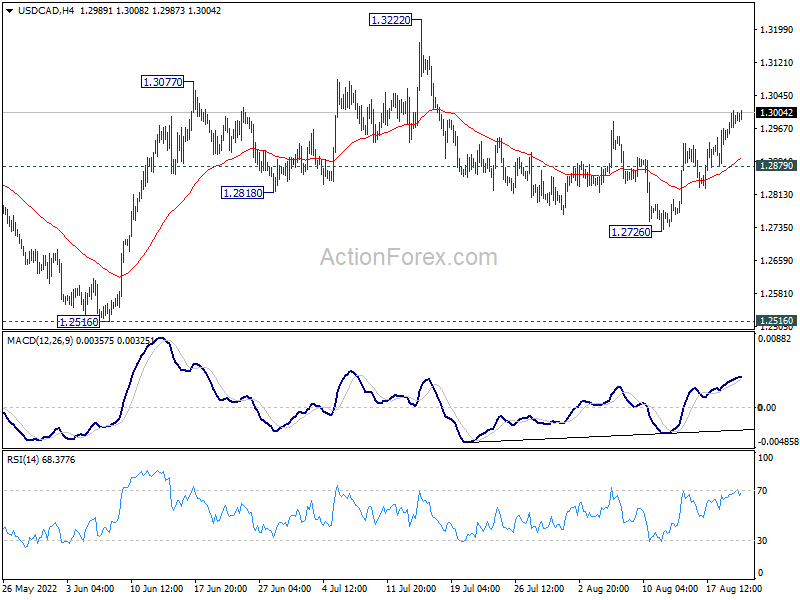
In the bigger picture, down trend from 1.4667 (2020 high) should have completed at 1.2005, after defending 1.2061 long term cluster support. Rise from there should target 61.8% retracement of 1.4667 to 1.2005 (2021 low) at 1.3650. This will remain the favored case now as long as 1.2516 support holds.
EUR/CHF Daily Outlook
Daily Pivots: (S1) 0.9603; (P) 0.9637; (R1) 0.9660; More....
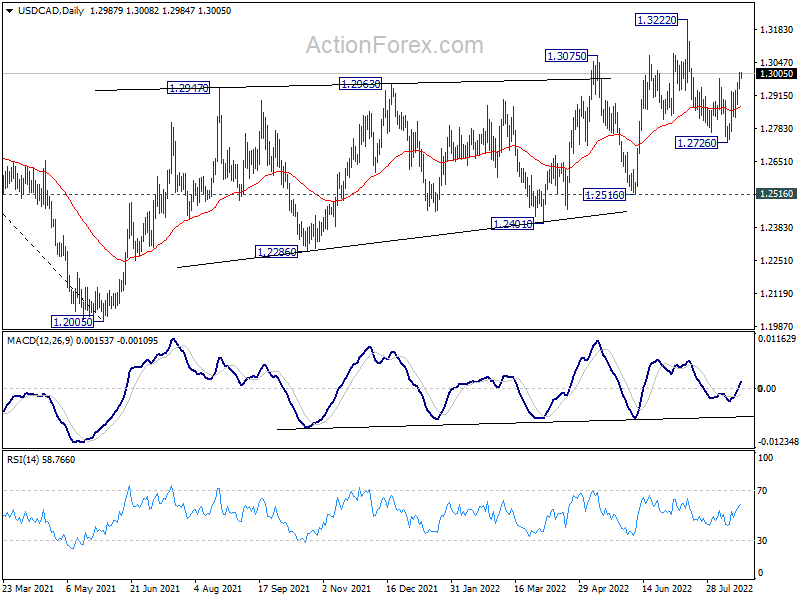
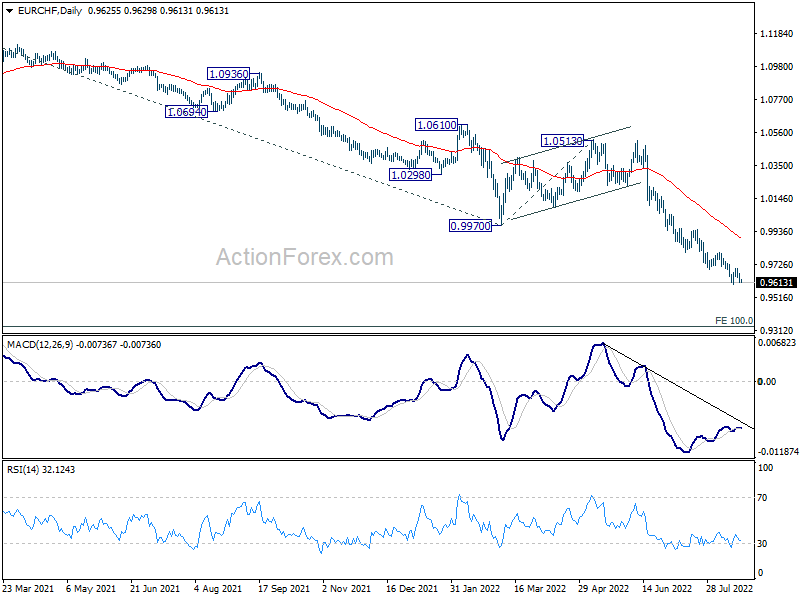
Intraday bias in EUR/CHF remains neutral at this point. In case of another recovery, upside should be limited well below 0.9948 resistance to bring another fall. On the downside, break of 0.9602 will resume larger down trend to 100% projection of 1.1149 to 0.9970 from 1.0513 at 0.9334.
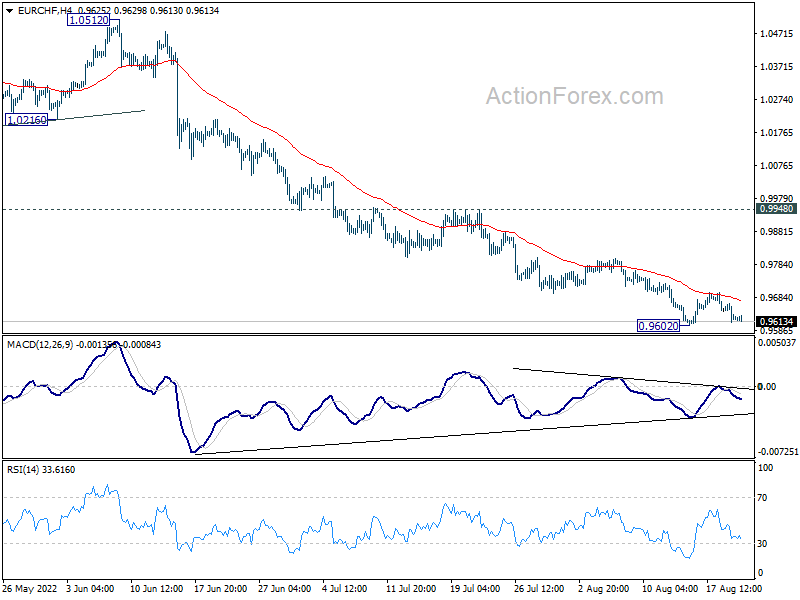
In the bigger picture, long term down trend from 1.2004 (2018 high) is still in progress. Next target is 138.2% projection of 1.2004 to 1.0505 to 1.1149 at 0.9033. On the upside, break of 0.9970 support turned resistance is needed to be the first sign of medium term bottoming. Otherwise, outlook will stay bearish in case of strong rebound.
GBP/JPY Daily Outlook
Daily Pivots: (S1) 161.39; (P) 162.12; (R1) 162.59; More...
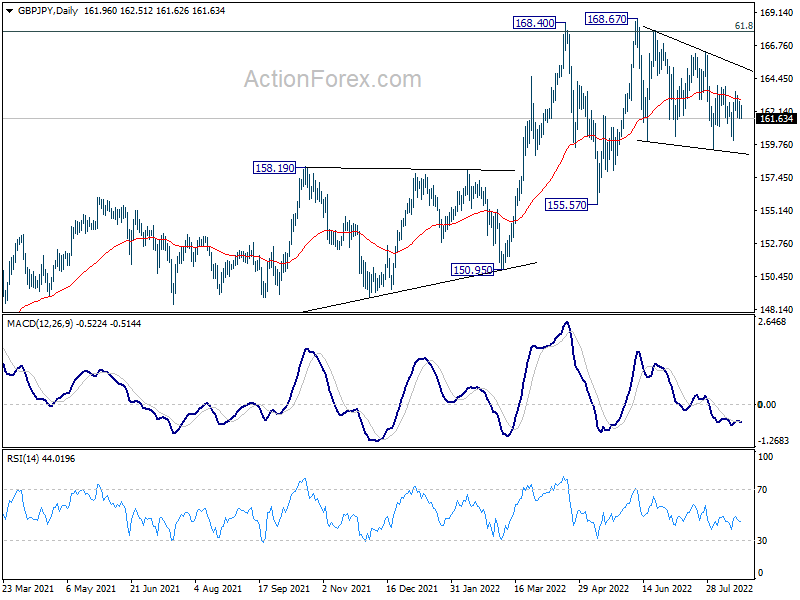
Range trading continues as consolidation pattern from 168.67 is extending. Intraday bias remains neutral at this point. On the upside, break of 163.91 will bring stronger rise to 166.31 resistance. On the downside, below 160.07 will turn bias to the downside for 159.42 and below.
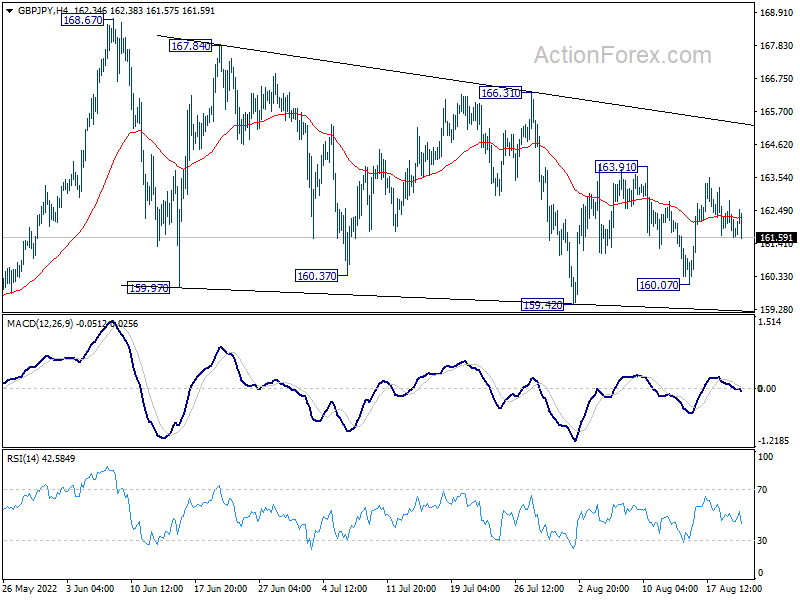
In the bigger picture, up trend from 123.94 (2020 low) is still in progress. Sustained break of 61.8% retracement of 195.86 (2015 high) to 122.75 (2016 low) at 167.93 will be a long term bullish signal, and could pave the way back to 195.86 high. This will remain the favored case as long as 155.57 support holds, even in case of deep pull back.
EUR/JPY Daily Outlook
Daily Pivots: (S1) 136.93; (P) 137.45; (R1) 137.94; More....
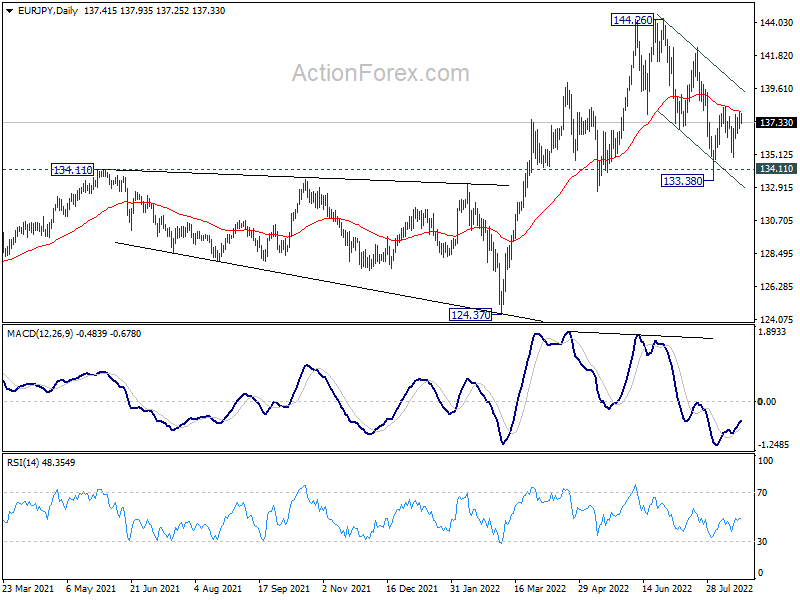
Range trading continues in EUR/JPY and intraday bias remains neutral first. On the upside, break of 138.38 resistance will resume the rebound from 133.38 towards 142.31 resistance. On the downside, break of 134.93 will turn bias back to the downside for 133.38 support. Overall, corrective pattern from 144.26 could extend further with more choppy trading.
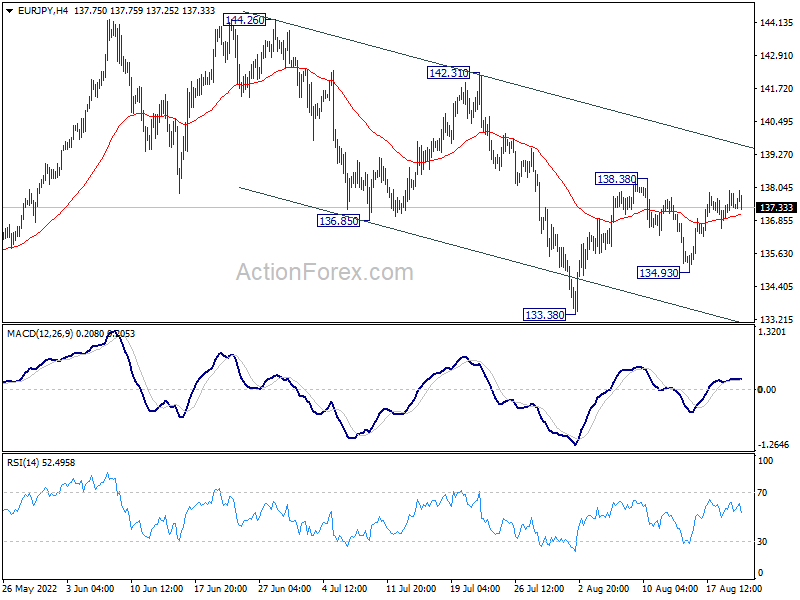
In the bigger picture, up trend from 114.42 (2020 low) is seen as the third leg of the pattern from 109.30 (2016 low). Further rally is in favor as long as 134.11 resistance turned support holds, even in case of deep pull back. Next target is 149.76 (2015 high). However, sustained break of 134.11 will be a sign of medium term bearish reversal and turn focus to 124.37 support for confirmation.
EUR/GBP Daily Outlook
Daily Pivots: (S1) 0.8458; (P) 0.8485; (R1) 0.8517; More...
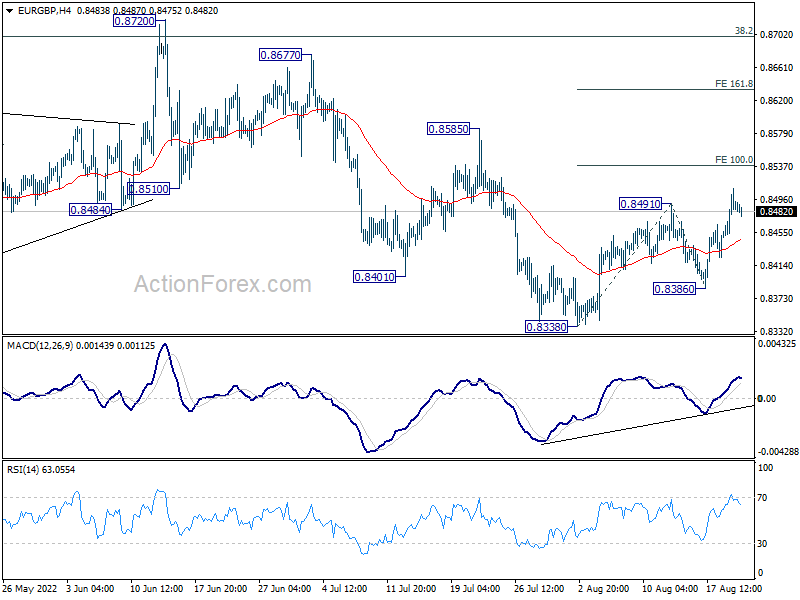
Intraday bias in EUR/GBP remains mildly on the upside at this point. Current development argues that choppy fall from 0.8720 might be completed. Firm break of 100% projection of 0.8338 to 0.8491 from 0.8386 at 0.8539 will affirm this bullish case, and prompt upside acceleration to 161.8% projection at 0.8634 and above. On the downside, break of 0.8386 will resume the fall from 0.8720 through 0.8338 low instead.
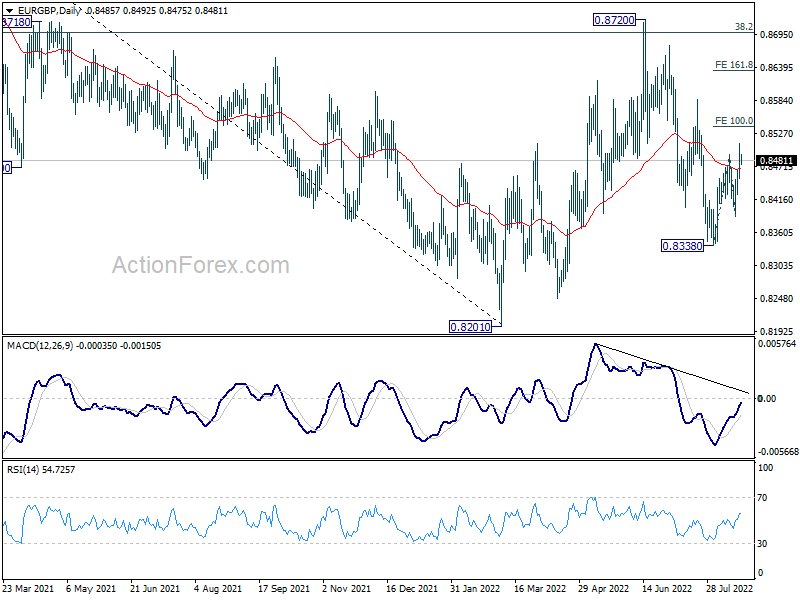
In the bigger picture, medium term bearishness is maintained with prior rejection by 38.2% retracement of 0.9499 to 0.8201 at 0.8697. Break of 0.8201 will resume larger down trend from 0.9499 (2020 high). Nevertheless, sustained break of 0.8697 will affirm the case that rise from 0.8201 is a medium term up trend itself.
USD Up, Stocks Under Pressure as Attention Shifts to Jackson Hole
ANALYSIS | 8/22/2022 5:43:15 AM GMT
Share on Twitter
Share on Facebook
Share on Linkedin
Join Telegram
The trading week kicks off on mixed sentiment. Last week marked the end of a four-week winning rally in the US stocks, and the new week starts with unpleasant new that drought in China’s Sichuan region will cause ‘severe’ power cuts.
People’s Bank of China lowered the lending rates for corporate and household loans to boost credit demand. Stocks in Shanghai gained slightly, but the rest of Asia was in the red and the major US futures traded lower.
The S&P 500 will kick off the week after having slid 1.20% last week, Nasdaq will be testing the bull’s nerves after having lost more than 2.5% over the course of last week.
All eyes will be on the Federal Reserve’s (Fed) Jackson Hole meeting. This year, Jackson Hole may have a bigger-than-usual impact on investor sentiment, as investors don’t really know where the market is going, as the market doesn’t really know where the Fed is going.
The July equity rally was mainly triggered by the expectation - and not the fact, nor an announcement - that the Fed could soften its policy and start cutting the interest rates if the US economy sinks into recession. While there are flashing signs that recession could be just around the corner, there have been no signs, or a mention, or a hint that the Fed would start re-lowering its rates at any point in the foreseeable future.
On the contrary, the Fed members kept that the monetary conditions would tighten until signs of sustainable easing toward the 2% policy target. Therefore, if anything unpleasantly hawkish comes out of this week’s Jackson Hole meeting, we could see the latest equity rally, which could push both the S&P500 and Nasdaq to their 100-DMA levels.
Before the Jackson Hole symposium, we will have a better idea on the latest PMI figures, the US durable goods orders, the latest US GDP data, and the PCE, another gauge of inflation that’s closely watched by the Fed.
Euro battered
Euro traders will keep a close eye on the flash PMI figures today to see the impact of the latest spike in energy prices on economic activity. On Friday, the German PPI data came as a shocker, with more than a 5% rise in factory-gate prices only during July, due to a nearly 15% rise in energy prices, ONLY IN JULY. The German PPI rose 37% since the same time last year, versus a slight easing expected by analysts.
The EURUSD extended losses. Normally, a higher-than-expected inflation print should rather boost the expectation of more aggressive action from the European Central Bank (ECB) and revive the bulls, but, as the ECB is slow to move, the hawkish expectations don’t do much to lift sentiment in the euro. If, on top, we see bad surprises across the PMI reads, the euro could easily sink below parity against the US dollar, yet again.
Speaking of the US dollar, the dollar bulls are back in force. The stronger dollar is not only a headache for the rest of the world, it’s also a headache for the US companies, as the revenues they make outside the US lose value when converted back to US dollars.
The strong dollar continues pressuring gold to the downside. The price of an ounce retreated to $1743 this morning, as Bitcoin struggles to hold ground above the $20K level. If we see the US stocks, especially tech stocks, give back gains this week, we could see Bitcoin vanish below the $20K mark.
German PPI set the tone on Friday, PMIs and Jackson Hole this week
Market movers today
The week starts out very quietly on the data front with no major releases on the calendar.
The big focus this week will be the flash PMIs for August out on both sides of the Atlantic, the ECB minutes of the July meeting on Thursday and the Jackson Hole conference from Thursday to Saturday, where Fed might firm up its hawkish message to the markets with Fed Chair Powell speaking at 16.00 CET on Friday.
The 60 second overview
Germany: German PPI set the tone for Friday's price action as the surge in energy prices and electricity is making its way through the value chain. At an annual growth rate of 37.2%, the German PPI continues to illustrate the challenging environment the economy is facing. As a result of the unfolding energy crisis in Europe, voices in Germany are getting louder for keeping their remaining three nuclear power plants running after the scheduled end in December this year. Both Scholz and Haebeck mentioned this at a government open day in Berlin yesterday. On the positive side, news over the weekend was that the much focused water key point of Kaub on the Rhine is said to be passable again and financially viable for most companies as of Tuesday due to an expected rise in the water level from 31cm to 148 cm. During the weekend, Bundesbank president Nagel also said that a German recession seems probable if energy crisis worsens. It was also announced that the Nordstream 1 pipeline will be down for maintenance for three days later this month.
Inflation watch: Inflation pressures from oil, metals, food and freight rates have come down but labour markets remain tight in US and Europe keeping wage pressures high. The euro area was hit by a further inflation shock over the summer from the sharp rise in gas and electricity prices. Looking forward, we expect inflation to stay high in the short term (rise further in the Euro Area) but decline during 2023 as recession looms.
Equities: Markets soured on Friday as the recession trade made a comeback. It was a classic reversal session, with cyclicals, growth and small caps underperforming for the day and week. Worth noting, it was more of a recession session than a stagflation session, despite the worrisome inflation figures from Europe. For example, financials at the bottom of the index despite a 10bp rise in 10y yields which is quite unusual. VIX, which has been trending lower for the past weeks jumped back above 20. This is fair to us, and hence the tailwind from positioning should start to fade from here. S&P 500 dropped -1.2%, Nasdaq -1.9%, Dow -0.8% and Russell 2000 -2%. Futures are pointing lower this morning too.
FI: Friday's price action was dominated by the German PPI of 37.2% yoy as the energy and electricity surge is making its way through the value chain. Short dated inflation fixings was bid through the day and ended almost 0.2pp higher on the day (Dec22 fixing). As a result, of the UK CPI figure, surge in electricity and gas prices and the German PPI, markets have changed the theme from growth slowdown to recession fear last week. Markets also rolled its expectations for the peak in euro area inflation to December from September. German 10y Bund yield was up by 11bp on Friday to 1.23%, amid some peripheral spread widening.
FX: The recent bout of SEK weakness, brought on by the market pricing out the probability of a inter-meeting Riksbank hike, has pushed EUR/SEK to its highest levels since early July, currently sitting at 10.60. Last week saw a substantial weakening of cyclical European currencies (e.g. SEK, GBP and Eastern Europe) vs EUR; and USD equally rose versus EUR.
Credit: iTraxx Main was 6.3bp wider to 103.5bp on Friday, closing the week 11.7bp wider on the back of the fragile risk sentiment. Meanwhile, iTraxx Crossover widened 33bp to 524.9bp, ending the week 62.9bp wider.
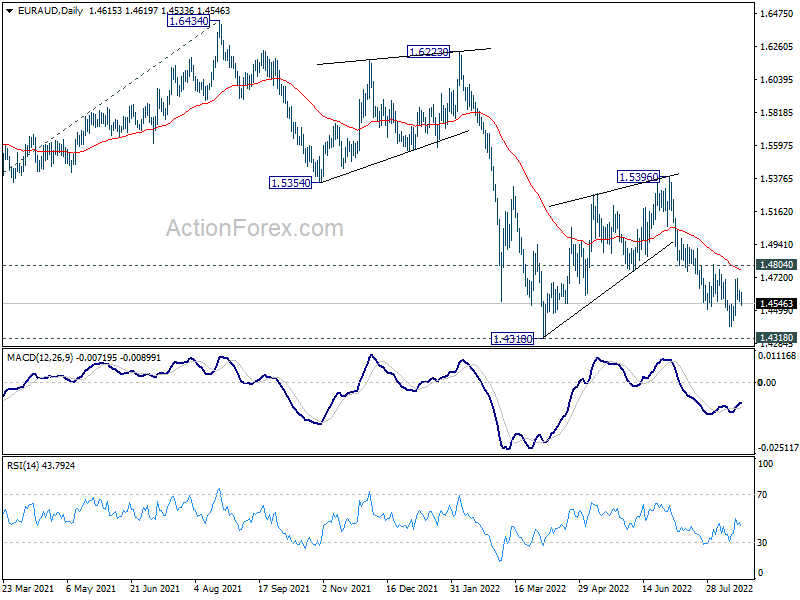
EUR/AUD Daily Outlook
Daily Pivots: (S1) 1.4570; (P) 1.4602; (R1) 1.4639; More...
EUR/AUD dips mildly today but stays in established range. Intraday bias remains neutral first. Further decline is expected as long as 1.4804 resistance holds. On the downside, firm break of 1.4318 low will resume larger down trend to medium term projection level at 1.3623. However, break of 1.4804 will delay the bearish case and turn bias to the upside for stronger rebound first.
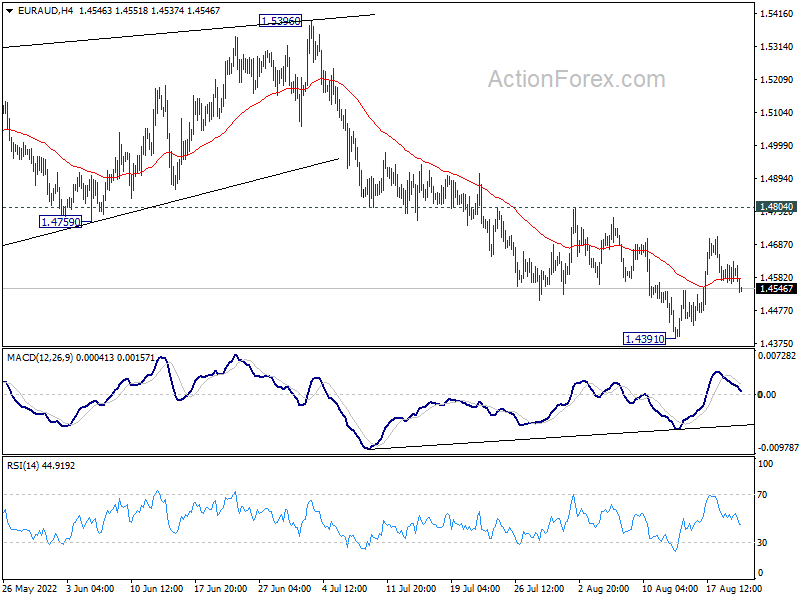
In the bigger picture, down trend from 1.9799 is still in progress. Break of 1.4318 low will target 61.8% projection of 1.9799 to 1.5250 from 1.6434 at 1.3623, which is close to 1.3624 long term support (2017 low). This will remain the favored case now as long as 1.5396 resistance holds.
Markets Steady in Slow Start, Jackson Hole as Highlight of the Week
The markets are rather steady in Asian session today. With a near empty calendar, trading could remain subdued. Activity, however, might start to increase with the wave of flash PMI data to be released tomorrow. For now, Aussie and Kiwi are trying to recover. But Dollar is staying firm. Euro and Yen are on the weaker side, together with Swiss Franc, while Sterling and Loonie are mixed.
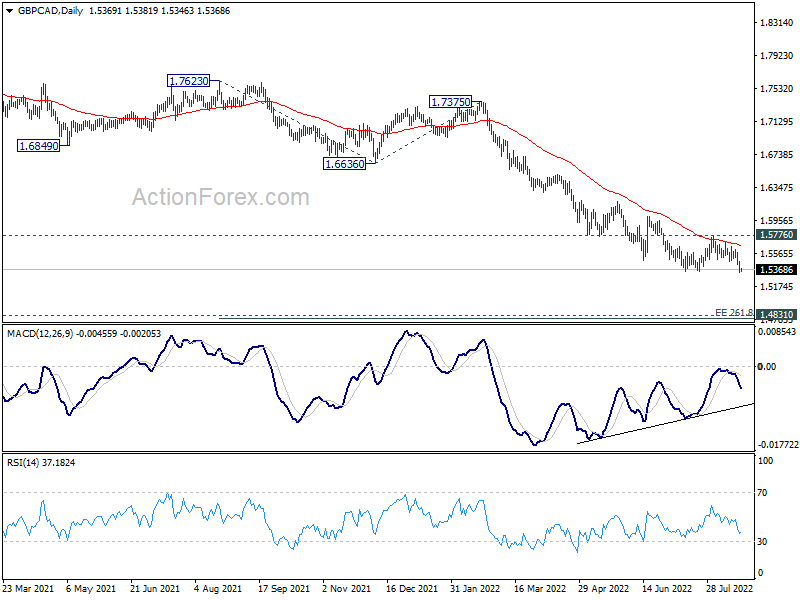
Technically, GBP/CAD is attempting to break through 1.5348 low to resume the long term down trend. Prior rejection by 55 day EMA is clearly a bearish sign. Yet, downside momentum has been diminishing as seen in bullish convergence condition in daily MACD. Hence, even if the down trend continues, GBP/CAD would probably to find enough buying above 1.4831 (2010 low), and probably around 1.5 handle, to bottom. Anyway, Sterling will continue to under perform Canadian for a while at least.
In Asia, at the time of writing, Nikkei is down -0.51%. Hong Kong HSI is down -0.09%. China Shanghai SSE is up 0.36%. Singapore Strait Times is up 0.67%. Japan 10-year JGB yield is up 0.018 at 0.219.
Bundesbank Nagel: Further interest rate hikes must follow
Bundesbank President Joachim Nagel told Rheinischen Post, "the probability is rising that inflation will be higher than previously forecast and will average six point something next year." That compares with Bundesbank's prior projection of 4.5% inflation in 2023. "With the high inflation rates, further interest rate hikes must follow,"he added.
Nagel also admitted that the German economy is "likely" to suffer a recession over winter, if energy crisis continues to deepen, as it's among the most exposed to Russian gas disruptions.
RBNZ Hawkesby: Things will be evenly balanced once rates reach 4-4.25%
RBNZ Deputy Governor Christian Hawkesby said the strategy now is to get the cash rate "comfortably above neutral" to bring down core inflation. And, "that will afford us some breathing space to see how things are playing out."
"Once we get the OCR up into that 4%-4.25% level we're seeing things evenly balanced from there," he added. "So we'd put equal weight on having to put the OCR up as we would putting it down."
"The economy will evolve differently than our projections. There will be shocks that come along. There'll be data that's different than the forecast. And we'll just keep coming back to what does it mean for our mandates," Hawkesby said. "We certainly are projecting an environment where the economy cools."
China PBoC cut loan prime rate to support housing
China's PBoC lowered the one-year loan prime rate (LPR) by 5bps to 3.65% today. The five-year LPR rate, which is used to price mortgages, was slashed by 15bps to 4.30%.
The larger cut is the 5-year rate was seen as for addressing the problems in the housing markets. The asymmetry is also for giving additional boost to long-term financing demand.
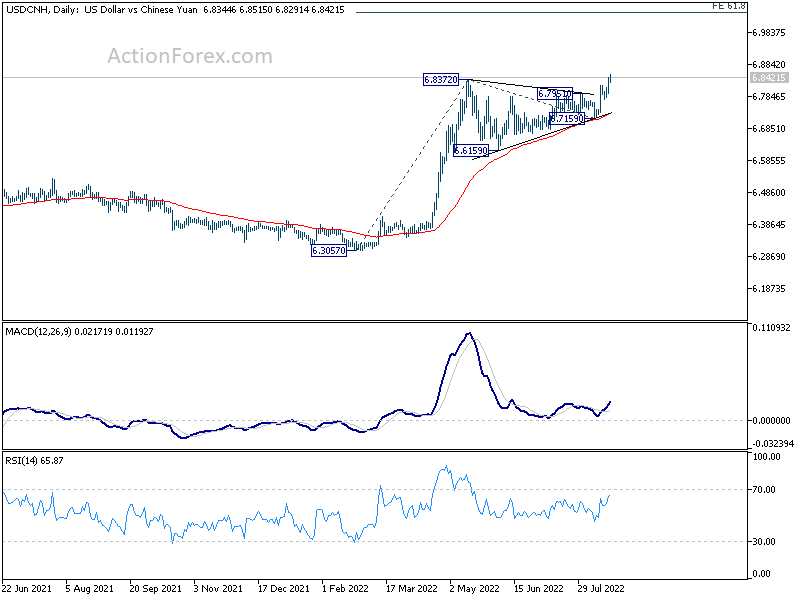
USD/CNH's up trend from 6.3057 resumed last week by breaking through 6.8372 high. But that's more about the broad based rally in Dollar than the weakness in Yuan. Anyway, the up trend could be heading towards 61.8% projection of 6.3057 to 6.8273 from 6.7159 at 7.0444 in the medium term next, that is, above 7 handle.
Jackson Hole Symposium as the highlight of the week
The main focus this week should be on comments from Fed Chair Jerome Powell, as well as other central bankers, at the Jackson Hole Symposium on Thursday and Friday. But it's unlikely for Powell to offer anything concrete regarding Fed's policy action at the upcoming FOMC meeting in September. After all, there will be another non-farm payroll and CPI report between now and then. It's too early for Powell to indicate anything.
Instead, the accounts of ECB's July meeting could be more revealing. Some recent comments from ECB officials suggest that another 50bps rate hike is on the table at the September meeting. The markets would be eager to know more about the discussions, as well as the views of Chief Economist Philip Lane.
On the data front, PMIs from Australia, Japan, Eurozone and UK would be mostly watched, for signs of the direction of prices, as well as economic momentum. US durable goods orders and personal spending, Germany Ifo business claims and Gfk consumer sentiment, New Zealand retail sales, will also catch match attention.
Here are some highlights for the week:
- Monday: Bundesbank monthly report; Canada new housing price index.
- Tuesday: Australia PMIs; Japan PMI manufacturing; Eurozone PMIs; UK PMIs; US PMIs, new home sales.
- Wednesday: US durable goods orders, pending home sales.
- Thursday: New Zealand retail sales; Japan corporate service prices; Germany GDP final, Ifo business climate; ECB meeting accounts; US GDP revision, jobless claims.
- Friday: Japan Tokyo CPI; Germany Gfk consumer sentiment; Eurozone M3 money supply; US personal income and spending, PCE inflation, goods trade balance.
EUR/AUD Daily Outlook
Daily Pivots: (S1) 1.4570; (P) 1.4602; (R1) 1.4639; More...
EUR/AUD dips mildly today but stays in established range. Intraday bias remains neutral first. Further decline is expected as long as 1.4804 resistance holds. On the downside, firm break of 1.4318 low will resume larger down trend to medium term projection level at 1.3623. However, break of 1.4804 will delay the bearish case and turn bias to the upside for stronger rebound first.
In the bigger picture, down trend from 1.9799 is still in progress. Break of 1.4318 low will target 61.8% projection of 1.9799 to 1.5250 from 1.6434 at 1.3623, which is close to 1.3624 long term support (2017 low). This will remain the favored case now as long as 1.5396 resistance holds.
Economic Indicators Update
| GMT | Ccy | Events | Actual | Forecast | Previous | Revised |
|---|---|---|---|---|---|---|
| 10:00 | EUR | German Buba Monthly Report | ||||
| 12:30 | CAD | New Housing Price Index M/M Jul | 0.40% | 0.20% |
Technical Outlook and Review
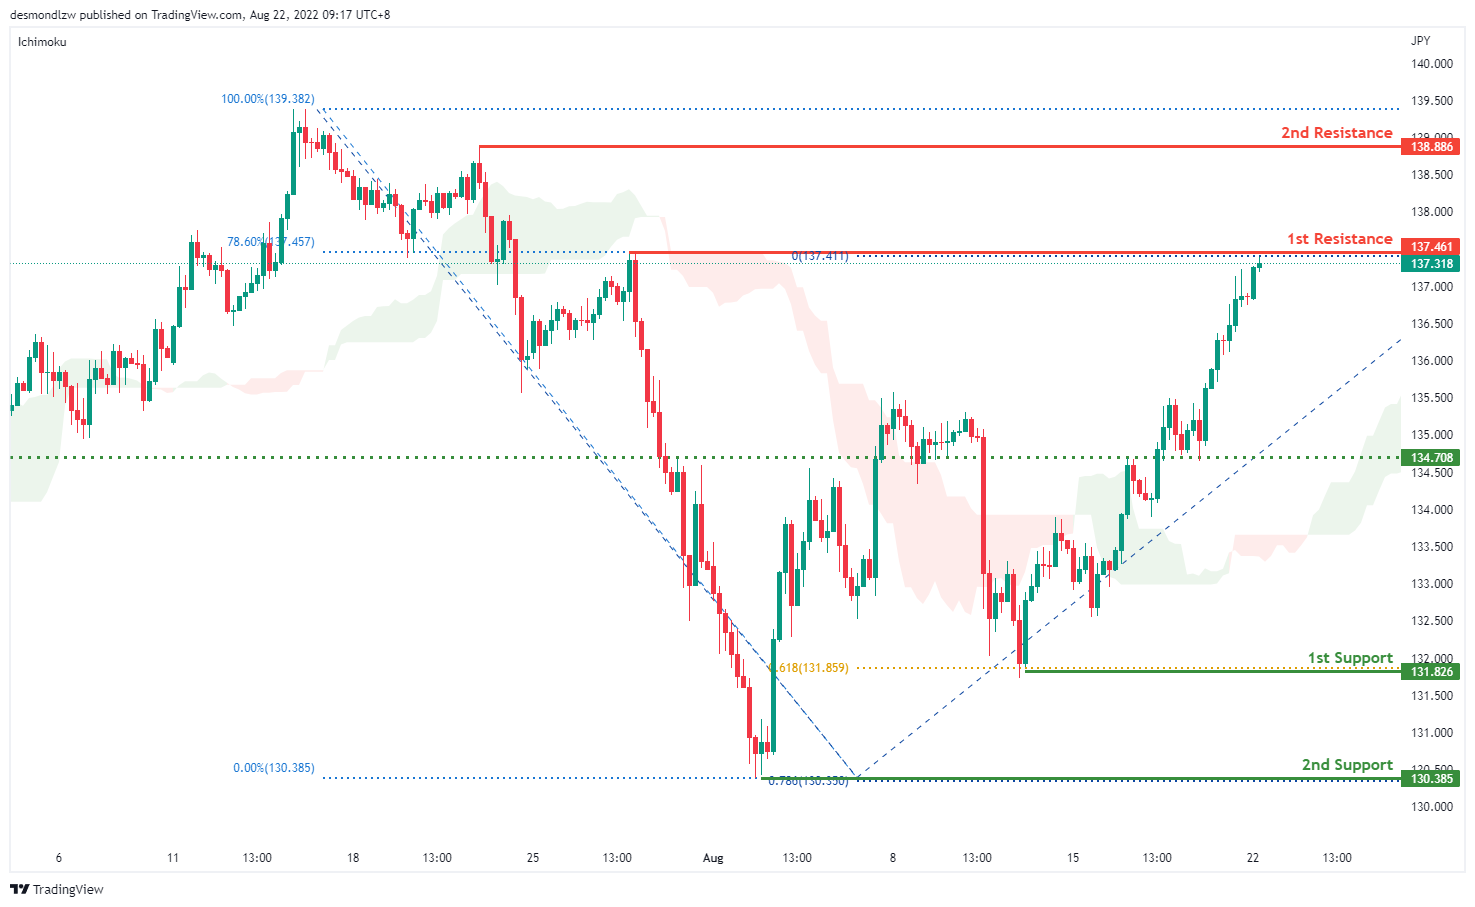
USD/JPY:
On the H4 chart, price has confirmed a bullish momentum breaking the previous high and moving toward the first resistance at 137.461 where the 78.6% fibonacci retracement and previous swing high sits. If bullish momentum continues, it will bring the price to 138.886. Alternatively if price pulls back, it should test the intermediate support at 134.708 and the first support at 131.826 where the 61.8% projection sits and then the second support at 131.601 where the 100% projection sits
Areas of consideration:
H4 time frame, 1st resistance at 137.318
H4 time frame, 1st support at 131.826
DXY:
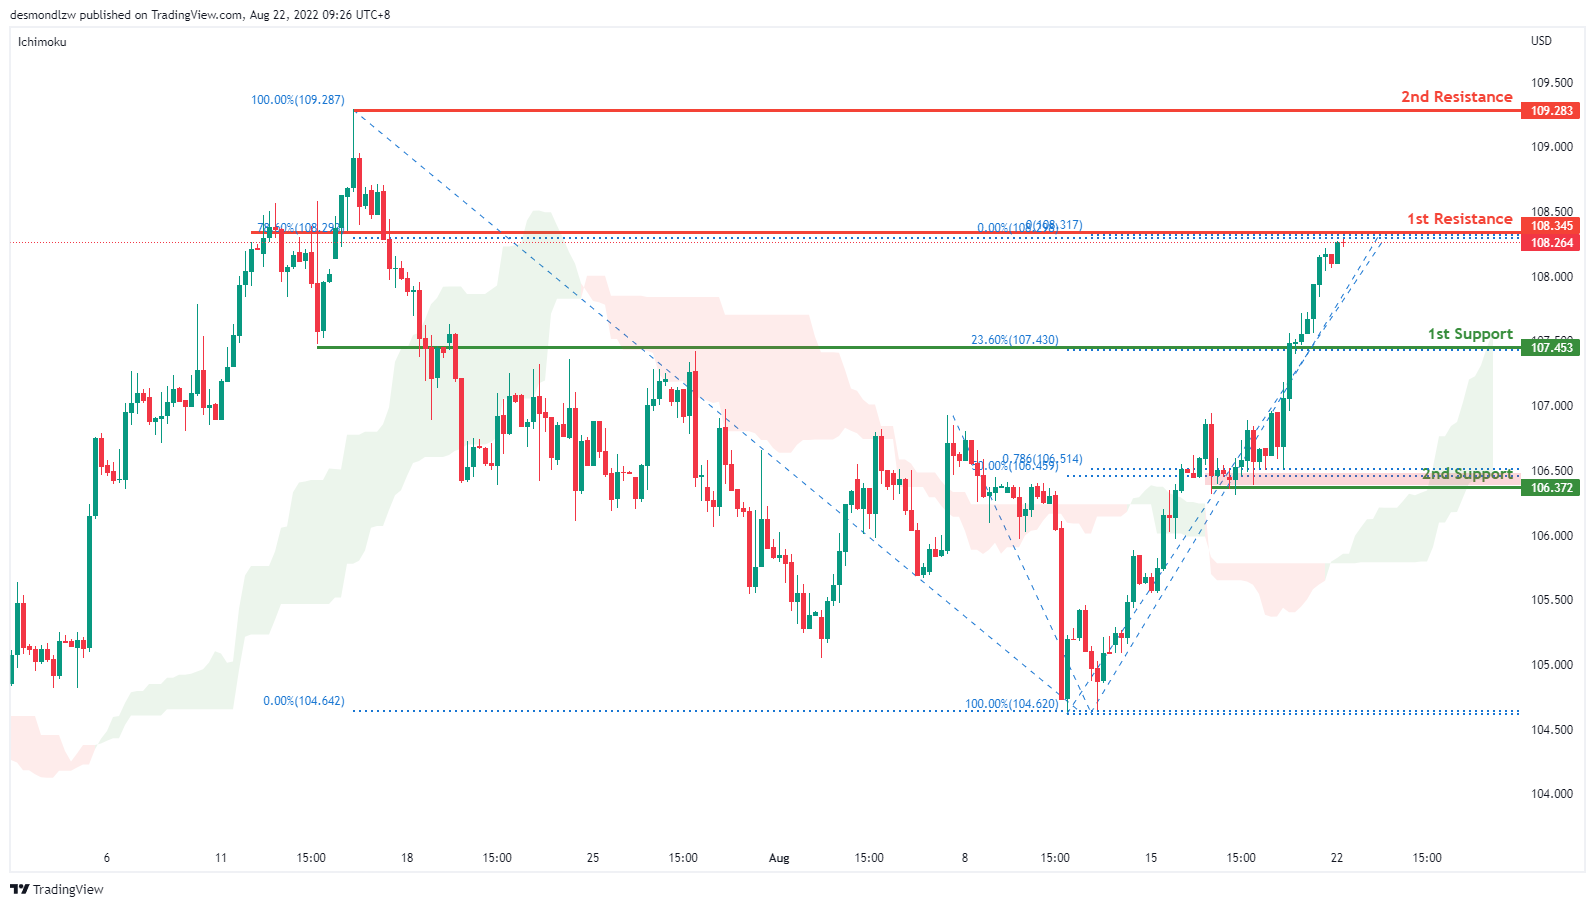
On the H4, prices seem to be moving in an ascending trend and is in a bullish momentum. Price is testing around the first resistance at 108.345 where the 78.6% Fibonacci retracement and the previous swing high sits. If price continues with bullish momentum, it will test the second resistance at 109.283. If fails to break the first resistance, it will pull back to test the first support at 107.453 where the 23.6% retracement and swing low sits and subsequently the second support at 106.372 where the 50% retracement and 78.6% projection sits
Areas of consideration:
H4 time frame, 1st resistance at 108.345
H4 time frame, 1st support at 107.453
EUR/USD :
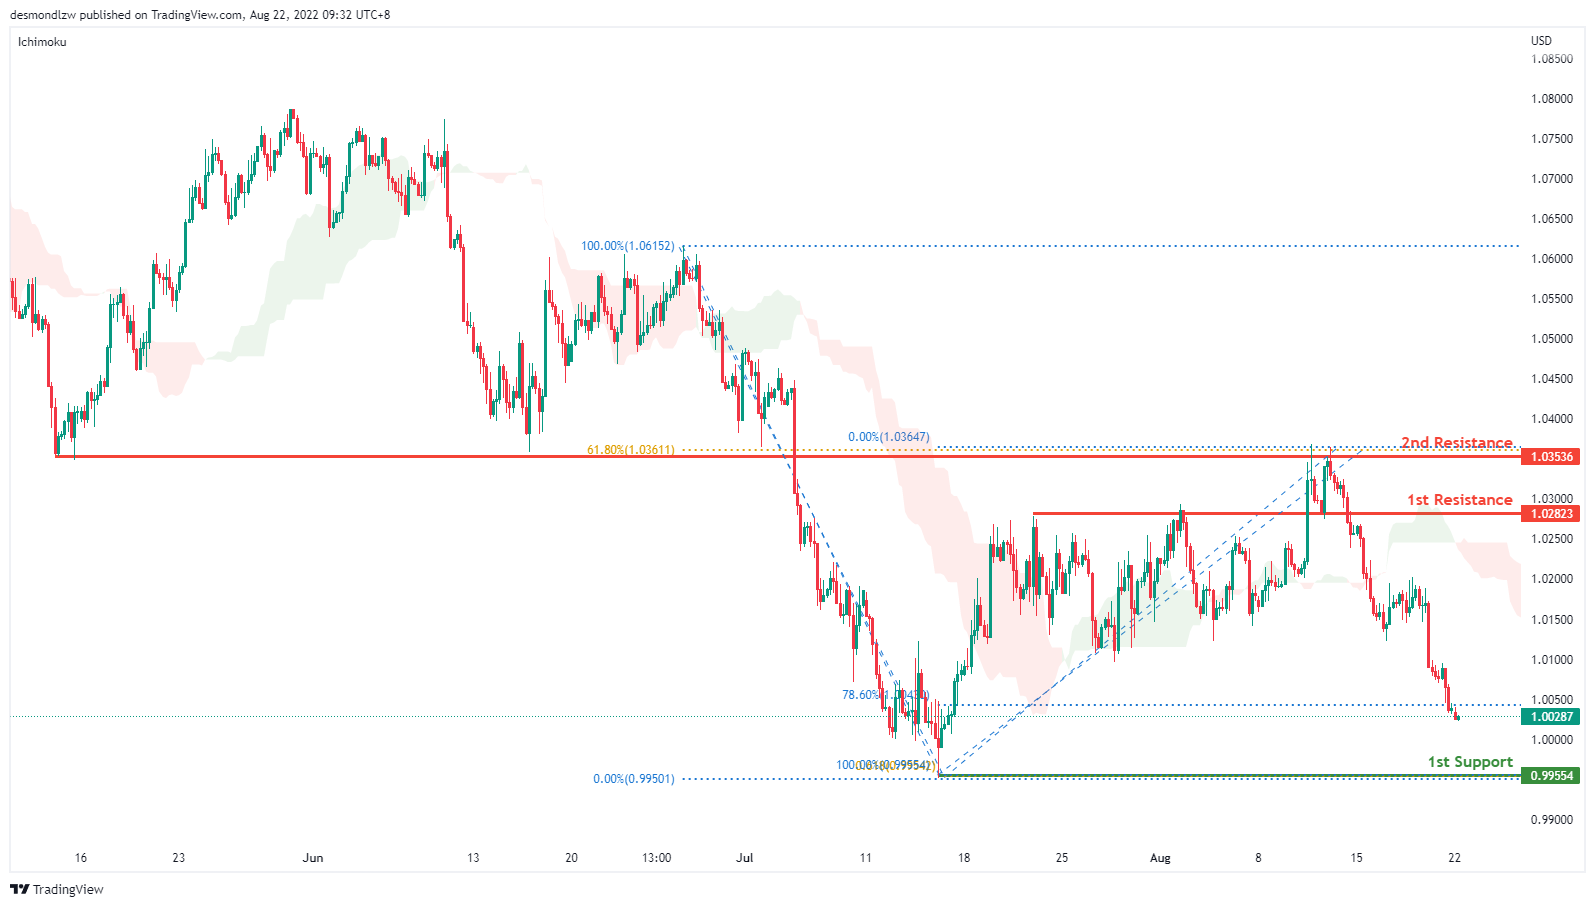
On the H4, prices have broken the ascending trend and are below the ichimoku indicator, we are bearish bias. Prices are descending toward the first support at 0.9955 where the 61.8% projection sits. Alternatively, prices could pull back to test the first resistance at 1.0282 where the previous swing high sits and subsequently the second resistance at 1.0353 where the 61.8% retracement and swing high sits
Areas of consideration :
H4 1st resistance at 1.0282
H4 1st support at 0.9955
GBP/USD:
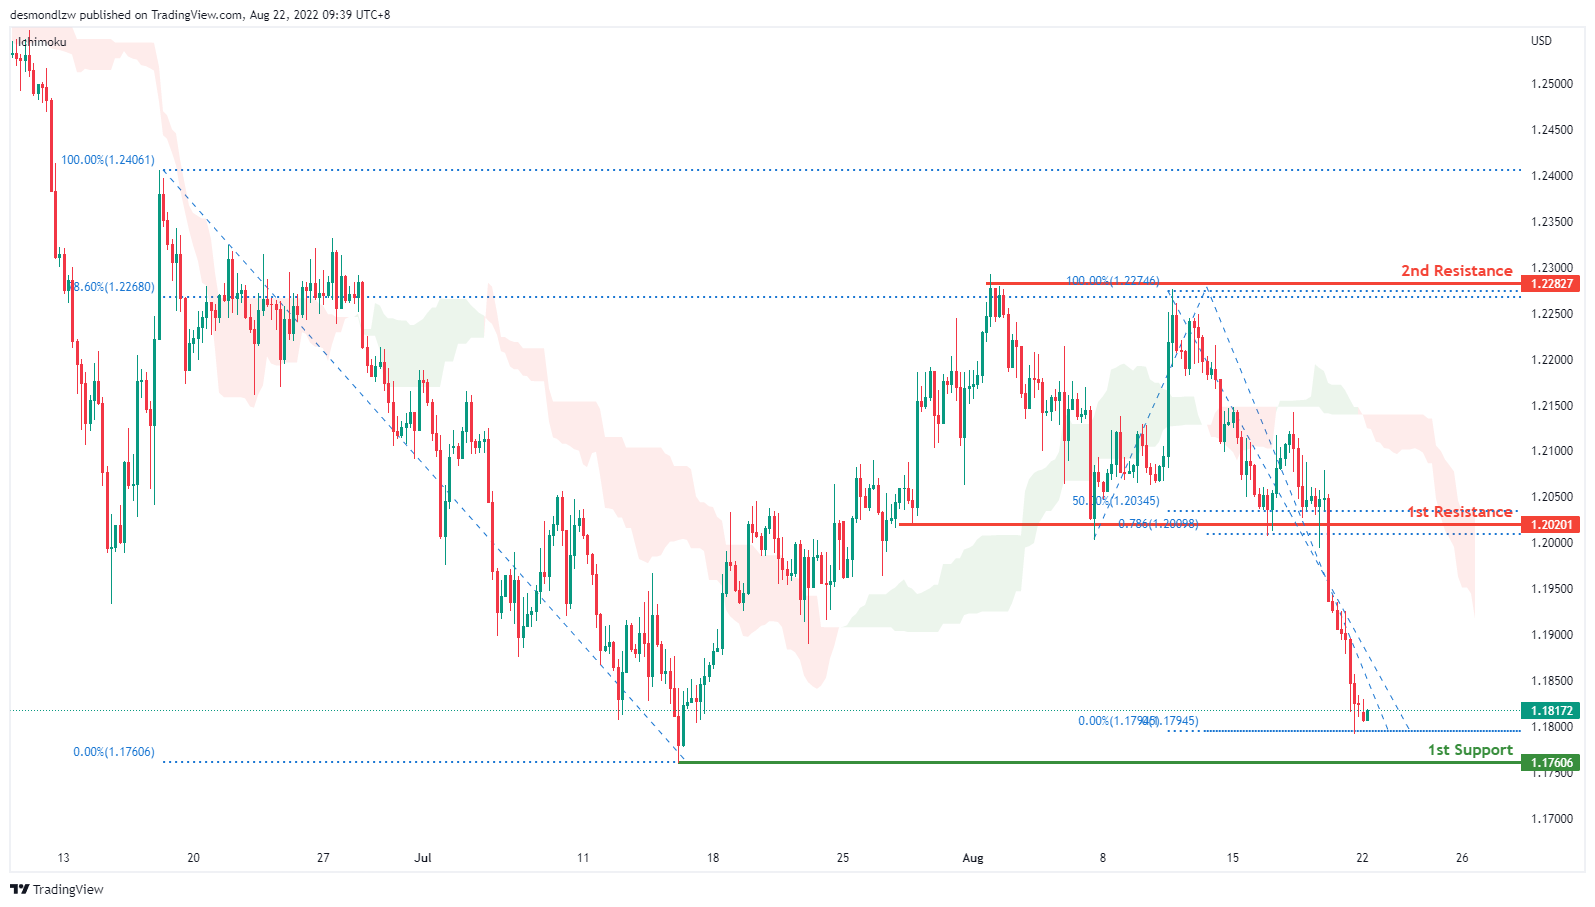
On the H4, prices seem to be in a bearish momentum. It is currently moving toward the first support at 1.1760 where the swing low sits. Alternatively, price can pull back to test the first resistance at 1.2020 where the 50% retracement and 78.6% projection sits. Subsequently testing the second resistance at 1.2282 where 78.6% retracement and the swing high sits
Areas of consideration:
H4 1st resistance at 1.2020
H4 1st support at 1.1760
USD/CHF:
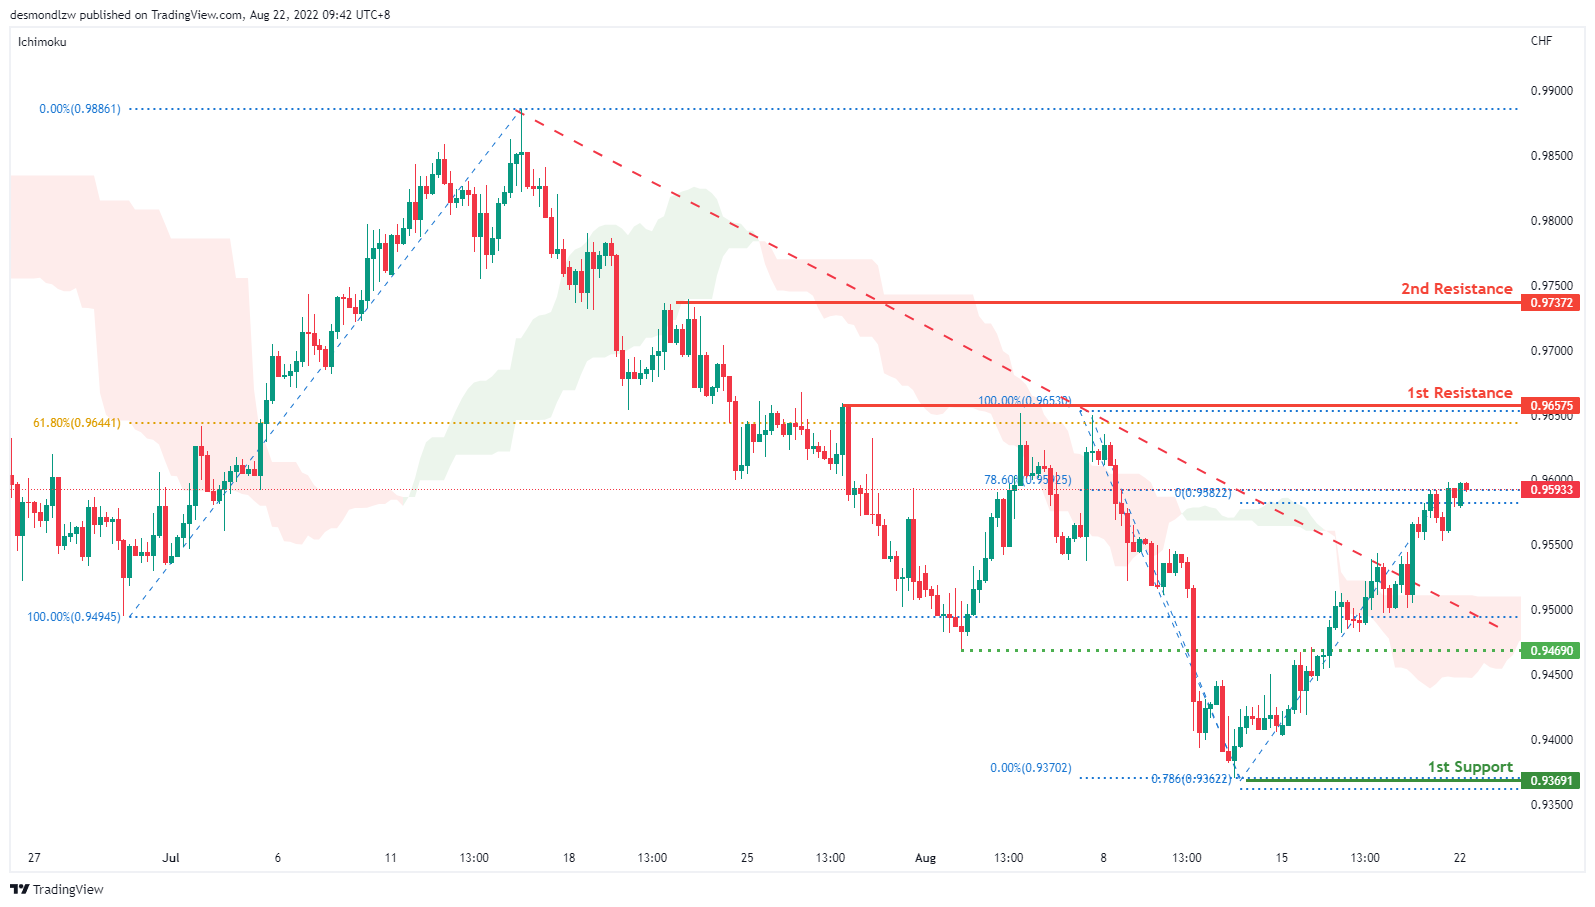
On the H4, with prices moving above the ichimoku cloud and breaking the descending trend, we are bullish bias. Price seems like it’s rising toward the first resistance at 0.9657 where the 61.8% fibonacci retracement sits. If price continues with the bullish momentum it will test the second resistance at 0.9737. Alternatively, prices could test the intermediate support at 0.9469 where the swing low sits and then the first support at 0.9369 where the 78.6% fibonacci retracement sits
Areas of consideration
H4 1st support at 0.9369
H4 1st resistance at 0.9657
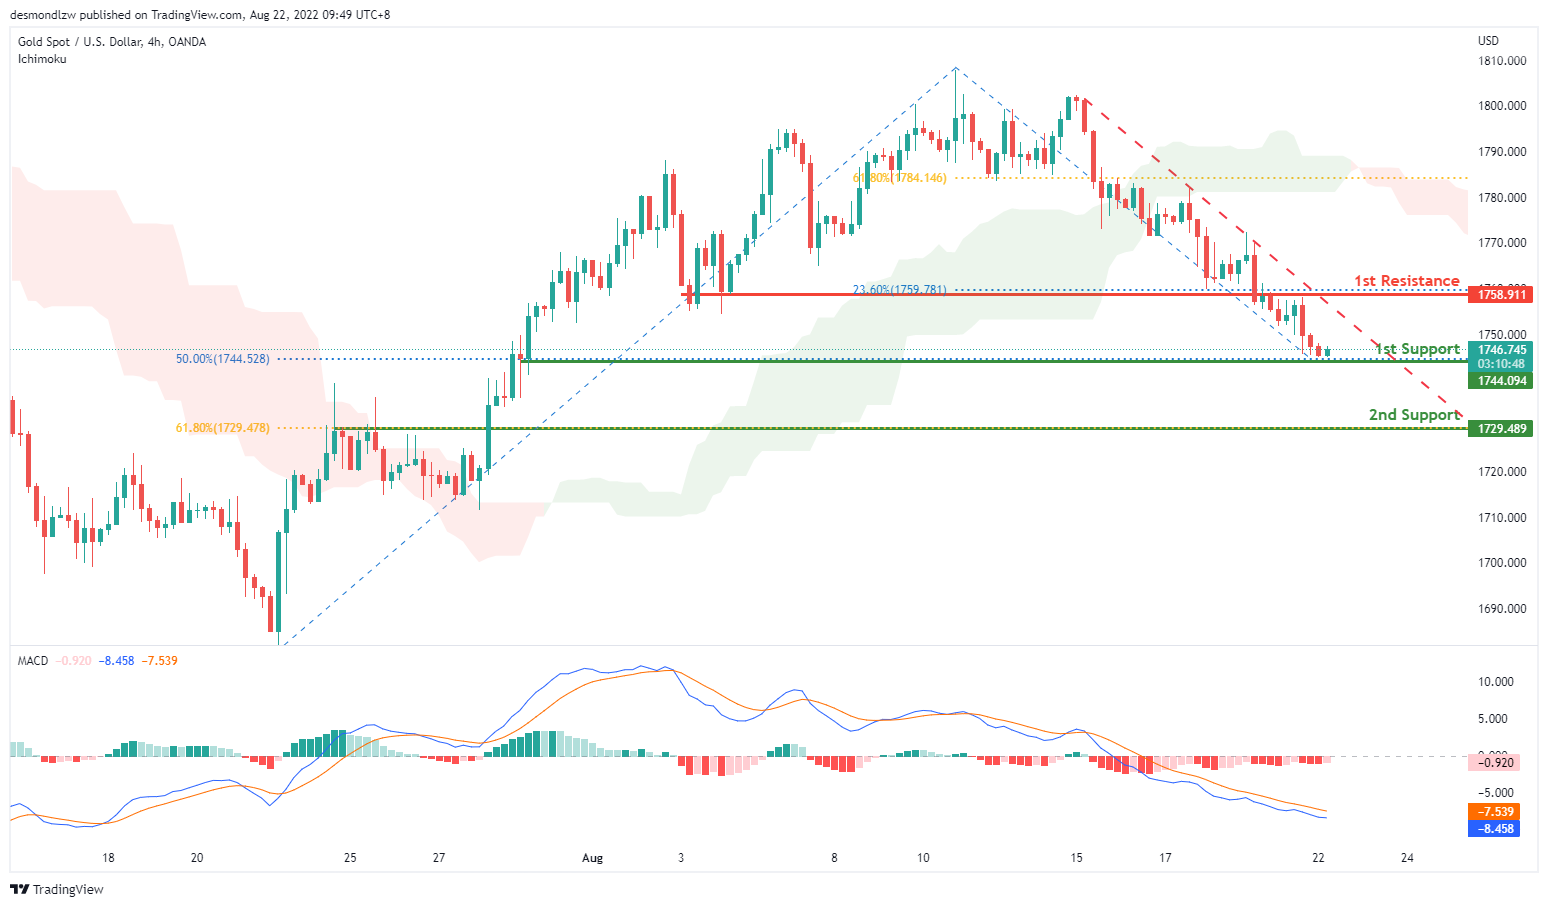
XAU/USD (GOLD):
On the H4, with prices moving within the descending trendline, below ichimoku cloud and MACD indicators are below zero, we have a bearish bias that the price may drop from the 1st support at 1744.094, which is in line with the 50% fibonacci retracement to the 2nd support at 1729.489, where the 61.8% fibonacci retracement and pullback resistance are. Alternatively, the price may rise to the 1st resistance at 1758.911, where the 23.6% fibonacci retracement is.
Areas of consideration:
H4 time frame, 1st support at 1744.094
H4 time frame, 2nd support at 1729.489
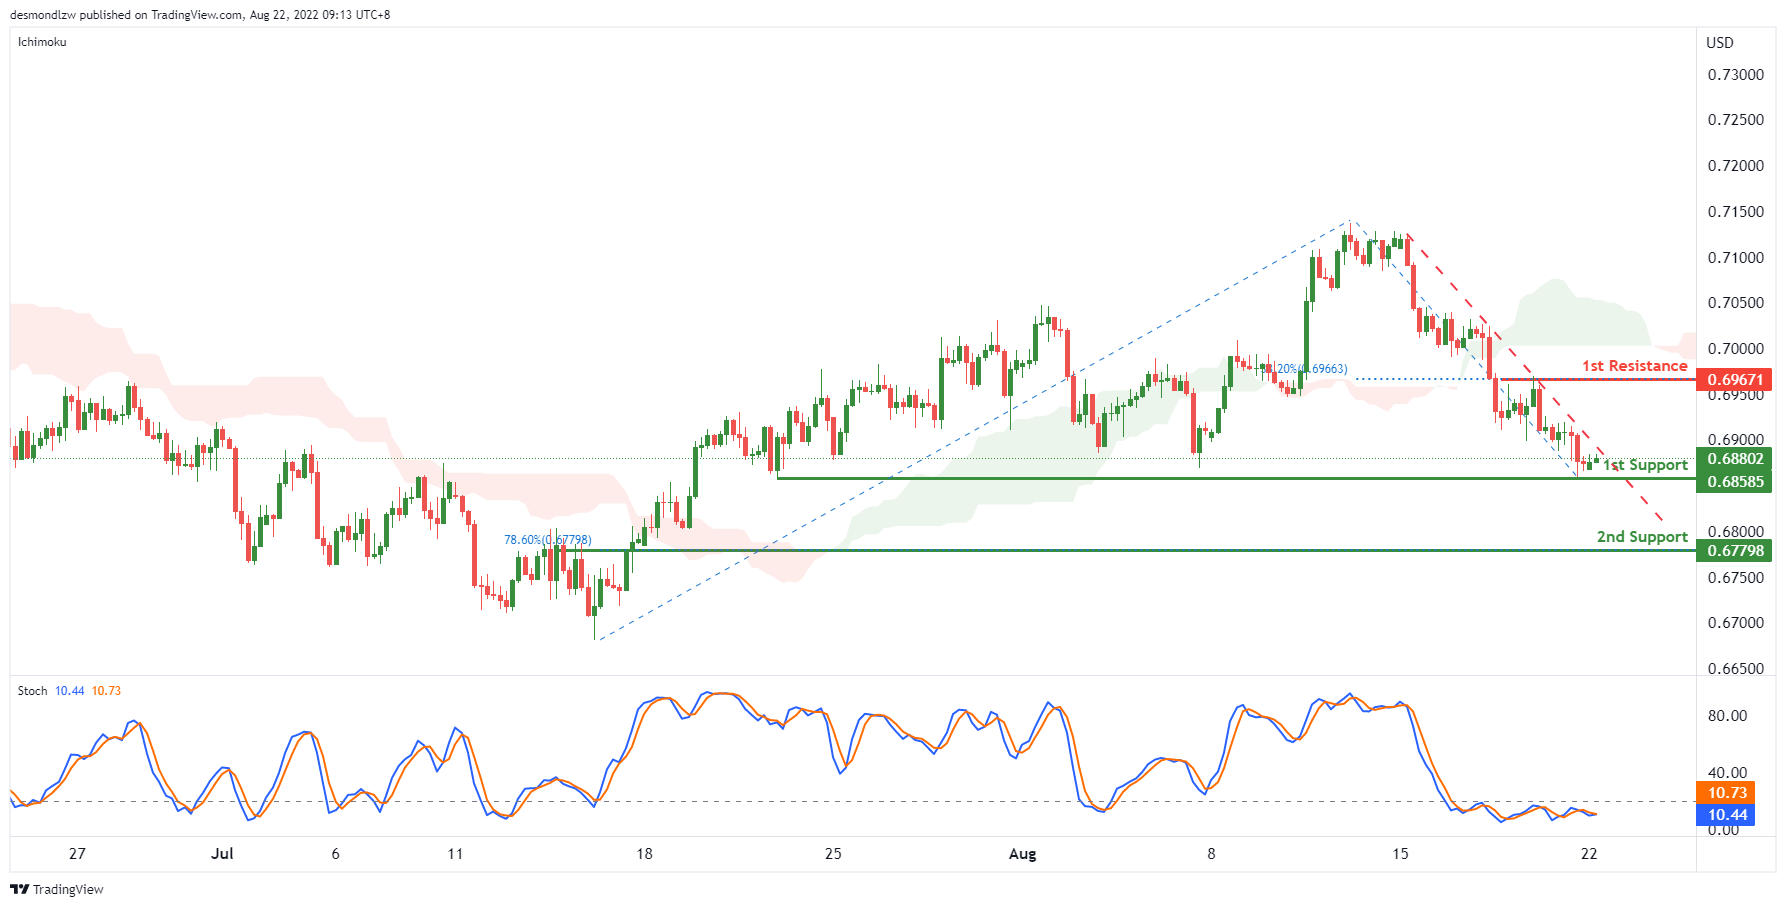
AUD/USD:
On the H4, with the price is going within the descending trendline and the stoch indicators are below 20 accompany with the %K crossing below %D for 2 times, we have a bearish bias that the price may drop to the 1st support at 0.68585, which is in line with the previous swing low. If the price breaks the 1st support, we can expect it to drop to the 2nd support at 0.67798, where the 78.6% fibonacci retracement is. Alternatively, the price may break the descending trendline and rise to the 1st resistance at 0.69671, where the swing high and 38.2% fibonacci retracement are.
Areas of consideration
H4 1st support at 0.68585
H4 2nd support at 0.67798
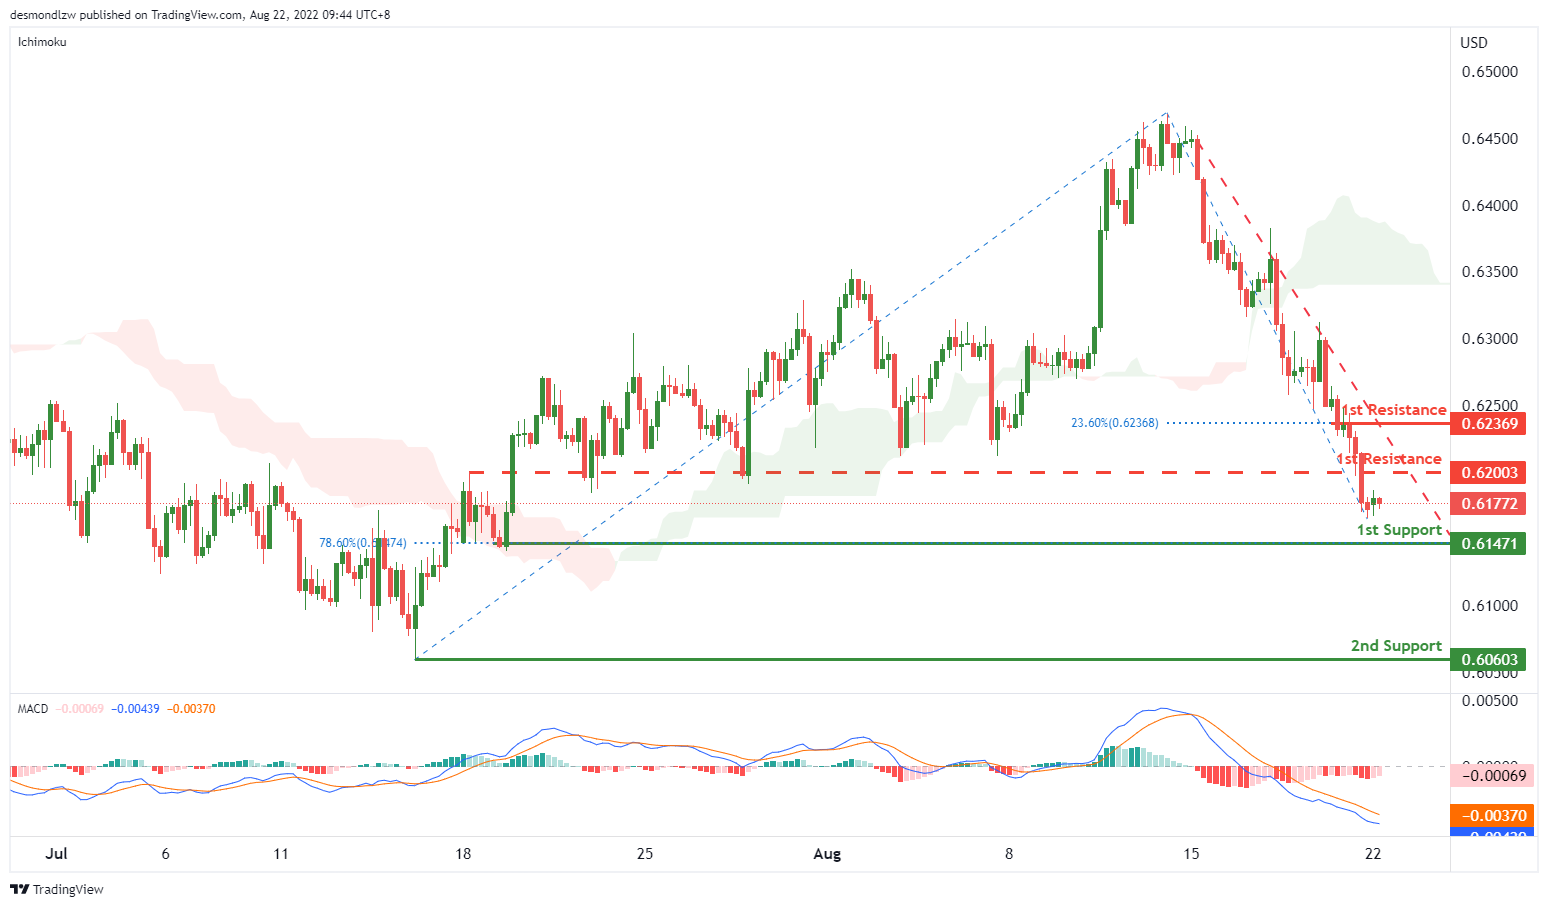
NZD/USD:
On the H4, with the price moving within the descending trendline, below ichimoku cloud and MACD indicators are below zero, we have a bearish bias that the price may drop to the 1st support at 0.61471, which is in line with the 78.6% fibonacci retracement and pervious swing low, if the price continue dropping, the price may drop to the 2nd support at 0.60603, which is in line with the swing low. Alternatively, the price may rise to the 1st resistance at 0.62369, where the 23.6% fibonacci retracement is. Take note the price of 0.62003 could be the intermediate resistance, which is the overlap resistance.
Areas of consideration:
H4 time frame, 1st support at 0.61471
H4 time frame, 2nd support at 0.60603
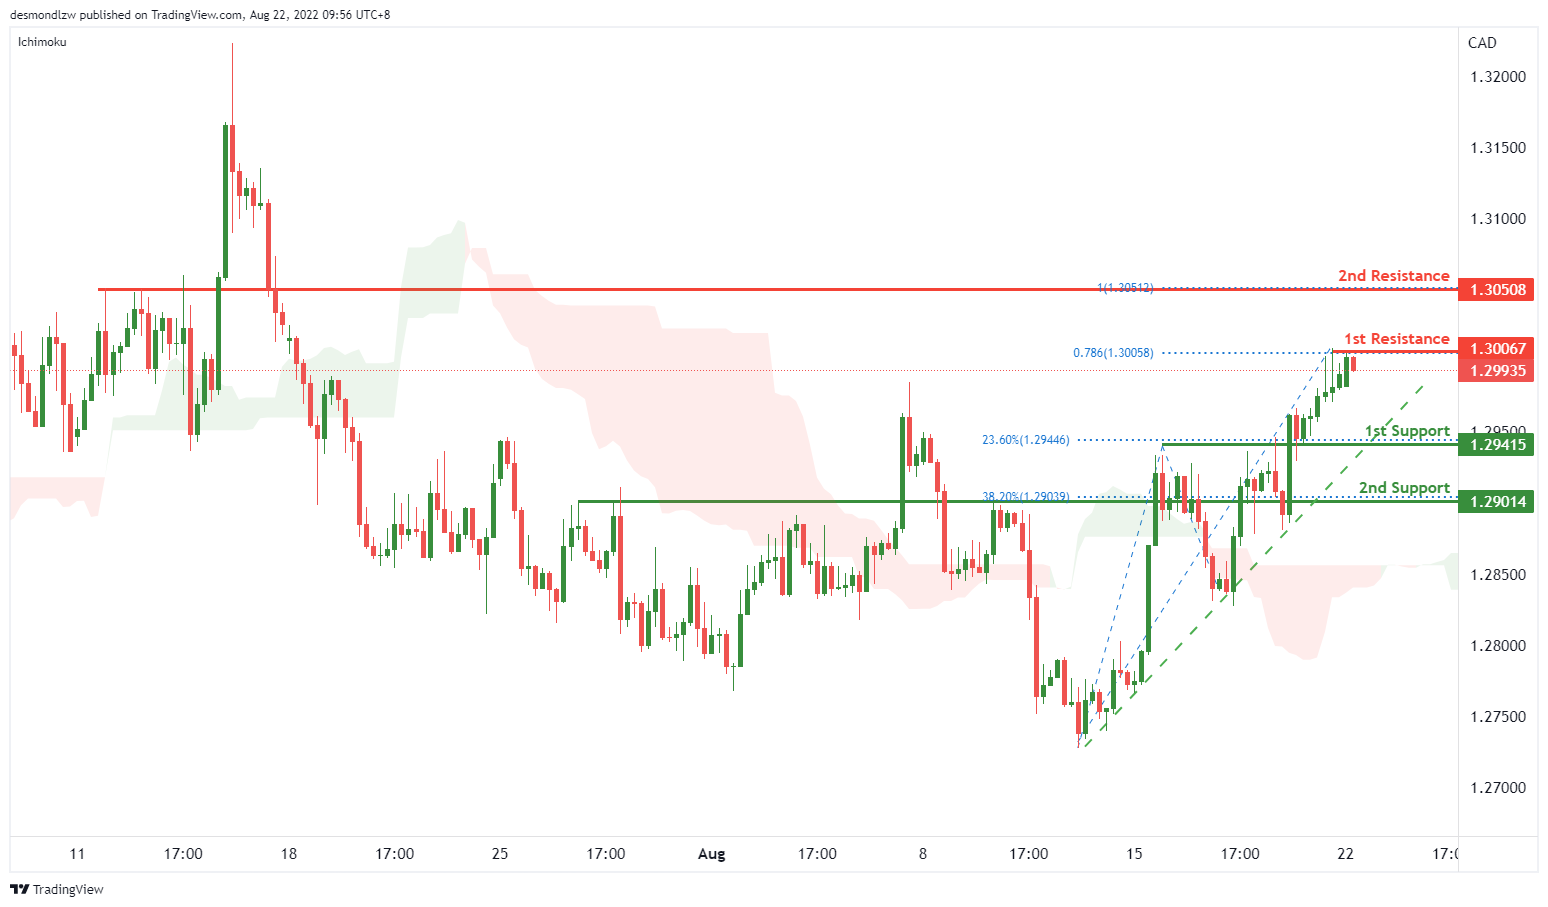
USD/CAD:
On the H4, with the price above the ichimoku cloud and moving within the ascending trendline, we have a bullish bias that the price may rise from the 1st resistance at 1.30067, which is the 78.6% fibonacci projection to the 2nd resistance at 1.30508, which is in line with the previous swing highs and 100% fibonacci projection. Alternatively, the price may drop to the 1st support at 1.29415, where the 23.6% fibonacci retracement is. If the price break this level, we can expect it to drop to 2nd support at 1.29014, where the 38.2% fibonacci retracement is.
Areas of consideration:
H4 time frame, 1st resistance at 1.30067
H4 time frame, 2nd resistance at 1.30508
OIL:
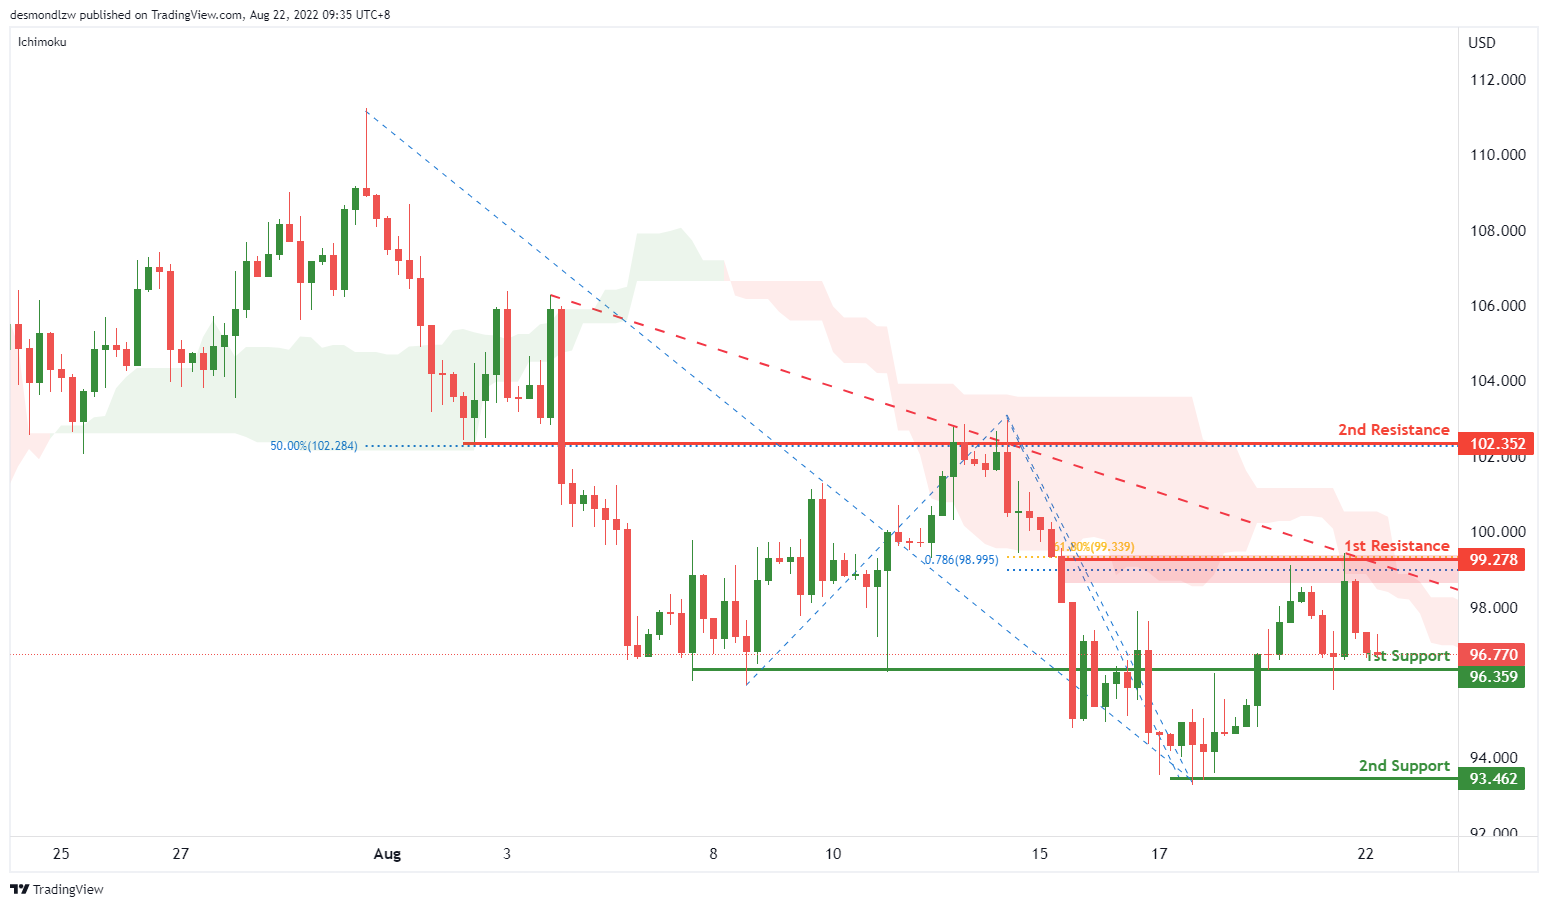
On the H4, with price moving within the descending trendline, below ichimoku cloud, we have a bearish bias that the price may drop to our 1st support at 96.359, which is in line with the previous swing low, if the price break the 1st support, the price may drop to the 2nd support at 93.462, which is in line with the swing low. Otherwise, the price may rise to the 1st resistance, where the 78.6% fibonacci projection, 61.8% fibonacci retracement and swing high. If the price break this level, it could rise to the 2nd resistance, which is in line with the 50% fibonacci retracement.
Areas of consideration:
H4 time frame, 1st support at 96.359
H4 time frame, 2nd support at 93.462
Dow Jones Industrial Average:
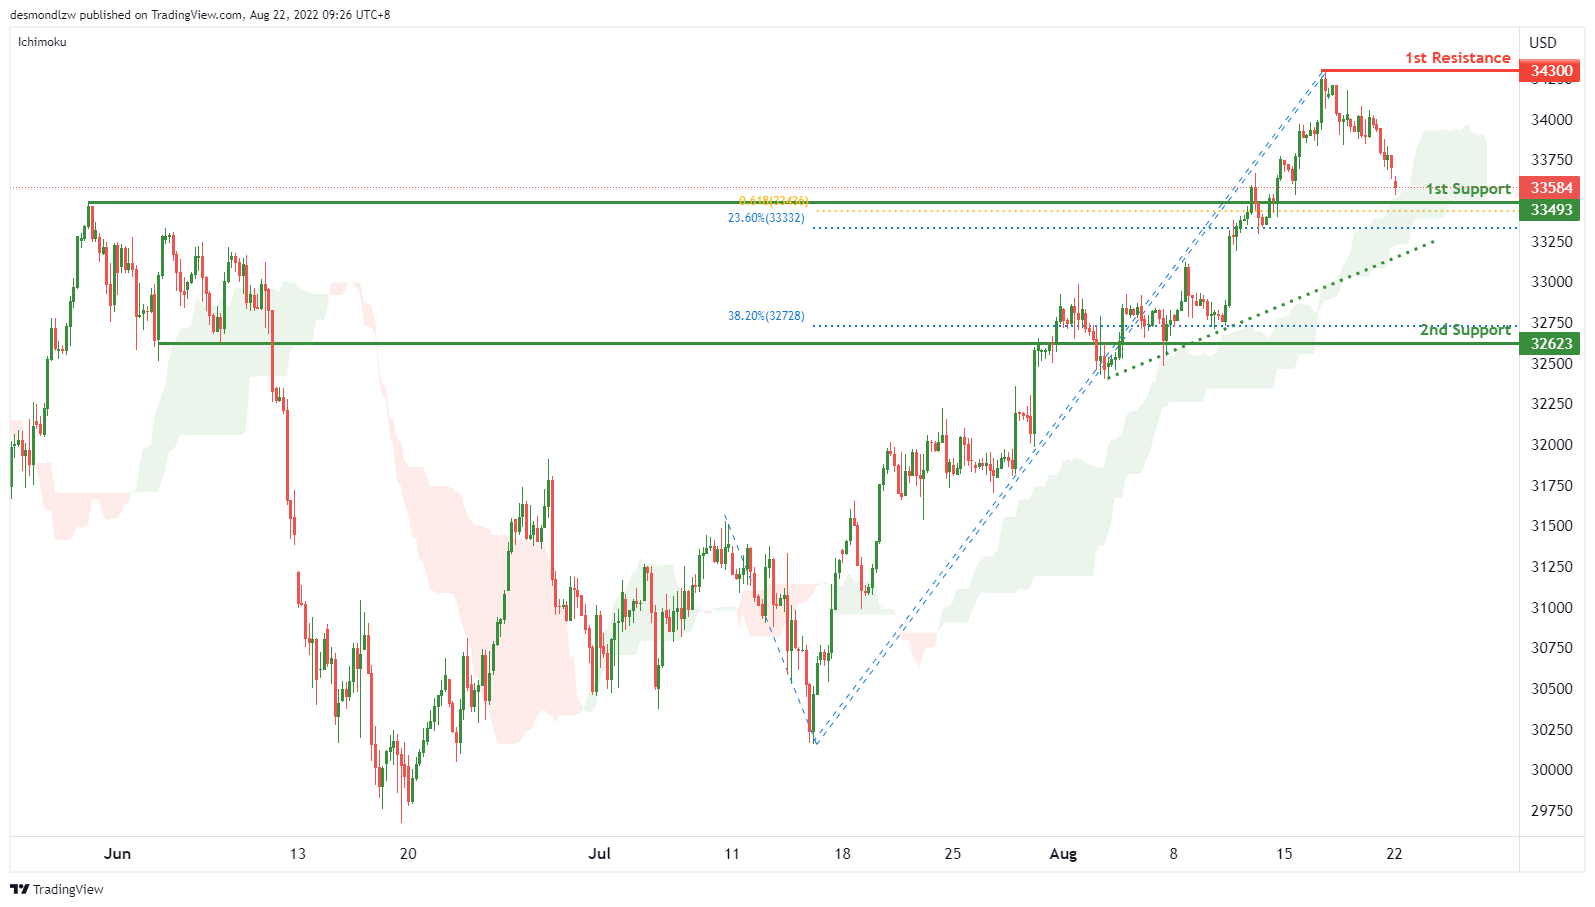
On the H4, with price moving above the ichimoku indicator and along an ascending trendline, we have a bullish bias that price will rise from 1st support at 33493 where the 23.6% fibonacci retracement, 61.8% fibonacci projection and pullback support to 1st resistance at 34300 where the swing high resistance is. Alternatively, price could break 1st support structure and drop to 2nd support at 32623 where the pullback support and 38.2% fibonacci retracement are.
Areas of consideration:
H4 time frame, 1st resistance of 34300
H4 time frame, 1st support at 33493
DAX:
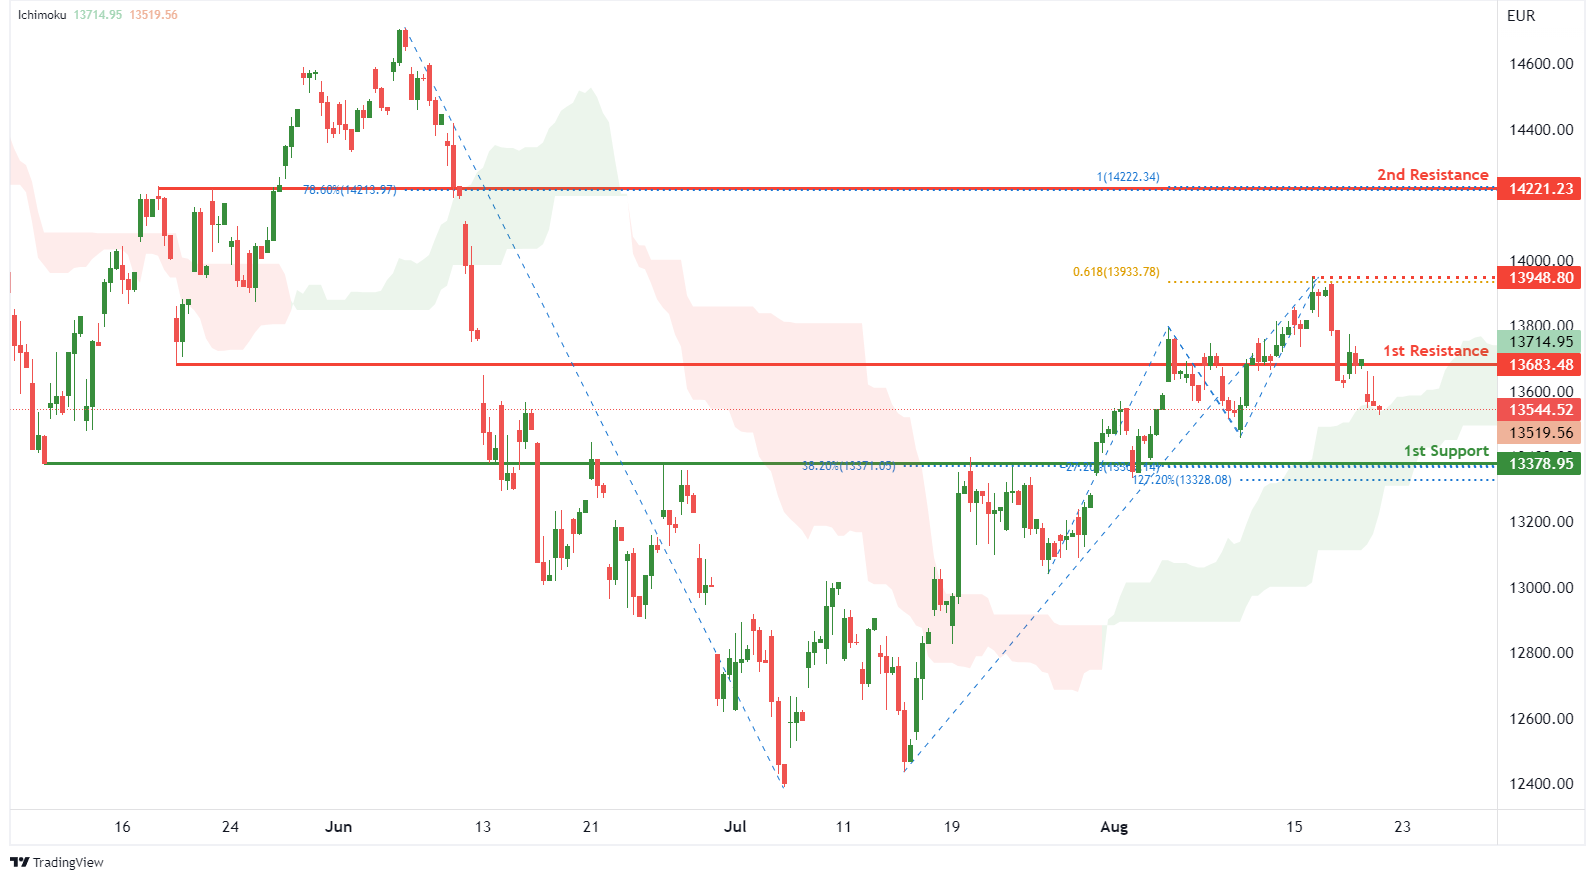
On the H4, with price moving above the ichimoku indicator, we have a bullish bias that price will rise to the 1st resistance at 13683.48 where the pullback support is. Once there is upside confirmation that price has broken 1st resistance structure, we would expect bullish momentum to carry price to the 2nd resistance at 14221.23 in line with 100% fibonacci projection and 78.6% fibonacci retracement. Take note of intermediate resistance at 13948.80 where the swing high resistance and 61.8% fibonacci projection are. Alternatively, price could drop to 1st support at 13378.95 where the overlap support, -27.2% fibonacci expansion, 127.2% fibonacci extension and 38.2% fibonacci retracement are
Areas of consideration:
H4 time frame, 1st resistance of 14221.23
H4 time frame, 1st support at 13378.95
ETHUSD:
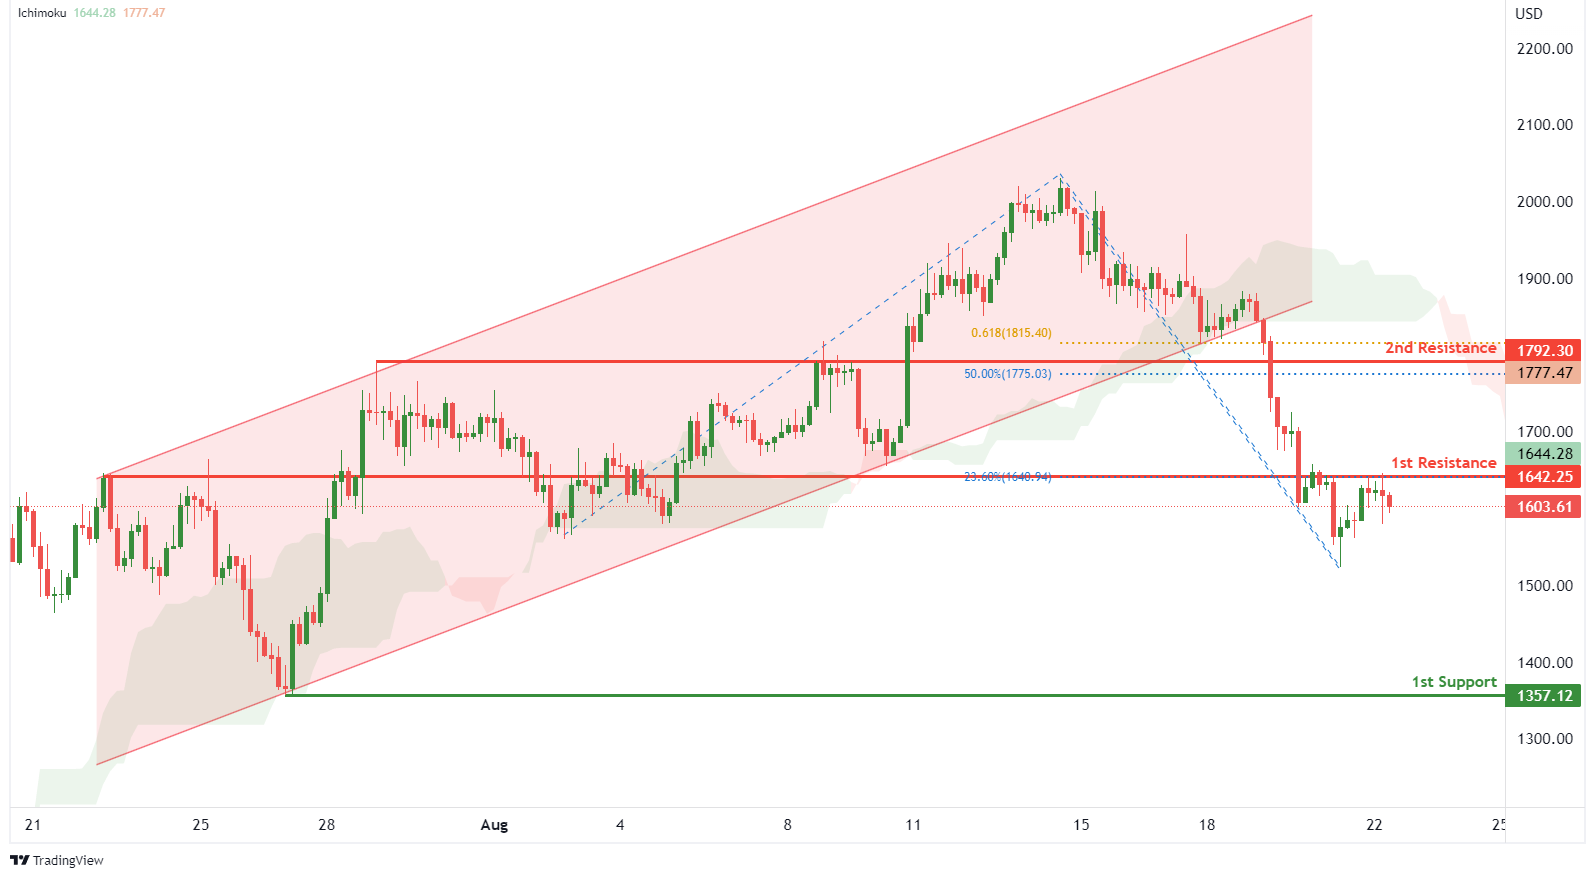
On the H4, with price breaking out of an ascending channel and moving below the ichimoku indicator, we have a bearish bias that price will drop from the 1st resistance at 1642.25 where the pullback support and 23.6% fibonacci retracement are to the 1st support at 1357.12 where the swing low support is. Alternatively, price could break 1st resistance and rise to 2nd resistance at 1792.30 where the overlap resistance, 50% fibonacci retracement and 61.8% fibonacci projection are.
Areas of consideration:
H4 time frame, 1st resistance of 1642.25
H4 time frame, 1st support at 1357.12
BTCUSD:
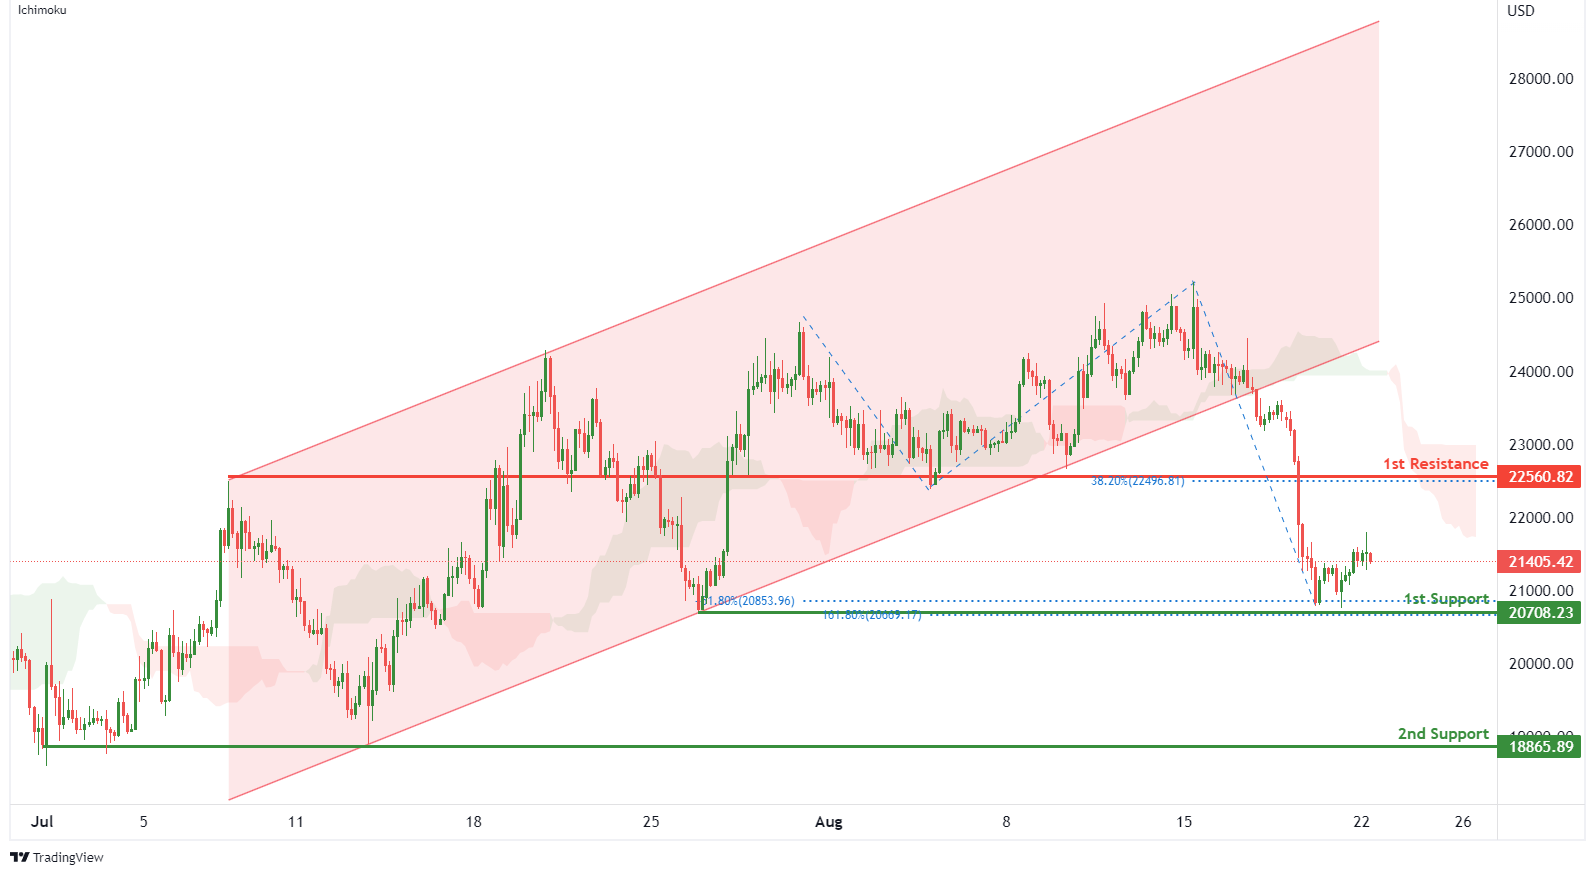
On the H4, with price breaking out of a bullish channel and moving below the ichimoku indicator, we have a bearish bias that price will drop to 1st support at 20708.23 where the -61.8% fibonacci expansion, 161.8% fibonacci extension and swing low support are. Once we have downside confirmation of price breaking 1st support structure,we would expect bearish momentum to carry price to 2nd support at 18865.89 where the swing low support is. Alternatively, price could rise to 1st resistance at 22560.82 where the pullback resistance and 38.2% fibonacci retracement are.
Areas of consideration:
H4 time frame, 1st resistance of 22560.82
H4 time frame, 1st support at 20708.23
S&P 500:
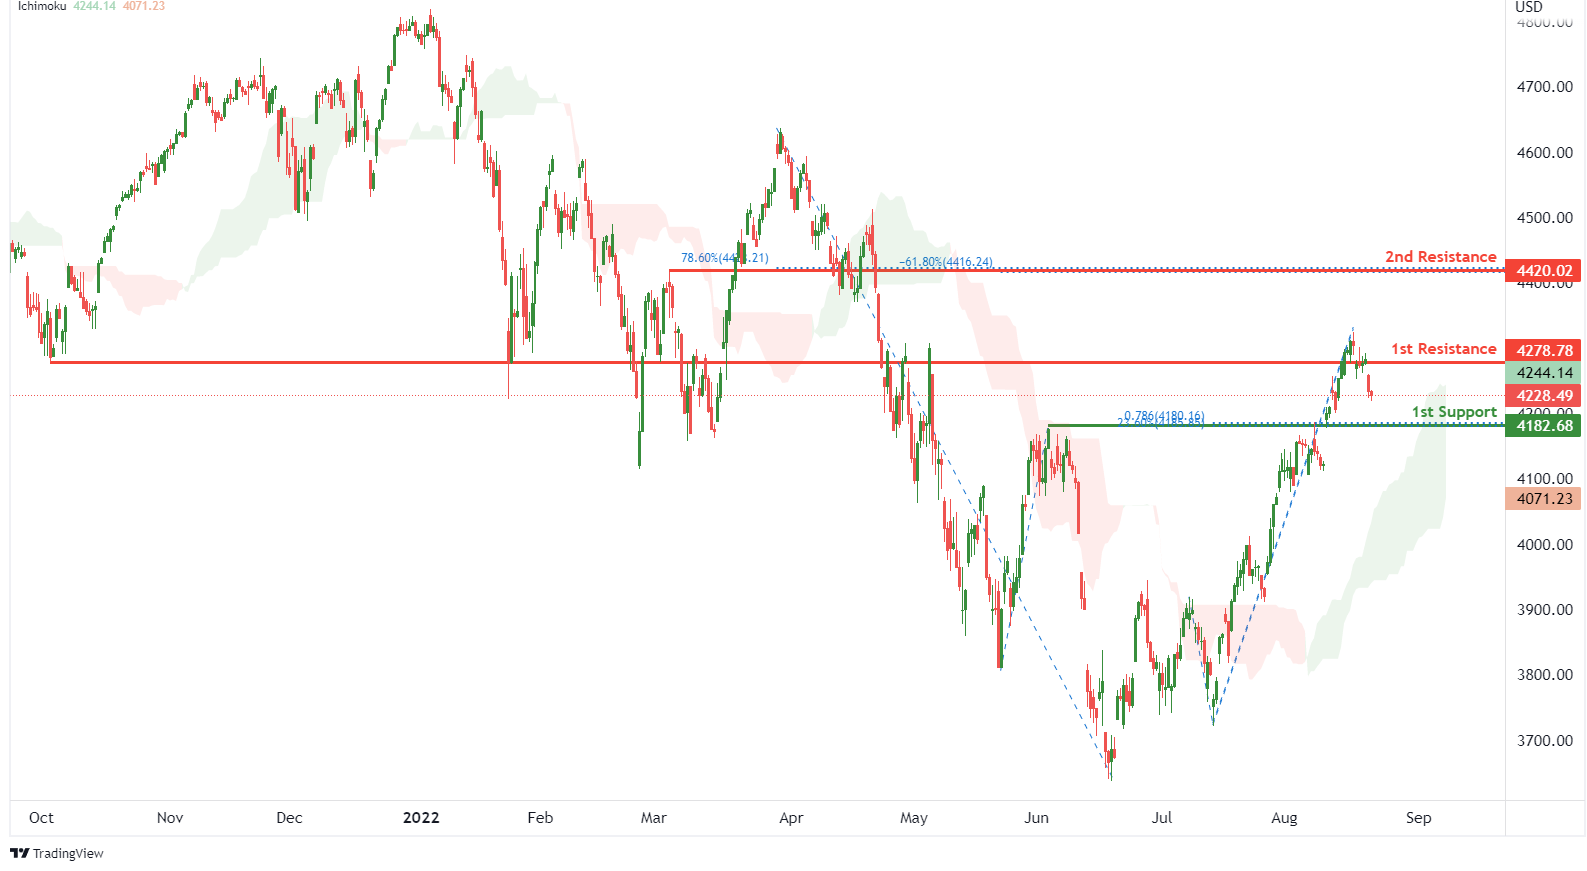
On the H4, with prices moving above the ichimoku indicator, we have a bullish bias that the price will rise to 1st resistance at 4278.78 where the overlap resistance is. Once there is upside confirmation of price breaking 1st resistance structure, we would expect bullish momentum to carry price to 2nd resistance at 4420.02 where the pullback resistance, 78.6% fibonacci retracement and -61.8% fibonacci expansion are. Alternatively, price could drop to 1st support at 4182.68 where the pullback support, 78.6% fibonacci projection and 23.6% fibonacci retracement are.
Areas of consideration:
H4 time frame, 1st resistance of 4278.78
H4 time frame, 1st support at 4182.68